7.1 How Microbes Grow
Learning Objectives
- Define the generation time for growth based on binary fission
- Identify and describe the activities of microorganisms undergoing typical phases of binary fission (simple cell division) in a growth curve
- Describe the formation and characteristics of biofilms
- Identify health risks associated with biofilms and how they are addressed
- Describe quorum sensing and its role in cell-to-cell communication and coordination of cellular activities
The bacterial cell cycle involves the formation of new cells through the replication of DNA and partitioning of cellular components into two daughter cells. In prokaryotes, reproduction is always asexual, although extensive genetic recombination in the form of horizontal gene transfer takes place, as will be explored in a different chapter. Most bacteria have a single circular chromosome; however, some exceptions exist. For example, Borrelia burgdorferi, the causative agent of Lyme disease, has a linear chromosome.
Binary Fission
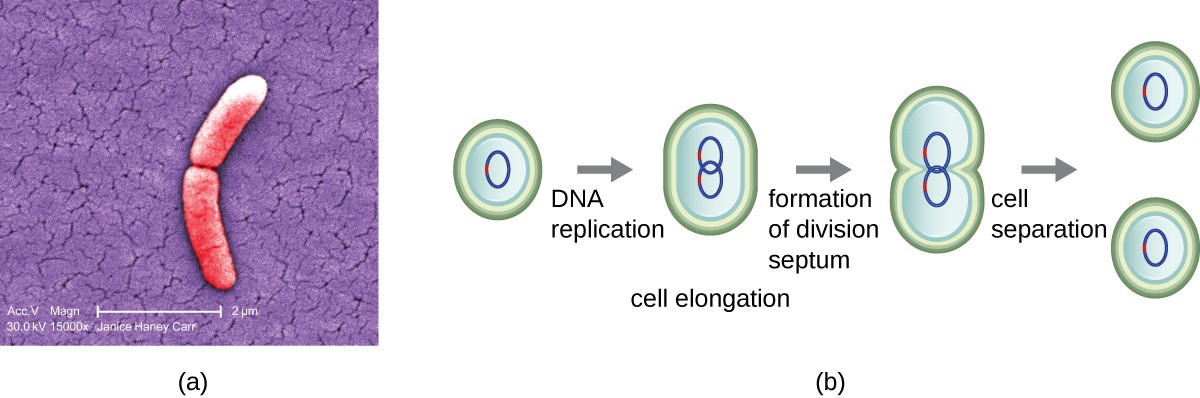
The most common mechanism of cell replication in bacteria is a process called binary fission, which is depicted in Figure 7.2. Before dividing, the cell grows and increases its number of cellular components. Next, the replication of DNA starts at a location on the circular chromosome called the origin of replication, where the chromosome is attached to the inner cell membrane. Replication continues in opposite directions along the chromosome until the terminus is reached.
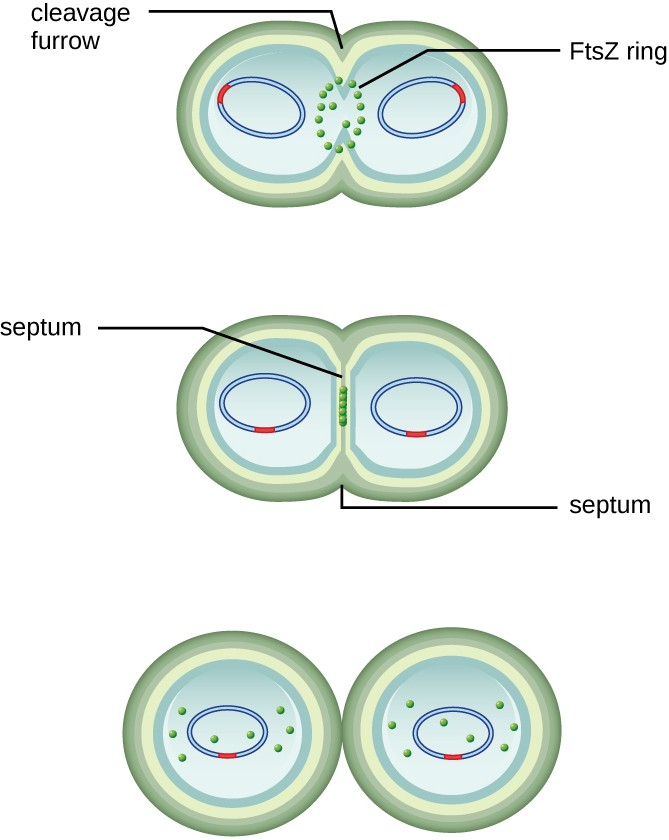
The center of the enlarged cell constricts until two daughter cells are formed, each offspring receiving a complete copy of the parental genome and a division of the cytoplasm (cytokinesis). This process of cytokinesis and cell division is directed by a protein called FtsZ. FtsZ assembles into a Z ring on the cytoplasmic membrane (Figure 7.3). The Z ring is anchored by FtsZ-binding proteins and defines the division plane between the two daughter cells. Additional proteins required for cell division are added to the Z ring to form a structure called the divisome. The divisome activates to produce a peptidoglycan cell wall and build a septum that divides the two daughter cells. The daughter cells are separated by the division septum, where all of the cells’ outer layers (the cell wall and outer membranes, if present) must be remodeled to complete division.
![]()
- What is the name of the protein that assembles into a Z ring to initiate cytokinesis and cell division?
Generation Time
In eukaryotic organisms, the generation time is the time between the same points of the life cycle in two successive generations. For example, the typical generation time for the human population is 25 years. This definition is not practical for bacteria, which may reproduce rapidly or remain dormant for thousands of years. In prokaryotes (Bacteria and Archaea), the generation time is also called the doubling time and is defined as the time it takes for the population to double through one round of binary fission. Bacterial doubling times vary enormously. Whereas Escherichia coli can double in as little as 20 minutes under optimal growth conditions in the laboratory, bacteria of the same species may need several days to double in especially harsh environments. Most pathogens grow rapidly, like E.coli, but there are exceptions. For example, Mycobacterium tuberculosis, the causative agent of tuberculosis, has a generation time of between 15 and 20 hours. On the other hand, M. leprae, which causes Hansen’s disease (leprosy), grows much more slowly, with a doubling time of 14 days.
Micro Connections
Calculating Number of Cells
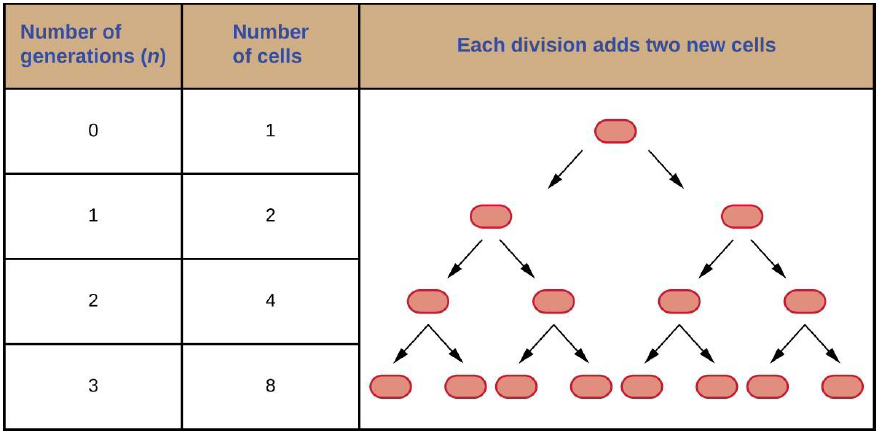
It is possible to predict the number of cells in a population when they divide by binary fission at a constant rate. As an example, consider what happens if a single cell divides every 30 minutes for 24 hours. The diagram in Figure 7.4 shows the increase in cell numbers for the first three generations.
The number of cells increases exponentially and can be expressed as 2n, where n is the number of generations. If cells divide every 30 minutes, after 24 hours, 48 divisions would have taken place. If we apply the formula 2n, where n is equal to 48, the single cell would give rise to 248 or 281,474,976,710,656 cells at 48 generations (24 hours). When dealing with such huge numbers, it is more practical to use scientific notation. Therefore, we express the number of cells as 2.8 × 10¹⁴ cells.
In our example, we used one cell as the initial number of cells. For any number of starting cells, the formula is adapted as follows:
Nn = N02n
Nn is the number of cells at any generation n, N0 is the initial number of cells, and n is the number of generations.
![]()
- With a doubling time of 30 minutes and a starting population size of 100 cells, how many cells will be present after 2 hours, assuming no cell death?
The Growth Curve
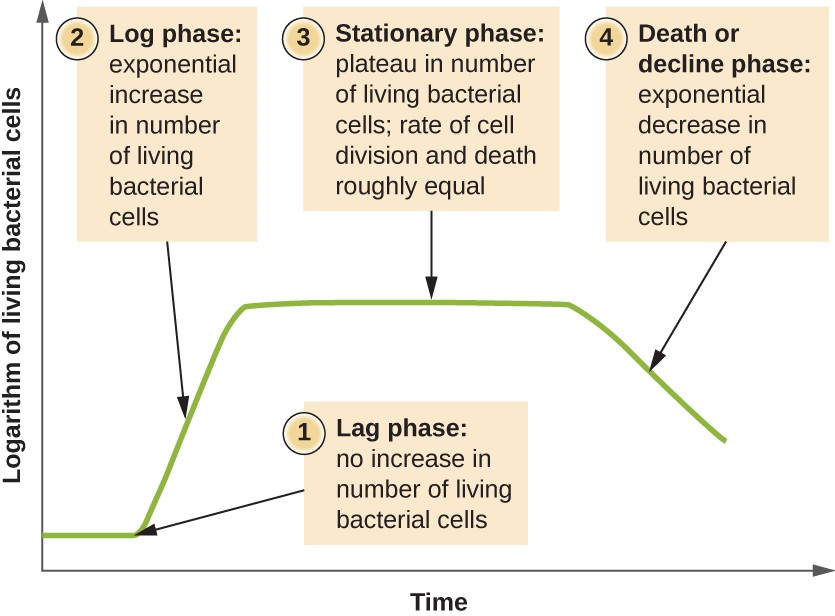
Microorganisms grown in closed culture (also known as a batch culture), in which no nutrients are added and most waste is not removed, follow a reproducible growth pattern referred to as the growth curve. An example of a batch culture in nature is a pond in which a small number of cells grow in a closed environment. The culture density is defined as the number of cells per unit volume. In a closed environment, the culture density is also a measure of the number of cells in the population. Infections of the body do not always follow the growth curve, but correlations can exist depending upon the site and type of infection. When the number of live cells is plotted against time, distinct phases can be observed in the curve (Figure 7.5).
The Lag Phase
The beginning of the growth curve represents a small number of cells, referred to as an inoculum, that are added to a fresh culture medium, a nutritional broth that supports growth. The initial phase of the growth curve is called the lag phase, during which cells are gearing up for the next phase of growth. The number of cells does not change during the lag phase; however, cells grow larger and are metabolically active, synthesizing proteins needed to grow within the medium. If any cells were damaged or shocked during the transfer to the new medium, repair takes place during the lag phase. The duration of the lag phase is determined by many factors, including the species and genetic make-up of the cells, the composition of the medium, and the size of the original inoculum.
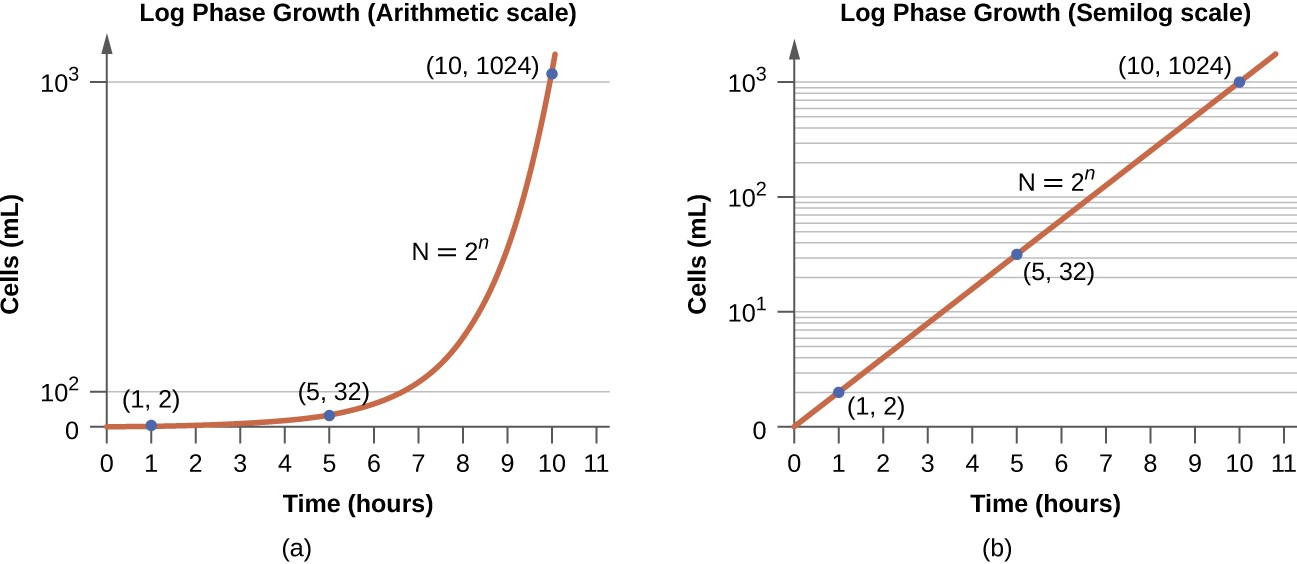
The Log Phase
In the logarithmic (log) phase, sometimes called exponential growth phase, the cells are actively dividing by binary fission and their number increases exponentially. During the log phase, the relationship between time and number of cells is not linear but exponential; however, the growth curve is often plotted on a semilogarithmic graph, as shown in Figure 7.6, which gives the appearance of a linear relationship.
Cells in the log phase show constant growth rate and uniform metabolic activity. For this reason, cells in the log phase are preferentially used for industrial applications and research work. The log phase is also the stage where bacteria are the most susceptible to the action of disinfectants and common antibiotics that affect protein, DNA, and cell-wall synthesis.
Stationary Phase
As the number of cells increases through the log phase, several factors contribute to a slowing of the growth rate. Waste products accumulate and nutrients are gradually used up. In addition, gradual depletion of oxygen begins to limit aerobic cell growth. This combination of unfavorable conditions slows and finally stalls population growth. The total number of live cells reaches a plateau referred to as the stationary phase (Figure 7.5). In this phase, the number of new cells created by cell division is now equivalent to the number of cells dying; thus, the total population of living cells is relatively stagnant. The culture density in a stationary culture is constant. The culture’s carrying capacity, or maximum culture density, depends on the types of microorganisms in the culture and the specific conditions of the culture; however, carrying capacity is constant for a given organism grown under the same conditions.
During the stationary phase, cells switch to a survival mode of metabolism. As growth slows, so too does the synthesis of peptidoglycans, proteins, and nucleic-acids; thus, stationary cultures are less susceptible to antibiotics that disrupt these processes. In bacteria capable of producing endospores, many cells undergo sporulation during the stationary phase. Secondary metabolites, including antibiotics, are synthesized in the stationary phase. In certain pathogenic bacteria, the stationary phase is also associated with the expression of virulence factors, products that contribute to a microbe’s ability to survive, reproduce, and cause disease in a host organism. For example, quorum sensing in Staphylococcus aureus initiates the production of enzymes that can break down human tissue and cellular debris, clearing the way for bacteria to spread to new tissue where nutrients are more plentiful.
The Death Phase
As a culture medium accumulates toxic waste and nutrients are exhausted, cells die in greater and greater numbers. Soon, the number of dying cells exceeds the number of dividing cells, leading to an exponential decrease in the number of cells (Figure 7.5). This is the aptly named death phase, sometimes called the decline phase. Many cells lyse and release nutrients into the medium, allowing surviving cells to maintain viability and form endospores. A few cells, the so-called persisters, are characterized by a slow metabolic rate. Persister cells are medically important because they are associated with certain chronic infections, such as tuberculosis, that do not respond to antibiotic treatment.
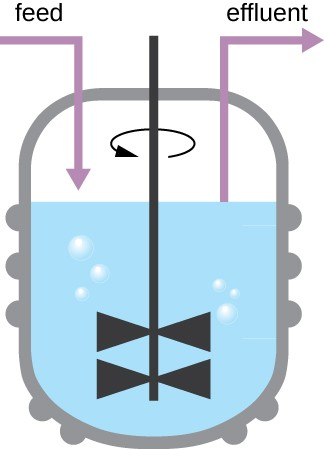
Sustaining Microbial Growth
The growth pattern shown in Figure 7.5 takes place in a closed environment; nutrients are not added and waste and dead cells are not removed. In many cases, though, it is advantageous to maintain cells in the logarithmic phase of growth. One example is in industries that harvest microbial products. A chemostat (Figure 7.7) is used to maintain a continuous culture in which nutrients are supplied at a steady rate. A controlled amount of air is mixed in for aerobic processes. Bacterial suspension is removed at the same rate as nutrients flow in to maintain an optimal growth environment.
![]()
- During which phase does growth occur at the fastest rate?
- Name two factors that limit microbial growth.
Biofilms
In nature, microorganisms grow mainly in biofilms, complex and dynamic ecosystems that form on a variety of environmental surfaces, from industrial conduits and water treatment pipelines to rocks in river beds. Biofilms are not restricted to solid surface substrates, however. Almost any surface in a liquid environment containing some minimal nutrients will eventually develop a biofilm. Microbial mats that float on water, for example, are biofilms that contain large populations of photosynthetic microorganisms. Biofilms found in the human mouth may contain hundreds of bacterial species. Regardless of the environment where they occur, biofilms are not random collections of microorganisms; rather, they are highly structured communities that provide a selective advantage to their constituent microorganisms.
Biofilm Structure
Observations using confocal microscopy have shown that environmental conditions influence the overall structure of biofilms. Filamentous biofilms called streamers form in rapidly flowing water, such as freshwater streams, eddies, and specially designed laboratory flow cells that replicate growth conditions in fast-moving fluids. The streamers are anchored to the substrate by a “head” and the “tail” floats downstream in the current. In still or slow-moving water, biofilms mainly assume a mushroom-like shape. The structure of biofilms may also change with other environmental conditions such as nutrient availability.
Detailed observations of biofilms under confocal laser and scanning electron microscopes reveal clusters of microorganisms embedded in a matrix interspersed with open water channels. The extracellular matrix consists of extracellular polymeric substances (EPS) secreted by the organisms in the biofilm. The extracellular matrix represents a large fraction of the biofilm, accounting for 50%–90% of the total dry mass. The properties of the EPS vary according to the resident organisms and environmental conditions but is composed primarily of polysaccharides and containing other macromolecules such as proteins, nucleic acids, and lipids. It plays a key role in maintaining the integrity and function of the biofilm. Channels in the EPS allow movement of nutrients, waste, and gases throughout the biofilm. This keeps the cells hydrated, preventing desiccation. EPS also shelters organisms in the biofilm from predation by other microbes or cells (e.g., protozoans, white blood cells in the human body).
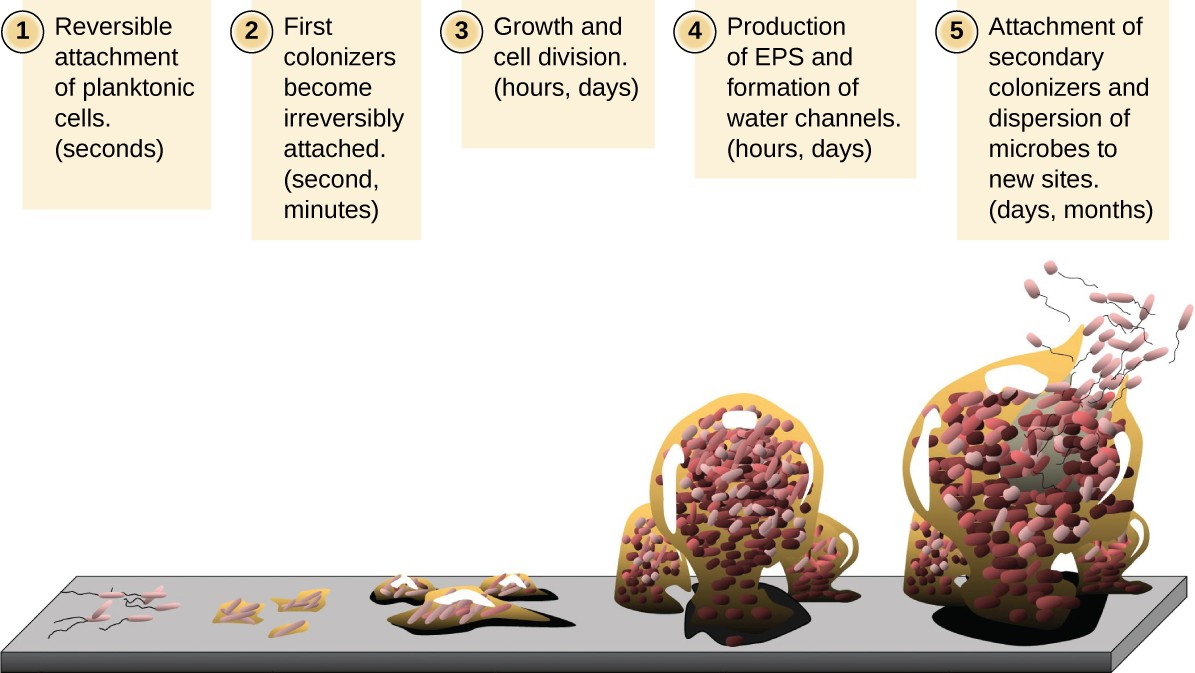
Biofilm Formation
Free-floating microbial cells that live in an aquatic environment are called planktonic cells. The formation of a biofilm essentially involves the attachment of planktonic cells to a substrate, where they become sessile (attached to a surface). This occurs in stages, as depicted in Figure 7.8. The first stage involves the attachment of planktonic cells to a surface coated with a conditioning film of organic material. At this point, attachment to the substrate is reversible, but as cells express new phenotypes that facilitate the formation of EPS, they transition from a planktonic to a sessile lifestyle. The biofilm develops characteristic structures, including an extensive matrix and water channels. Appendages such as fimbriae, pili, and flagella interact with the EPS, and microscopy and genetic analysis suggest that such structures are required for the establishment of a mature biofilm. In the last stage of the biofilm life cycle, cells on the periphery of the biofilm revert to a planktonic lifestyle, sloughing off the mature biofilm to colonize new sites. This stage is referred to as dispersal.
Within a biofilm, different species of microorganisms establish metabolic collaborations in which the waste product of one organism becomes the nutrient for another. For example, aerobic microorganisms consume oxygen, creating anaerobic regions that promote the growth of anaerobes. This occurs in many polymicrobial infections that involve both aerobic and anaerobic pathogens.
The mechanism by which cells in a biofilm coordinate their activities in response to environmental stimuli is called quorum sensing. Quorum sensing—which can occur between cells of different species within a biofilm—enables microorganisms to detect their cell density through the release and binding of small, diffusible molecules called autoinducers. When the cell population reaches a critical threshold (a quorum), these autoinducers initiate a cascade of reactions that activate genes associated with cellular functions that are beneficial only when the population reaches a critical density. For example, in some pathogens, synthesis of virulence factors only begins when enough cells are present to overwhelm the immune defenses of the host. Although mostly studied in bacterial populations, quorum sensing takes place between bacteria and eukaryotes and between eukaryotic cells such as the fungus Candida albicans, a common member of the human microbiota that can cause infections in immunocompromised individuals.
Biofilms and Human Health
The human body harbors many types of biofilms, some beneficial and some harmful. For example, the layers of normal microbiota lining the intestinal and respiratory mucosa play a role in warding off infections by pathogens. However, other biofilms in the body can have a detrimental effect on health. For example, the plaque that forms on teeth is a biofilm that can contribute to dental and periodontal disease. Biofilms can also form in wounds, sometimes causing serious infections that can spread. The bacterium Pseudomonas aeruginosa often colonizes biofilms in the airways of patients with cystic fibrosis, causing chronic and sometimes fatal infections of the lungs. Biofilms can also form on medical devices used in or on the body, causing infections in patients with in-dwelling catheters, artificial joints, or contact lenses.
Pathogens embedded within biofilms exhibit a higher resistance to antibiotics than their free-floating counterparts. Several hypotheses have been proposed to explain why. Cells in the deep layers of a biofilm are metabolically inactive and may be less susceptible to the action of antibiotics that disrupt metabolic activities. The EPS may also slow the diffusion of antibiotics and antiseptics, preventing them from reaching cells in the deeper layers of the biofilm. Phenotypic changes may also contribute to the increased resistance exhibited by bacterial cells in biofilms. For example, the increased production of efflux pumps, membrane-embedded proteins that actively extrude antibiotics out of bacterial cells, have been shown to be an important mechanism of antibiotic resistance among biofilm-associated bacteria. Finally, biofilms provide an ideal environment for the exchange of extrachromosomal DNA, which often includes genes that confer antibiotic resistance.
![]()
- What is the matrix of a biofilm composed of?
- What is the role of quorum sensing in a biofilm?
