12.1 The Language of Epidemiologists
Learning Objectives
- Explain the difference between prevalence and incidence of disease
- Distinguish the characteristics of sporadic, endemic, epidemic, and pandemic diseases
- Explain the relationship between epidemiology and public health
The field of epidemiology concerns the geographical distribution and timing of infectious disease occurrences and how they are transmitted and maintained in nature, with the goal of recognizing and controlling outbreaks. The science of epidemiology includes etiology (the study of the causes of disease) and investigation of disease transmission (mechanisms by which a disease is spread).
Analyzing Disease in a Population
Epidemiological analyses are always carried out with reference to a population, which is the group of individuals that are at risk for the disease or condition. The population can be defined geographically, but if only a portion of the individuals in that area are susceptible, additional criteria may be required. Susceptible individuals may be defined by particular behaviors, such as intravenous drug use, owning particular pets, or membership in an institution, such as a college. Being able to define the population is important because most measures of interest in epidemiology are made with reference to the size of the population.
The state of being diseased is called morbidity. Morbidity in a population can be expressed in a few different ways. Morbidity or total morbidity is expressed in numbers of individuals without reference to the size of the population. The morbidity rate can be expressed as the number of diseased individuals out of a standard number of individuals in the population, such as 100,000, or as a percent of the population.
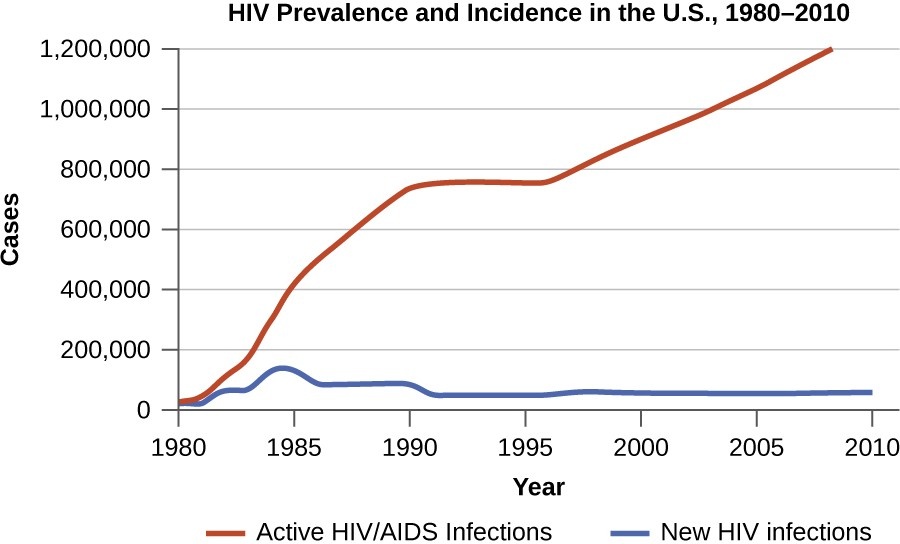
There are two aspects of morbidity that are relevant to an epidemiologist: a disease’s prevalence and its incidence. Prevalence is the number, or proportion, of individuals with a particular illness in a given population at a point in time. For example, the Centers for Disease Control and Prevention (CDC) estimated that in 2012, there were about 1.2 million people 13 years and older with an active human immunodeficiency virus (HIV) infection. Expressed as a proportion, or rate, this is a prevalence of 467 infected persons per 100,000 in the population.[1] On the other hand, incidence is the number or proportion of new cases in a period of time. For the same year and population, the CDC estimates that there were 43,165 newly diagnosed cases of HIV infection, which is an incidence of 13.7 new cases per 100,000 in the population.[2] The relationship between incidence and prevalence can be seen in Figure 12.2. For a chronic disease like HIV infection, prevalence will generally be higher than incidence because it represents the cumulative number of new cases over many years minus the number of cases that are no longer active (e.g., because the patient died or was cured).
In addition to morbidity rates, the incidence and prevalence of mortality (death) may also be reported. A mortality rate can be expressed as the percentage of the population that has died from a disease or as the number of deaths per 100,000 persons (or other suitable standard number).
![]()
- Explain the difference between incidence and prevalence.
- Describe how morbidity and mortality rates are expressed.
Patterns of Incidence
Diseases that are seen only occasionally, and usually without geographic concentration, are called sporadic diseases. Examples of sporadic diseases include tetanus, rabies, and plague. In the United States, Clostridium tetani, the bacterium that causes tetanus, is ubiquitous in the soil environment, but incidences of infection occur only rarely and in scattered locations because most individuals are vaccinated, clean wounds appropriately, or are only rarely in a situation that would cause infection.[3] Likewise in the United States there are a few scattered cases of plague each year, usually contracted from rodents in rural areas in the western states.[4]
Diseases that are constantly present (often at a low level) in a population within a particular geographic region are called endemic diseases. For example, malaria is endemic to some regions of Brazil, but is not endemic to the United States.
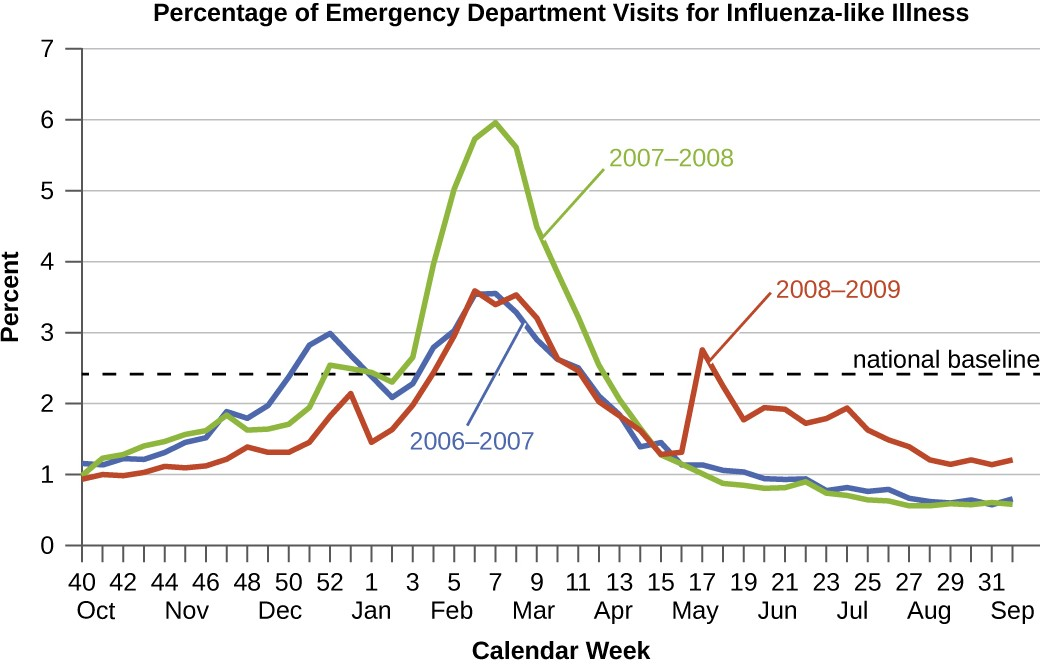
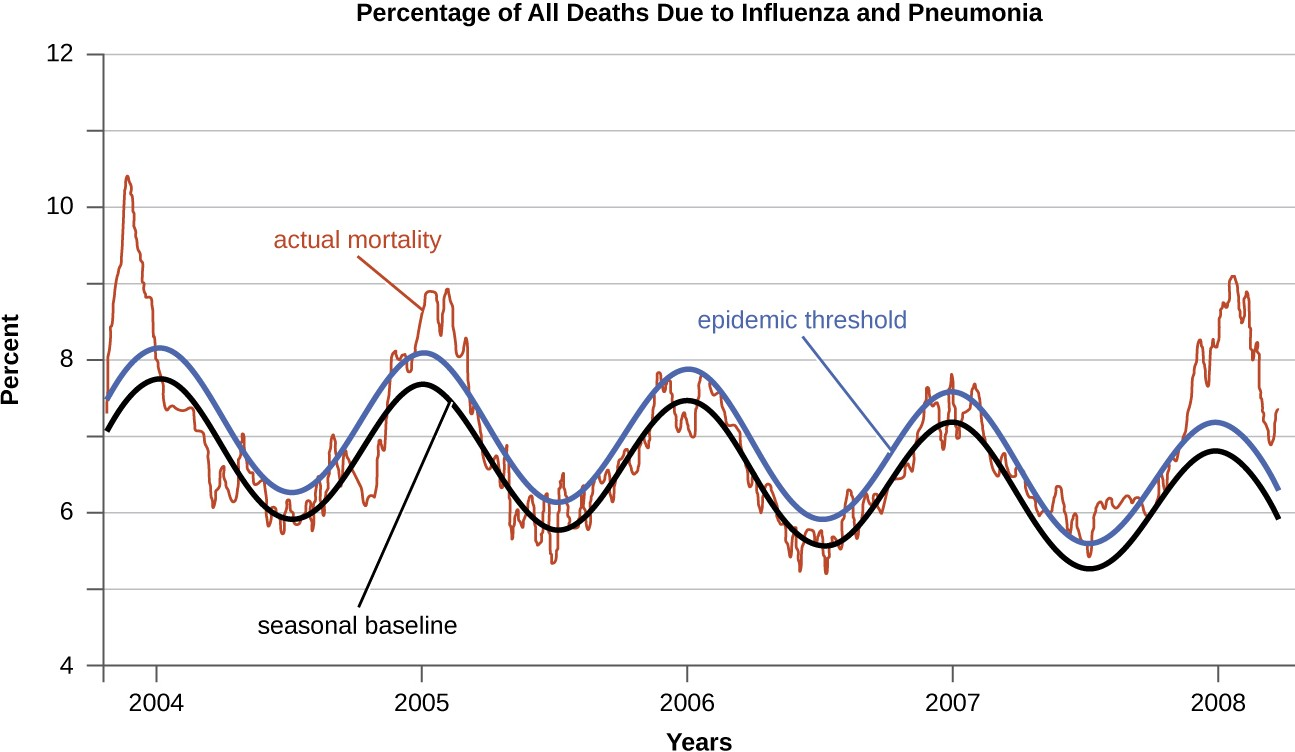
Diseases for which a larger than expected number of cases occurs in a short time within a geographic region are called epidemic diseases. Influenza is a good example of a commonly epidemic disease. Incidence patterns of influenza tend to rise each winter in the northern hemisphere. These seasonal increases are expected, so it would not be accurate to say that influenza is epidemic every winter; however, some winters have an usually large number of seasonal influenza cases in particular regions, and such situations would qualify as epidemics (Figure 12.3 and Figure 12.4).
An epidemic disease signals the breakdown of an equilibrium in disease frequency, often resulting from some change in environmental conditions or in the population. In the case of influenza, the disruption can be due to antigenic shift or drift (see Virulence Factors of Bacterial and Viral Pathogens), which allows influenza virus strains to circumvent the acquired immunity of their human hosts.
An epidemic that occurs on a worldwide scale is called a pandemic disease. For example, HIV/AIDS is a pandemic disease and novel influenza virus strains often become pandemic.
![]()
- Explain the difference between sporadic and endemic disease.
- Explain the difference between endemic and epidemic disease.
Etiology
When studying an epidemic, an epidemiologist’s first task is to determinate the cause of the disease, called the etiologic agent or causative agent. Connecting a disease to a specific pathogen can be challenging because of the extra effort typically required to demonstrate direct causation as opposed to a simple association. It is not enough to observe an association between a disease and a suspected pathogen; controlled experiments are needed to eliminate other possible causes. In addition, pathogens are typically difficult to detect when there is no immediate clue as to what is causing the outbreak. Signs and symptoms of disease are also commonly nonspecific, meaning that many different agents can give rise to the same set of signs and symptoms. This complicates diagnosis even when a causative agent is familiar to scientists.
![]()
- List some challenges to determining the causative agent of a disease outbreak.
The Role of Public Health Organizations
The main national public health agency in the United States is the Centers for Disease Control and Prevention (CDC), an agency of the Department of Health and Human Services. The CDC is charged with protecting the public from disease and injury. One way that the CDC carries out this mission is by overseeing the National Notifiable Disease Surveillance System (NNDSS) in cooperation with regional, state, and territorial public health departments. The NNDSS monitors diseases considered to be of public health importance on a national scale. Such diseases are called notifiable diseases or reportable diseases because all cases must be reported to the CDC. A physician treating a patient with a notifiable disease is legally required to submit a report on the case. Notifiable diseases include HIV infection, measles, West Nile virus infections, and many others. Some states have their own lists of notifiable diseases that include diseases beyond those on the CDC’s list.
Notifiable diseases are tracked by epidemiological studies and the data is used to inform health-care providers and the public about possible risks. The CDC publishes the Morbidity and Mortality Weekly Report (MMWR), which provides physicians and health-care workers with updates on public health issues and the latest data pertaining to notifiable diseases. Table 12.1 is an example of the kind of data contained in the MMWR.
|
Disease |
Current Week (Jan 2, 2016) |
Median of Previous 52 Weeks |
Maximum of Previous 52 Weeks |
Cumulative Cases 2015 |
|---|---|---|---|---|
|
Campylobacteriosis |
406 |
869 |
1,385 |
46,618 |
|
Chlamydia trachomatis infection |
11,024 |
28,562 |
31,089 |
1,425,303 |
|
Giardiasis |
115 |
230 |
335 |
11,870 |
|
Gonorrhea |
3,207 |
7,155 |
8,283 |
369,926 |
Link to Learning
The current Morbidity and Mortality Weekly Report is available online (https://openstax.org/l/22mortweekrep).
![]()
- Describe how health agencies obtain data about the incidence of diseases of public health importance.
- H. Irene Hall, Qian An, Tian Tang, Ruiguang Song, Mi Chen, Timothy Green, and Jian Kang. “Prevalence of Diagnosed and Undiagnosed HIV Infection—United States, 2008–2012.” Morbidity and Mortality Weekly Report 64, no. 24 (2015): 657–662. ↵
- Centers for Disease Control and Prevention. “Diagnoses of HIV Infection in the United States and Dependent Areas, 2014.” HIV Surveillance Report 26 (2015). ↵
- Centers for Disease Control and Prevention. “Tetanus Surveillance—United States, 2001–2008.” Morbidity and Mortality Weekly Report 60, no. 12 (2011): 365. ↵
- Centers for Disease Control and Prevention. “Plague in the United States.” 2015. http://www.cdc.gov/plague/maps. Accessed June 1, 2016. ↵
