12 Reporting
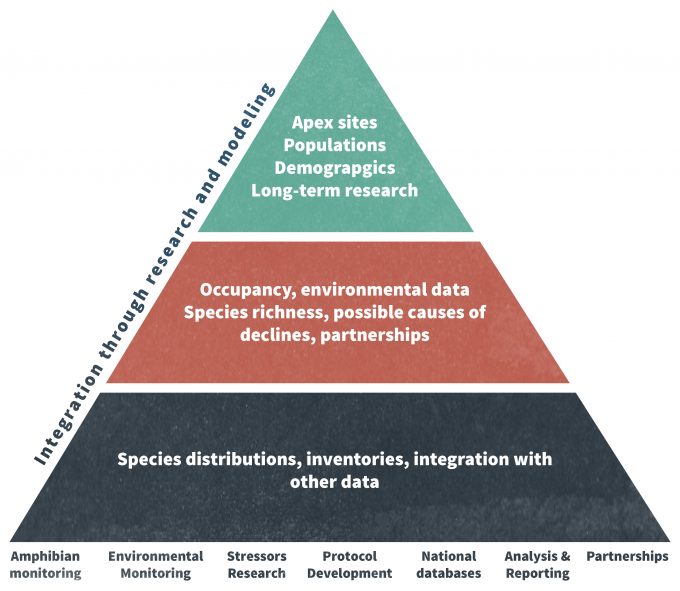
The information that monitoring generates can only be put to use if it is made available in a timely way. Shortly after the monitoring program is terminated, therefore, a formal final report must be developed. Yet this should ideally be the final step in a continual process of communication. Interim monitoring reports should also be provided frequently throughout the duration of monitoring. This may occur annually (e.g., USGS Breeding Bird Survey data; Sauer et al. 2008), or periodically (Forest Inventory and Analysis data; Smith et al. 2004) depending on the program, but must be done often enough for the reporting of monitoring data to allow for rapid response within an adaptive management framework. Frequent communication of monitoring data is also important because it helps inform research approaches. In a sense, the data represent a middle ground between research and monitoring (Figure 12.1).
Aside from the temporal aspects, the successful reporting of data has two components. First, all potential users of the data must be given a means to readily access the report. Web-based dissemination certainly is the most likely way of getting information out, especially with powerful search engines now available, but providing copies directly to stakeholders is also necessary. If a report is made available, but some stakeholders are not aware of its availability, then the information is not of use, and worse, the stakeholder may feel marginalized. Proprietary restrictions (if they exist) can hinder the communication process, thus it is best to avoid them provided that doing so does not decrease the quality of the report.
Second, and perhaps most important, the report and the data within them must be presented in a well-organized and visually appealing (i.e., a picture if worth a thousand words) format that is easy for stakeholders to understand. The format is an important consideration given that even if an effective means of disseminating the reports is chosen, an unclear or otherwise poor format may make the data inaccessible.
Format of a Monitoring Report
Some web-based reports are simply interpretations of data in text form for the general public. Others use web interfaces to provide summaries in a variety of ways for various time periods over various areas, all specified by the user (e.g., annual summaries from the Audubon’s Christmas Bird Count). Most however, are pdf files and have a standard format to allow the users to find the information that they need quickly while still understanding any potential biases, limitations or interpretations of the data.
Both interim and final reports and other products such as predictive or conceptual models should be designed in the way that best meets the particular information requirements for which the project was intended to address. Hence there is no single format that should be followed. Within this chapter, we provide an annotated list of elements that together comprise a generalized, commonly used format, but these pieces should be adapted to meet the needs of a particular client or set of stakeholders.
Title
The title should concisely state what, when and where the monitoring data were collected. Avoid long titles. “Southwestern willow flycatcher 2002 survey and nest monitoring report” is a perfectly acceptable title. Or is it? Albeit succinct and to the point, we do not know where the monitoring occurred. Throughout the range of the species? In one state? In part of one state? Making such a distinction could make the difference between a potential user reading or not reading the report. In this instance, the results are synthesized range wide so simply adding that term would clarify the scope of the monitoring effort and report (Sogge et al. 2003).
Abstract or Executive Summary
Although it may be very important to do so, most readers of a monitoring report will not dig into the details of the methods and results. Providing a brief informative abstract or executive summary is therefore essential. An executive summary is a very concise version of the report that includes brief descriptions of data, analysis, and interpretations. An executive summary should provide an understanding of:
- The goals and objectives of the monitoring work
- What important decisions or actions these data could help inform
- How the data can (or cannot) answer these questions
- Limitations of the data including scope of inference both in space and time
- Implications of the trends and recommendations, if appropriate
- Future needs
An abstract is similar to an executive summary but is usually more of a condensed overview of just the objectives and the findings and includes little in the way of interpretation. Generally an executive summary for a monitoring report is 2-3 pages while an abstract is about a page or less.
Introduction
The introduction should outline the reasons for inventorying and/or monitoring the population, species, community or ecosystem of interest. It is useful to include ample contextual information that communicates to the reader precisely why monitoring or inventorying was ecologically, economically, culturally, or otherwise justifiable. Suggestions for this section include:
- A statement of the management problem or policy that prompted the inventory and/or monitoring project,
- A summary of current knowledge about the population, species, community or ecosystem that is relevant to the management problem or policy driving the monitoring plan,
- A statement of the goals and objectives for the monitoring plan, and
- Hypotheses and conceptual models that guided sampling, data analysis, and data interpretation.
Study Area
This section should first establish the general spatial and temporal scales of the project and the rationale for the scope. Then, more specifically, the grain, extent and context for the study should be described in detail. The grain refers to the finest level of detail measured in the study (i.e., patch size) and you should indicate why this grain size was chosen. The extent is the outer bounds of the sampling framework. This may be a species’ geographic range, a watershed, or a property boundary. You should make an effort to describe the chosen extent relative to the space used or needed by the populations, species, communities or ecosystems of interest, especially if the outer bounds are delineated based on anthropogenic criteria. A map should also be included with sufficient detail to allow the reader to understand the context within which the extent is embedded; exactly which components of the broader landscape are and are not included in the sampling effort is often highly significant to stakeholders.
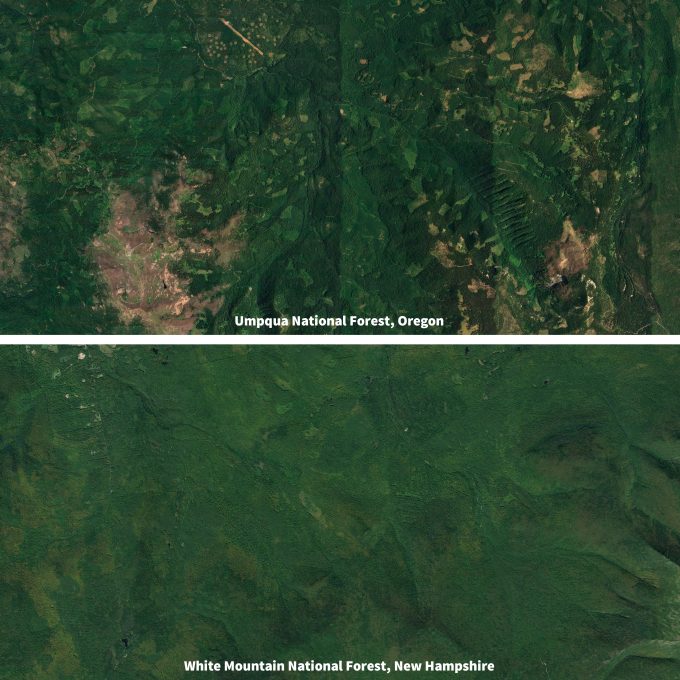
Typically the geology, soils, climate, and physiognomy or vegetation is described in this section to reinforce the broad spatial overview. Without describing biophysical factors that could have an influence on the patterns of results seen over space and/or time in sufficient detail, the reader may not understand why patterns were observed. Any pertinent land management actions such as roads, development, timber harvest, or agricultural practices should also be described in sufficient detail so that the reader can understand how these actions may influence results. It is particularly helpful to map how these anthropogenic disturbances relate to the area being monitored and to then provide copies in the report (Figure 12.2). Also, as anthropogenic disturbances typically change in their intensity and location over time, it is important to describe the temporal context of current maps and the implications this history has for the surrounding ecosystem. This can be succinctly done through the use of a chronosequence.
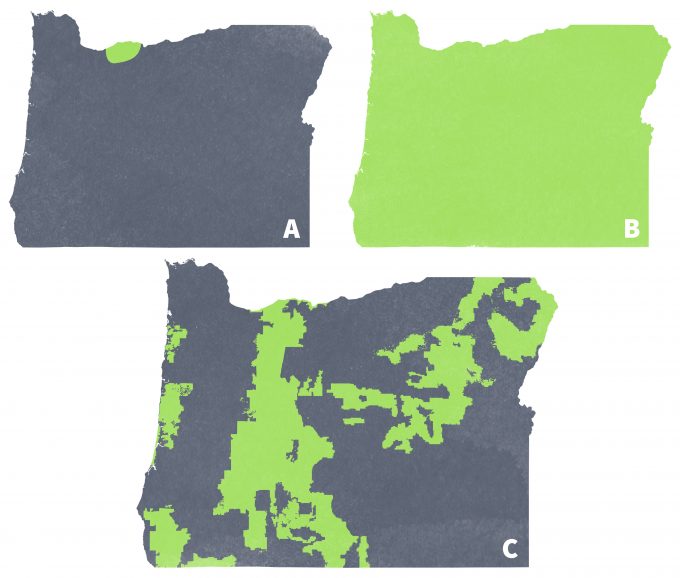
Finally, background information on the population, species, community or ecosystem of interest should also be provided. Descriptions of the geographic range of the species, its home range, habitat elements, competitors and predators allow the reader to interpret the results more completely. For example, a report on the monitoring of amphibians in the Mt. Hood National Forest may be particularly important with regards to changes in the abundance or distribution of Larch mountain salamanders but may be less important with regards to species such as Pacific chorus frogs due to differences in geographic distribution (Figure 12.3). To understand trends in the latter species, coordinated monitoring efforts among many land management agencies and owners would be needed.
Methods
The gold standard for the methods section is that a reader be able to use it to repeat exactly what was done and produce comparable results. This necessitates considerable attention to detail in documenting the sampling and analytical procedures. This section should include:
- The rationale for selecting sampling units. Be sure to indicate if sampling was random or systematic and if not random, then indicate what biases may be inherent in the resulting data. Any irregularities in selection of sampling sites such as failure to acquire permission to enter private lands, access to the sites, or other biases need to be described in detail and interpreted in the Discussion section.
- A description of the sampling design. Explain the overall sampling design and which state variables were measured (e.g., presence-absence, correlative, Before-After Control-Impact), the rationale for using that design, as well as the analytical model that the data was expected to populate. For instance, if data were collected from random sites among 3 strata, be clear as to how the strata were defined. Explain if any treatment effects were nested within other ‘treatments’, and what type of statistical approach was appropriate for analysis. Of particular importance is an explanation of the determination of an appropriate sample size used in the monitoring effort. Clearly discuss the sample size from both a statistical power standpoint as well as from a logistical standpoint. Should the sample size be less than optimal based on power analysis, then also note the influence of the reduced sample size on the statistical power. In many cases, a repeated sampling design may have been used to develop detection probability estimates. The report should be clear as to whether the sampling design was of a repeated nature, and if so, in what fashion were the repeated visits standardized.
- A summary of field methods for locating sampling units and collecting data. Much of this could be included in an appendix containing copies of the field protocols, data sheets and detailed maps, but give enough detail here to ensure that easily avoidable biases will not be overlooked. Some of the most common biases are a result of differences in observers, or weather, temporal or spatial factors; explicitly addressing these topics is suggested.
- Identification of ancillary data used in the analysis. Describe all outside information used, such as satellite imagery or timber inventory data. If remotely sensed data were used, record the time that the images were taken. Similarly, if FIA or other forest inventory data were used, provide the dates of data collection, reference to specific field methods, and the location of the data. If data were acquired or downloaded from an external GIS warehouse and database, then details should be provided regarding the exact URL or appropriate contact information.
- A description of analytical methods. Provide the specific statistical methods and software platform used to calculate descriptive and comparative statistics. In cases where complex model structures are used, include the programming code used to generate the statistics. Although software changes over time it is usually far easier to recreate the model structure in another software package from an existing program than from text. If the data are stored in a relational database system, then one should also consider including the exact SQL code for querying these databases and extracting the data. Keep in mind that monitoring programs are often considered legacy projects, and a future user should be able to replicate all steps of data extraction and analysis.
- A description of measures to assure data quality. Describe personnel training and sampling activities used to minimize biases in the observation process. The results of observer skill tests, effort data, and detection probability estimates should also be reported so that the reader can understand the degree to which observation biases were included in data collection and analysis. Remember that observation biases, which may increase due to inter-observer variability among other things, diminishes the ability to detect trends and estimate state variables. In addition, address data entry, proofing and cleaning activities in detail.
Results
This section should describe the results of data collection and analysis with little to no interpretation. The findings should be summarized verbally and statistically and may also be presented in the form of tables, figures, or maps. Report all relevant aspects of the statistical results (central tendency, variance, drop in deviance, and other parameters) not only so that the information can be clearly interpreted but also so that the information can be used in meta-analysis (Gurevitch and Hedges 1999). Anderson et al. (2001) provided guidance on presenting statistical summaries in scientific papers, particularly with regard to information theoretic approaches to data analyses as well as Bayesian analyses.
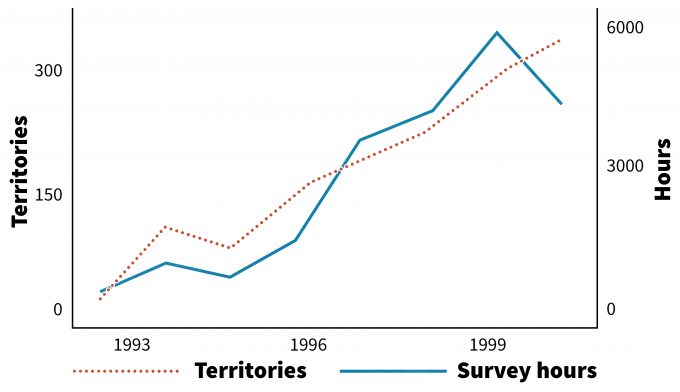
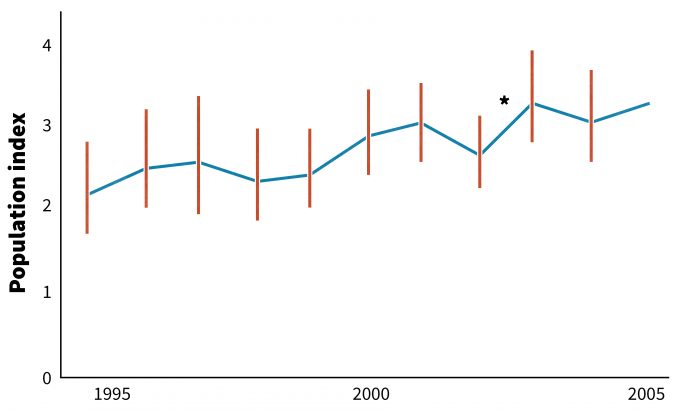
It is important to remember that all tables and figures should be able to stand alone. In other words, they should be easily interpretable even if extracted from the report. Hence the table and figure titles should clearly state what information is being displayed, where the data came from (location) and over what time period (Figure 12.4). Additional explanatory information may be placed in a footnote to the table or figure. When maps are used, be sure that legends are provided that include an explanation of the map features, scale and orientation (e.g., a north arrow).
Discussion
Because one set of data can be interpreted a number of ways depending on the goals and objectives of the party using it, some may argue that it makes sense to allow each individual to interpret the data. It can also be tempting to provide tables and figures that summarize the results without undertaking much interpretation of those results as a means of quickly disseminating monitoring data. Nonetheless, we believe that the individuals best able to interpret the data as objectively as possible are those with the most knowledge about the monitoring program: those responsible for carrying out the actual monitoring work. We suggest that the discussion, therefore, include an interpretation of the results along with an account of the pertinent knowledge accrued by the parties that undertook the monitoring. Although this may be a comparatively labor-intensive, time-consuming process, it will also make for a fully transparent and more comprehensive presentation and is generally worthwhile.
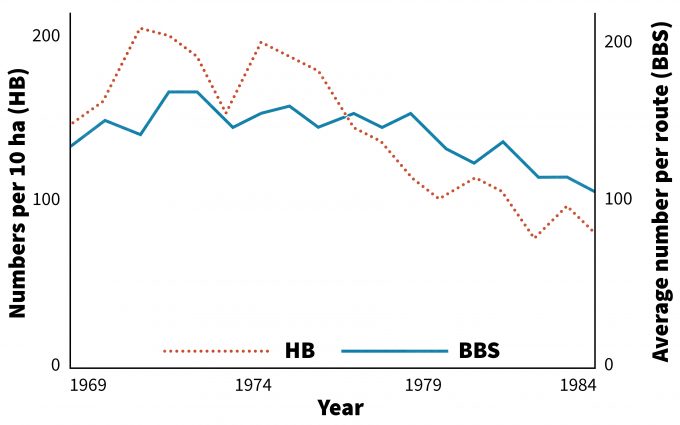
One important component of such a presentation is to compare the monitoring findings with the results of previous research and monitoring efforts for the species within the study area, as well as comparable efforts elsewhere. You may have read the pertinent literature, but it is unlikely that every user has. For instance, Holmes and Sherry (1988) compared long term monitoring of a number of bird species on a 10-ha plot to regional patterns of abundance. In this case, generalized trends were remarkably similar (Figure 12.6). But these consistencies among scales are not a rule. In a subsequent study, Holmes and Sherry (2001) identified 7 species that exhibited inconsistent trends between local monitoring sites and regional patterns. A brief comparison of these studies within the Discussion section of the latter’s report helped to place the results in the appropriate context and potentially serves to make the reader more informed than she would have been otherwise.
Yet not all monitoring projects have similar precedents. Important questions to address in any Discussion section include:
- Did the project satisfy the objectives?
- In what ways did the work extend our knowledge about the species in the study area?
- Do the results support or challenge hypotheses and conceptual models stated in the introduction?
- What should the reader know about these results before using them to make decisions?
The answer to the last question is a key part of a responsible monitoring report. Explicitly informing your reader of the scope and limitations of the results provides a clear frame with which to view interpretations and thereby allows her to interpret the data in a manner that does not overstate the conclusions. Common limitations include scope of inference (both spatial and temporal), potential biases and unexpected problems encountered during the project.
Management Recommendations
This section should discuss how the results of the monitoring effort can or cannot be used to improve or otherwise influence resource management, including future monitoring activities. If the trends or differences in populations or habitats has reached or is approaching a threshold or ‘trigger point’ identified in the monitoring plan, corrective management measures should also be proposed (Noon et al. 1999, Moir and Block 2001). With regards to monitoring, it is in this section that recommendations for improvements in methods, changes in parameters monitored and/or termination of some aspects of monitoring should be proposed.
To decide what to include in a Management Recommendation section, you may have to re-visit some of your files from the design and implementation stage of your monitoring program and juxtapose that information with the monitoring results. Information dealing with the program’s goals and objectives and potentially the results of any pilot studies are particularly helpful. For instance, in a study carried out by McDonnell and Williams (2000), the general goal was to maintain a species-diverse grassland. Early in the research process, they collected a range of diversity values from a number of grassland sites and were able to derive a more specific management objective that defined species-diverse in a way that was pertinent to monitoring: to maintain diversity above 40 species within the grassland (Figure 12.7). From this objective, the researchers determined an appropriate management ‘trigger’ point: ‘if measured diversity falls below 50 species for two consecutive years, then the site should be burned within the next two years to restore the grassland structure and composition.’ (McDonnell and Williams 2000).
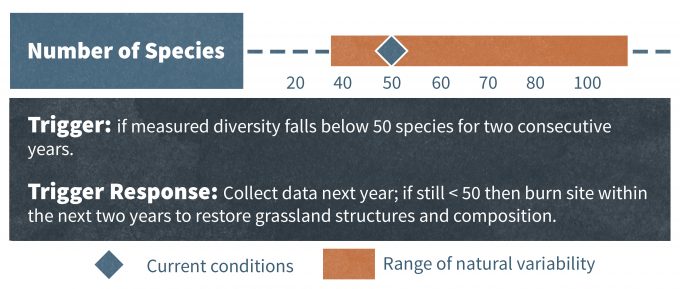
Given this context, if monitoring data reveal that the threshold level of 50 species is reached for two consecutive years, the Management Recommendations section should be used to encourage the development of a burning plan. All of the data that informed the original decisions should be cited to justify the proposal. Conversely, if the data indicate that the threshold has not been reached for two consecutive years, the Management Recommendations section should be used to discourage the development of a burning plan. Once again, all data that informed the original decisions should be cited. This example also underscores the importance of documenting all monitoring decisions and archiving any data or outside sources used in making them.
It is important to realize, however, that monitoring data, especially when it is collected on a long-term basis, may suggest that previously derived objectives and trigger points are unhelpful or unrealistic. Or they may suggest that monitoring itself is ineffective. For instance, if, using the same example, the researchers were to detect only 3 species in the first two years of sampling, there would likely be an inconsistency between the management plan and the ecosystem, the trigger point and the ecosystem, or the sampling techniques and the species being monitored (provided that nothing has drastically changed since the pilot studies were undertaken). In this scenario, the Management Recommendations section should be used to encourage further research such as a new set of pilot studies to recalibrate management and monitoring.
List of Preparers
In this section, the authors of the report should identify themselves and other biologists that had supervisory roles in the project by name, title or position and provide contact information. Usually a section of acknowledgements lists those who assisted with some aspect of the monitoring design, data collection, or data analysis.
References
References using standard author, date format must be provided for all statements in the text that are from other sources. Complete citations of all in text references must be included in the References section. Standard scientific formats should be used such as the one used in this book or in standard scientific writing references such as Huth (1994).
Appendices
Appendices are especially useful for reporting highly detailed information that may not be necessary for most readers, but which may be critical if other managers or scientists wish to replicate or further interpret the monitoring work. Copies of detailed field data collection protocols, data sheets, programming language used in analyses, detailed statistical summaries, field study site maps, and similar information that may be needed by others in the future can be included in appendices.
Summary
At times a summary of the findings may be included if it constitutes more than the reiteration of the Executive Summary. Whereas the Executive Summary precedes the text and provides a brief synopsis of the approach and results, a summary at the end of the document truly focuses on results and implications of the results. The summary should be informative with enough detail to allow the reader to walk away knowing the ‘bottom line’ from the monitoring program to date.
Summary
In summary, timely communication of monitoring results helps to ensure that the results will be used and that decisions based on the results can be evaluated by all stakeholders. A well structured report that allows others to understand how data were collected, what biases might exist, and how reliable inferences from the analyses might be are all key to effective use of the data.
References
Anderson, D.R., W.A. Link, D.H. Johnson, and K.P. Burnham. 2001. Suggestions for presenting the results of data analyses. Journal of Wildlife Management 65:373–378.
Crewe, T. and D. Badzinski. 2006. Ontario nocturnal owl survey. 2005. Final Report. Ontario Ministry of Natural Resources – Terrestrial Assessment Unit. Port Rowan, ON, Canada
Gurevitch, J., and L.V. Hedges. 1999. Statistical issues in ecological meta-analysis. Ecology 80: 1142-1149.
Hobbs, R., and D.A. Norton. 1996. Towards a conceptual framework for restoration ecology. Restoration Ecology 4, 93-110.
Holmes, R.T. and T.W. Sherry. 1988. Assessing population trends of New Hampshire Forest birds: local vs regional patterns. Auk 105:756-768.
Holmes, R.T., and T.W. Sherry. 2001. Thirty-year bird population trends in an unfragmented temperate deciduous forest: importance of habitat change. Auk 118:589–610.
Huth, E.J. 1994. Scientific Style and Format: The CBE manual for authors, editors and publishers, 6th ed. Cambridge University Press, Cambridge, UK.
McDonnell, M.J. and N.S.G. Williams. 2000. Directions in revegetation and regeneration in Victoria. Proceedings of a Forum held at Greening Australia, May 5 and 6, 1999,
Heidelberg, Victoria. Australian Research Centre for Urban Ecology. Occasional Publication No. 2
Moir, W.H. and W.M. Block. 2001. Adaptive management on public lands in the United States: commitment or rhetoric. Environ. Manage. 28:141–148
Muths, E., A.L. Gallant, E.H. Campbell Grant, W.A. Battaglin, D.E. Green, J.S. Staiger, S.C. Walls, M.S. Gunzburger, and R.F.Kearney. 2006. The Amphibian Research and Monitoring Initiative (ARMI): 5-Year Report: U.S. Geological Survey Scientific Investigations Report 2006–5224. 77 p.
Noon, B.R., T.A. Spies, and M.R. Raphael. 1999. Chapter 2: Conceptual basis for designing an effectiveness monitoring program. Pp. 21-48 in The Strategy and Design of the Effectiveness Monitoring Program for the Northwest Forest Plan. USDA Forest Service, Pacific Northwest Research Station, General Technical Report PNW-GTR-437.
Paradzick, C.E., T.D. McCarthey, R.F. Davidson, J.W. Rourke, M.W. Sumner, and A.B. Smith. 2001. Southwestern Willow Flycatcher 2000 survey and nest monitoring report. Arizona Game and Fish Department Technical Report 175. Phoenix, AZ.
Sauer, J.R., J.E. Hines, and J. Fallon. 2008. The North American Breeding Bird Survey, results and analysis 1966 – 2007. Version 5.15.2008. USGS Patuxent Wildlife Research Center, Laurel, MD
Smith, W.B., P.D. Miles, J.S. Vissage, and S.A. Pugh. 2004. Forest resources of the United States, 2002. USDA Forest Service General Technical Report NC-241.
Sogge, M.K., P. Dockens, S.O. Williams, B.E. Kus, and S.J. Sferra. 2003. Southwestern Willow Flycatcher Breeding Site and Territory Summary – 2002. U.S. Geological Survey. Southwest Biological Science Center, Colorado Plateau Field Station, Flagstaff, AZ
