7 Putting Monitoring to Work on the Ground
To accurately monitor changes in habitat and populations, long-term monitoring programs must utilize a repeatable sampling scheme. Making inferences about a population from a sample taken over time depends on the ability of a monitoring plan to guide personnel to re-sample and re-visit the same set of sample units (often points or plots) from one time period to the next in a standardized manner. Documentation of sample units throughout the study area and details for replicating sampling techniques are therefore critical. It is vitally important that there is proper documentation and storage of site locations and all notes pertinent to the sampling scheme for ensuring the long-term and repeatable success of monitoring plans. In this chapter we outline the steps that should be considered when establishing a monitoring scheme to ensure that it is consistently implemented over time.
Creating a Standardized Sampling Scheme
Selecting Sampling Units
Monitoring plans should clearly identify the methods necessary for biologists to translate the conceptual sampling design into field practices that can be implemented even under challenging conditions. Methods for randomly selecting the locations or individual organisms to be included in the sample should be described in detail. Criteria or rules for establishing boundaries of the sampling area (extent) to match the spatial scale specified in the planning and design section should be identified. Also the procedures to stratify the sampling effort or to exclude certain regions (e.g., areas that are not habitat for species of concern) within the sampling frame should be described if these steps are required by the design.
Size and Shape of Sampling Units
The size and shape of the sampling units have both logistical and statistical implications. Counting individual plants on plots delineated by a sampling frame was among the earliest approaches used by ecologists to estimate the frequency or density of plant populations. The technique may also be used for sedentary animals (e.g., mollusks, terrestrial salamanders). But researchers realized that count data obtained from plots are affected by the size and shape of the sampling unit. The optimum size and shape of a plot will differ according to the species, environmental conditions, and monitoring program objectives. Typically, the optimum plot configuration will be one that provides the greatest statistical precision (i.e., lowest standard error) for a given area sampled. Several investigators have developed approaches for determining the most appropriate plot size and shape for a particular population monitoring program (e.g., Hendricks 1956, Weigert 1962). Krebs (1989) provides a useful review of standardized plot methods.
There are, however, many important general concepts to consider when determining plot size and shape. Square plots, also known as “quadrats”, and circular plots have smaller boundary:interior ratios compared to rectangular shapes of equal area. Plots having an exaggerated length are sometimes referred to as “strip transects” or “belt transects”. In some sampling conditions, it may be difficult for the surveyor to determine whether organisms occurring near the boundary of a plot are “in” or “out” of the plot and counting errors can result. In these circumstances, compact plot shapes are preferred. Boundary:interior ratios also decrease with increasing plot size, thus larger plots seemingly offer another approach for reducing counting errors. However, the tedious nature of counting organisms on a large plot under difficult field conditions may also cause surveyors to make mistakes. Counting errors are not the only factor to consider when determining plot size and shape. In heterogeneous habitats, count or abundance data collected on long plots often have been found to have lower statistical variance among plots than data from compact plots of the same total area (Krebs 1989).
While the usual notion of a plot is an area delineated by a frame or flagging, other techniques may be used count organisms in a given area. Line transect and point transect sampling are specialized plot methods in which a search for the target organism is conducted along a narrow strip having a known area. See Chapter 8 for a more thorough discussion of application of transect sampling.
Population abundance also can be estimated by a variety of “plotless” monitoring methods that utilize measurements to describe the spacing of individuals in an area. These techniques are based on the assumption that number of individuals in a population can be determined by measuring the average distance among individuals in the population or between individuals and randomly selected points. Distance methods have been commonly used for vegetation surveys, and are easily adapted to inventories of rare plants or other sessile organisms. The approach may also be useful for population studies of more mobile animal species by obtaining abundance estimates of their nests, dens, roosting sites, or scat piles. Indeed, sometimes the optimal option when considering your plot size and shape is to have no plots at all! Collecting data for monitoring programs based on distance methods may have some practical advantages over plots or transects:
- Distance methods are not susceptible to counting errors that often occur near plot boundaries, thus may yield more accurate abundance estimates, and
- The time and effort to attain an adequate sample of distance measurements in an area often is less then that required to search for every target organism on a plot, thus increasing the efficiency of the monitoring program.
Field techniques vary depending upon the distance method selected for the monitoring program. All distance methods employ random selection procedures to choose points and compass bearings. Equipment requirements are minimal, usually only a compass, flagging, and a measuring device appropriate to the scale of the population and monitoring area are needed, but a detailed list of equipment used and descriptions of the protocol for using it must still be documented. Cottam and Curtis (1956) recommended a minimum of 20 measurements for estimating population density or abundance using Point-Centered Quarter Method. However, data collection plans may be relatively complicated and sample size calculations may need to be performed in the field. To keep this from translating into biased results, a rigorous training program is recommended for personnel conducting the monitoring program. Two useful references for designing inventories based on distance methods are Seber (1982) and Bonham (1989).
Selection of Sample Sites
A proper sampling design ensures that samples taken by a monitoring plan are representative of the population under study, and that any conclusions that are reached can be inferred and extrapolated to other areas and populations. The goal of the sampling design is to maximize efficiency by providing the best statistical estimates with the smallest amount of variance at the lowest cost (Krebs 1989). The sampling methods described below are three of the most popular methods for selecting sample sites when developing monitoring plans.
Simple Random Sampling
Simple random sampling occurs when a random subset of sampling units are selected as samples from a population in such a way that every unit has an equal chance of being chosen (Krebs 1989). For example, a set of randomly located points is placed throughout a study area. At each point, information is collected on some aspect of the species of interest, such as its reproductive success. The data collected from this randomly generated set of points can be considered representative of the population within the study area. However, users often need large sample sizes with this approach because sampling schemes tend to be spatially unbalanced, and there is no attempt to reduce the effect of variability on estimates (Fancy 2000). Consequently, simple random sampling is generally not appropriate for large-scale monitoring because it is cost-ineffective.
Nonetheless, randomization is essential in reducing bias and estimating the parameters of a population. In cases where it is important to have an adequate sample size from a limited area (e.g., watershed), samples can be distributed using a grid, cell design, or tessellation procedure (Stevens 1997). Most statistical analyses assume that sampling units were collected in a random fashion to reduce bias and maintain independence among samples (Krebs 1989). Although independence in ecological settings is difficult to ensure, randomization is an important aspect of any sampling design.
Systematic Sampling
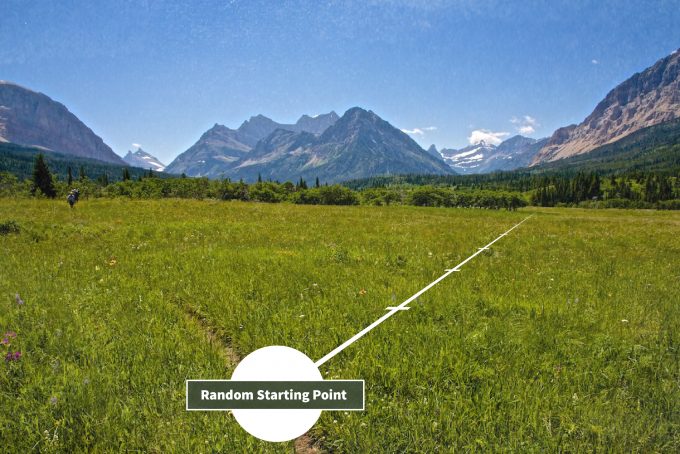
Systematic sampling allows for simple and uniform sampling across an area, and is often conducted using a line transect or belt transect procedure. For example, biologists often use point counts along pre-established transects to determine avian occupancy, density, and community composition across a habitat type. In this case, the starting point of the transect must be random, and point counts are placed at equal distances along the length of the transect (Figure 7.1).
Another common procedure is centric systematic area sampling. The study area is subdivided into equal squares and a sampling unit is taken from the center of each square (Krebs 1989). Systematic sampling provides an even coverage of the study area and is relatively cost-efficient. However, if there is an environmental gradient (e.g., a moisture gradient, roads, fences, etc.) that happens to align with the orientation of a transect or grid, then estimates from this technique can be biased. In general, systematic sampling remains a popular method in monitoring programs and studies due to its ease of implementation and efficiency and is useful for sampling ecological data, but users must be aware of the potential for bias in some settings.
Stratified Random Sampling
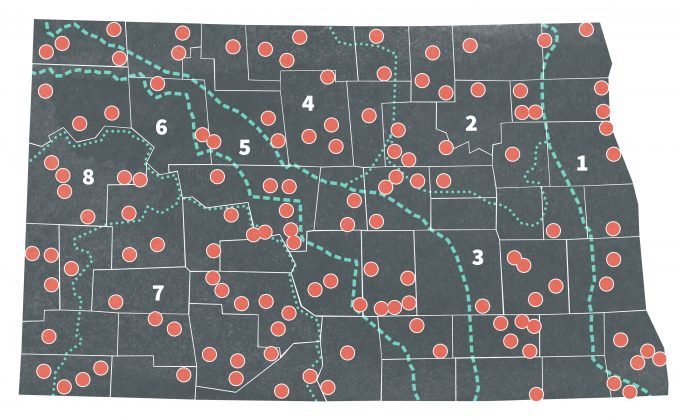
Stratified random sampling is a powerful technique for collecting reliable ecological data. This method consists of separating the population into subpopulations (strata) that do not overlap and are representative of an entire population (Krebs 1989). Strata are constructed based on criteria such as population density, habitat features, habitat quality, home range, or topography. The decision is often made using prior knowledge of the sampling situation in different areas. In some cases, however, what constitutes a stratum is not as clear and it may be necessary to use preliminary data as a statistical basis for strata delineation. Iachan (1985) discussed several approaches for deciding strata boundaries. Once the strata are delineated, each stratum is sampled separately, and then samples are chosen randomly within the strata. In 1967, Stewart and Kantrud (1972) estimated populations of breeding birds in North Dakota by dividing the state into eight strata based on biotic characteristics (Figure 7.2). These biotic regions were relatively homogenous and the number of sampling units in each stratum was proportional to the area of the biotic region. Sample units were selected randomly from each region. This design proved useful for other projects in the same area (Nelms et al. 1994). Stratified random sampling is favored in ecological studies for the following reasons (Cochran 1977):
- Separate estimates for means and confidence intervals can be derived for each subpopulation allowing for comparisons among strata.
- Cost per observation is typically reduced.
- If strata are chosen well, then confidence intervals may be narrowed appreciably. This allows for a greater precision and confidence in the parameter estimates for the whole population.
- Stratification may be administratively convenient if different organizational units are responsible for different parts of the sampling.
Although stratification represents an excellent sampling method for many monitoring plans, users should be aware of some of the inherent problems in creating strata. Recently, it has been suggested that designs based on the stratification of areas by “habitat types” derived from vegetation maps is not recommended (Fancy 2000). The reasoning is that habitat type boundaries, especially those based on vegetation, can change over time, and this will cause problems for future sampling since strata are permanent classifications. A stratum is an area for the purpose of distributing a sample, and any changes will bias the sampling design. These changes in strata boundaries restrict the ability of biologists and managers to include new information into the sampling framework. Consequently, it is considered more appropriate to delineate special areas of interest based on physical features (e.g., terrain, geology, soil, topography, or ecoregions). However, many monitoring plans continue to base strata selection on habitat types due to their influence on animal abundance and distribution.
Yet this does not mean that we can’t draw lessons from past and current monitoring designs. Monitoring agencies have different philosophies on sampling designs and framework. The National Park Service advocates sampling designs that emphasize areas of special interest, such as rare or declining habitat types (Fancy 2000). In many of their sampling designs, areas of special interest are sampled with higher frequencies using either stratification or a general approach of defining the units within the areas of interest and varying their selection probabilities (unequal probability approach). The USDA Forest Inventory and Analysis program’s base grid is randomly located, and users can use this grid as a means of initial sampling. The North American Amphibian Monitoring Program uses a stratified random block design (Weir et al. 2005). Overall, although many monitoring programs differ in the specifics of their sampling framework, most do emphasize critical considerations such as random sampling, a grid or system that allows for the initial sampling of all areas, and documenting limitations to their sampling designs.
Logistics
Careful attention to the personnel, equipment, and permissions that are required for fieldwork is crucial. Incomplete data sets, unreliable measurements, and budget overruns are the common consequences of poorly implemented monitoring programs. Failure to prepare adequate safety plans for fieldwork may even jeopardize the welfare of the survey crew. The following are several steps that can help increase the logistical viability of a monitoring program:
- Ensure consistent implementation of the monitoring plan among different units within an agency or among agencies conducting coordinated monitoring programs,
- Maintain the scientific credibility of the project by standardizing materials and methods used during data collection and analysis, thus facilitating independent review and replication of the monitoring program, and
- Support the development of annual budgets and operation plans that biologists or contractors will be required to submit for the monitoring program to their unit supervisor.
Safety plan
All federal and state and most industry organizations are required to prepare a safety plan. Gochfeld et al. (2006) provide an example of development of a Health and Safety Plan for marine work, but the ideas and approaches are easily adaptable to other circumstances. Some biological monitoring programs may involve special procedures for hazards affecting the safety and welfare of personnel that are not typically covered in standard safety plans for natural resources organizations. Examples include:
- Exposure to animal-borne diseases (e.g., rabies, hantavirus),
- Risk of injury from handling wild animals (e.g., capturing large carnivores),
- Risk of injury from special equipment or materials (e.g., electroshocker), and
- Hazardous activities (e.g., tree climbing, spelunking).
The U.S. National Center for Infectious Diseases provides factsheets for many diseases for which biological technicians may be at risk (NCID 2003). Similar resources are available for a number of other safety considerations and should be sought out when applicable.
Resources needed
Proper equipment and adequate supplies are essential to the operation of monitoring programs. Your monitoring plan should therefore include a list of equipment and supplies needed for implementation. The list should provide a detailed description (including manufacturer and model number to allow future replacements), minimum functional specifications, and suppliers for specialized instruments and materials used in data collection and analysis. Any specialized laboratory or storage facilities that are required should also be described. Biologists in charge of implementing monitoring programs should include a checklist of equipment and supplies required for fieldwork in the operation plans and to survey crews. Monitoring plan developers should also identify special software packages necessary for performing data analysis or laboratory procedures. Data collected by different units within an agency conducting the same program may not be comparable if equipment and supplies are widely inconsistent. Developers of monitoring plans can minimize this possibility by ensuring the standardization of monitoring program materials.
Permits
Obtaining the proper permits can be integral to the implementation or continuation of a monitoring program. Most states require surveyors to possess scientific collecting permits for studies involving the removal of rare plants or capturing native wildlife. Most studies of federally protected species such as migratory birds, endangered species, or CITES species also requires obtaining specific permits from the US Fish and Wildlife Service. Permits must likewise be acquired to use controlled substances or materials such as prohibited trap types (leg-hold traps in some states), and certain immobilizing agents (e.g, ketamine) and the syringes, dart guns or other equipment used to administer the agents. When using radio transmitters, approved frequencies must be used as based on Federal Communications Commission regulations. Anytime that monitoring is conducted on private lands, written permission allowing entry should be acquired from the landowner. Failure to receive permission from a landowner can lead to dropping a plot from the sampling scheme in addition to creating ill will toward personnel involved in field sampling. A replacement technique that ensures randomization of plot locations should be developed. For instance, if a list of random plot locations is developed and permission is refused for one of the selected plot locations then the next random plot in the list for that stratum should be selected. Nonetheless, if the reasons for refusing access rights is in some way related to the species of interest (a landowner does not want you to know that the species occurs on her/his land) then there is the potential for bias to creep into your sample.
Biological Study Ethics
If the monitoring is conducted in conjunction with a University then the monitoring plan will need to be approved by the Institutional Animal Care and Use Committee (IACUC). Having an IACUC approval process that is well documented is required by universities but also should be used in other organizations as well. Capture, marking, and observation techniques may cause the subject animals to experience pain, permanent injuries, and increased mortality rates. In fact, some animal inventories and monitoring studies depend on lethal traps for the collection of voucher specimens or population data. The justification for such studies must balance the benefits of knowledge to be acquired with the welfare of individual animals and populations subjected to study methods. Most wildlife, fisheries, and zoological professional societies have adopted guidelines to assist field biologists in minimizing the adverse impacts on individual animals and populations (e.g., American Society of Mammalogists 1998; AFS, ASIH, and AIFRE 1987; Gaunt et al. 1997). Supervisors and field personnel should receive animal use training (required by most university scientists) and also become familiar with the standards for use of animals in field studies. In most cases, investigators must have explored alternative options to animal capture and handling and be prepared to justify any proposals to capture, restrain, harm or kill and animal. The monitoring plan should ensure that methods used explicitly consider these standards.
Voucher Specimens
Techniques for the preparation of pressed plants for archiving in a herbarium, or preparation of animal skins and skulls for archiving in a museum are provided in Anderson (1965) and Carter et al. (2007). The methods used to handle, prepare, and store plant or animal specimens collected in the field should be described. If laboratory analyses are required for the monitoring plan, the facility where the analyses will be conducted should be identified along with appropriate shipping methods. The museum or university collection that will ultimately house voucher specimens should also be identified. A lack of such considerations can physically fragment data and present obstacles to future analyses of specimens (e.g. subsequent genetic analysis).
Schedule and Coordination Plan
The schedule for sampling on a daily, weekly, monthly and annual basis should be well documented to ensure consistency over the tenure of the monitoring plan. This schedule should include the major logistical activities, data collection and fieldwork periods, and timing of analytical procedures. This will facilitate the estimation of reporting deadlines. It is particularly crucial that the monitoring plan describe factors that influence the appropriate season for conducting field work. Examples of these factors include: climatic or weather conditions, latitude or elevation, and animal activity patterns such as those relating to reproduction. The plan should also describe procedures that require coordination with other agencies and monitoring programs. Examples include the establishment of permanent monitoring plot monuments, determining radio frequencies to be used for monitoring program communication, and contracting arrangements. The deadlines for acquiring the necessary permits should likewise be noted.
Qualifications for Personnel
One of the most important considerations in planning a monitoring program is to ensure that data collection and analytical procedures are performed by trained staff under the supervision of qualified biologists. Technological tools such as electronic data-loggers improve the efficiency of field technicians, but these tools cannot compensate for short-comings of inexperienced or poorly trained personnel. The monitoring plan should specify the minimum qualifications and responsibilities of biologists, crew leaders, and crew members involved in conducting the monitoring program to ensure reliable and efficient data collection. Establishing written qualifications for personnel is particularly important for multi-year monitoring studies during which there is likely to be a significant amount of turnover among the monitoring program participants.
Sampling Unit Marking and Monuments
Careful consideration should be given to selecting methods to mark sampling units and to install monuments at permanent plots. There are numerous marking systems available and the final decision should be based on an assessment of the vulnerability of sampling units to vandalism and natural disturbance and the particular strengths and weaknesses of each system.
Plastic flagging and pin flags are inexpensive and suitable for temporary marking. However, plastic deteriorates in sunlight and may attract browsing by deer or cattle. Many large landowners reserve certain flagging colors for specific types of management activities; therefore flagging guidelines should be reviewed prior to marking sampling sites. Polyvinylchloride (PVC) pipe and wood stakes are vulnerable to vandalism and can be lost during wildfire or floods. These materials should be used as short-term (<1 year) markers only and should not be used at all near locations frequently visited by humans or livestock.
Steel reinforcing rod (rebar) and T-posts are more durable materials for monumenting sampling units. They can be driven deeply into the ground to prevent all but the most determined vandals from removing them. Steel rebar and T-posts can also be relocated with a metal detector if they are buried during a flood or land management activities. If vandalism is not likely at the site, high-visibility paint or flagging can be used to make posts more detectable by field crews. Rebar can be fitted with a commercially available plastic cap or bent into a loop if the protruding end presents a hazard to cattle or humans. Electric or manually powered rock or masonry drills (available at rock climbing equipment retailers or masonry suppliers) can be used to insert a bolted marker into rock substrate when bedrock or boulders prevent the use of posts or stakes.
Trees can be marked with a paint ring to indicate a sampling point or as an aid for relocating an individual sample tree. Periodic re-painting will be required at long-term monitoring sites. As with plastic flagging, tree marking guidelines vary by landowner and will be inappropriate on some sites. Trees can be provided a unique identifier by fastening two numbered tags (available at forestry supply companies) to the bole; one at breast height (1.5 m, 4.5 ft) and another at the base of the tree. Tags should be fastened with an aluminum nail to prevent rusting and loss of the tag. Two tags should be used in case the tree is harvested, then the basal tag will remain. Nails should be angled slightly downward and have a minimum of 3” of the shaft protruding from the tree to prevent diameter growth from damaging the tag. At permanent tree inventory plots, tree tags are customarily nailed to the aspect of the bole facing the plot center.
Whatever types of visual markers are used in the field, sampling unit locations should be recorded on a topographic map and with distances and compass bearings to permanent landmarks. Locations are typically determined using global positioning systems (GPS), geographic information systems (GIS), and other computer-based systems for data analysis, storage, and retrieval. GPS is a valuable tool for conducting field surveys and relocating sample sites. Using GPS, users can geo-reference sample site locations using latitude, longitude, or Universial Transverse Mercator (UTM) coordinates. Along with GPS locations, careful notes taken on the location and description of sample sites can aid in relocation at future times. These notes should be reported in a consistent manner and held in office records. The details that must be recorded to ensure that sampling techniques can be replicated include equipment used, permits obtained, schedule for sampling, etc. Data management and documentation remains a critical component of project supervision.
But it should not be assumed that the crew will always be able to relocate the sampling units using a GPS. Rugged terrain or dense canopy cover may prevent reception of the satellite signal, or the GPS may fail to operate once in the field. At long-term monitoring sites, landmark references should be recorded for every sampling unit. For short-term surveys and sites where sampling units are uniformly positioned along a transect or grid, landmark references only need to be recorded to the first unit. The crew can then rely on the site map and standardized spacing distances to navigate among sampling units at the site. Even this can take time though especially if sufficient time has elapsed between samples to allow vegetation to obscure permanent markers. Maps, UTM coordinates, and landmark references for sampling unit locations should be included as an appendix in the project report.
A number of other practices are helpful in maintaining consistent sampling units. For instance, the dimensions of plots, transects, or other sampling units should be described. Efficient techniques for positioning and measuring sampling units under field conditions should be identified. Providing a diagram or map to indicate the spacing and configuration of sampling units is also useful. For long-term monitoring projects, recommendations for marking and establishing monuments that are resistant to natural disturbances and vandalism should be provided. Elzinga et al. (2001) provided an excellent review of such techniques.
Documenting Field Monitoring Plans
A comprehensive description of field methods for sampling the target species or habitat element is particularly important. The monitoring plan should address all of the following issues relevant to the population or habitat element being sampled:
- Observational or capture techniques: include a description of the equipment used and the rationale for the equipment chosen, pointing out the advantages and disadvantages of the chosen method with regards to precision and repeatability of the technique. Subtle details of techniques such as guidelines for trap placement, binoculars used, mensuration equipment used, and weather conditions may be very useful in reducing inter-annual variability in estimates.
- Timing of sampling in terms of days, months, and years: explain how the temporal framework for sampling interfaces with periods of activity, movement, growth, or reproduction for the species of interest or how it is associated with the function of the habitat element of interest. Point out the advantages and disadvantages of the proposed timing with regards to the precision and repeatability of estimating the index of interest.
- Duration of sampling: include a written explanation of why and how the sampling effort is adequate to develop a precise estimate over a period of time meaningful to the population of concern. Consider providing data from the literature or a pilot study that makes it clear that the additional sampling effort beyond what is proposed is unlikely to add additional information (e.g., species detection curves).
- Frequency of sampling: Document the periodicity of sampling that reflects the likelihood that the index to the population or habitat element is as precise as possible and that bias due to sampling at times when individuals are more or less detectible has been minimized. The advantages and disadvantages of the proposed sampling frequency should be pointed out relative to achieving precision and repeatability within the context of the annual and inter-generational changes in the populations. For instance, highly dynamic populations may need more frequent sampling than populations that are relatively stable and change slowly over time.
- Data collection: Document exactly how data are to be collected, including reference to the significant digits with which data are recorded. Clearly state the taxonomic level expected, the degree of precision of the measurement, and the specific techniques used to acquire the datum.
- Plant or animal marking techniques must be considered carefully. Any marking technique that introduces bias into estimates of survival or reproduction can lead to highly unreliable monitoring information, thus they must be considered carefully. References to support methods used to sample and mark plants and animals should be provided. In the case of radio transmitters, make it clear that transmitter mass should not exceed specific guidelines provided in the literature. Bands, ear tags, passive integrated transponder (PIT) tags, and other markers must not unduly modify the organism’s mobility, survival, reproductive potential, or other functions that may result in an unreliable estimates of demographic parameters.
- Use of equipment and materials should be precisely described. It is better to provide too much detail than too little regarding how equipment should be used, maintained, and stored.
The monitoring plan should receive peer review and be tested thoroughly before being implemented.
Quality Control and Quality Assurance
Data collection tasks that are vulnerable to observer error should include both a training program and compliance monitoring to ensure that the data are collected as accurately and precisely as possible. Data verification tests are highly recommended. For example, re-surveys could be conducted by an independent examiner on a subset of sampling units to measure error rates. Monitoring plans should also establish criteria for acceptable levels of observer error, and describe remedial measures when data accuracy is not acceptable.
Critical Areas for Standardization
Projects designed to identify population distribution or abundance patterns across space and time must control for measurement biases and observer variability that could confound interpretation of the data analysis. This process is referred to as standardization and consists of those aspects of the data collection monitoring plan intended to ensure that observations and measurements are conducted using identical methods and under the same conditions across all sampling units included in the monitoring program. The primary objective of standardization is to make certain that the field techniques employed do not cause detection probabilities to vary among sampling units. Standardization is particularly critical for monitoring plans that utilize relative abundance indices, that is, counts of individuals per unit of time or effort. If the techniques do influence detection probabilities, then it cannot be assumed that counts or other field measurements accurately represent variation in the population parameter of interest (e.g., population size or population density). Formal parameter estimation procedures (e.g., sighting-probability models) utilize different pilot studies to permit analysis of detection probabilities according to age class, habitat, monitoring program personnel, and other factors. These different detection probabilities are then incorporated into the calculation of the estimator, instead of assuming that detection probabilities are fixed. Monitoring plans should consider the following factors when identifying critical areas of standardization.
Season and Elevation
Most plants occurring in temperate climates demonstrate a predictable pattern of growth, reproduction, and senescence in response to changing environmental conditions throughout the year along moisture gradients and elevational gradients. Animals also often exhibit seasonal periodicity in habitat use and behavior patterns. These biological responses to the environment clearly influence detection probabilities in association with location, but may also strongly alter detection probabilities across different months of the year. Birds are an excellent example. Territorial male passerines sing regularly when establishing a territory and attracting a mate. During incubation and after hatching however, singing drops off and indeed adults feeding young are not only quiet but cryptic. And when fledglings emerge from the nest then they often call but do not sing. Hence sampling during the beginning, middle and end of the nesting cycle can produce quite different estimates of abundance. Therefore, a monitoring plan should specify the appropriate season for sampling. If the monitoring plan is designed to be applied across a wide geographic range, it must indicate how sampling periods are to vary by region, latitude, or elevation.
Diurnal Variability
Activity patterns of wildlife and fish species often change in a relatively predictable manner throughout the 24-hour day. Using our example of bird sampling, males sing on territories most aggressively early in the morning and the activity subsides during mid day. On the other hand, some observational and capture techniques are insensitive to diurnal patterns of behavior because they rely on a trap or other device that is always ready to capture an animal or record a detection (e.g. screw traps for migratory fish, track plates for medium-sized carnivores). However many field techniques are designed toward certain target behaviors that increase the detectability of some individuals in a population or their vulnerability to capture at particular periods throughout the day. Biologists developing monitoring plans should assess the significance of diurnal activity patterns on detection probabilities and, if necessary, specify the appropriate time of day to sample the target population.
Clothing observers wear while monitoring
Simply considering the clothing worn during field sampling can have an effect on the observations of some species. Standardizing field appearance and behaviors can be quite important. For instance, when sampling breeding birds, wearing red or orange can cause hummingbirds to be attracted to the observer, thereby biasing the estimates of abundance of this species. Wearing clothing that blends into the background to the degree possible may minimize such biases.
Budgets
After a monitoring program is designed, a budget request must be made to ensure that the plan can be implemented as designed. Typically this becomes an iterative process because the budget request for monitoring to achieve a certain statistical power to detect a given trend over time may exceed the capacity of the funding organization. The inability to procure adequate funding for a monitoring program often results in concessions being made to the effect size that can be detected by reducing the sample size, or changing the confidence level with which a trend can be detected. Program MONITOR (Gibbs and Ramirez de Arellano 2007) provided a tool for assessing the costs associated with each sampling plot while simultaneously estimating the power associated with detecting a trend given a certain sample size. Hence the implications of modifying the design on the funding levels needed to support the design can be explored prior to initiating the monitoring program. If funds are so limiting as to not provide an acceptable level of power, then changes can be made in the response variables, sampling techniques, or other design factors that may allow a revised form of the monitoring plan to be implemented. In a worst case scenario, if the funding is simply not sufficient to provide an acceptable level of power to detect a trend, the monitoring program will likely have to be abandoned.
Budget planning is often broken into two components: fixed costs and variable costs. Fixed costs are costs which are not affected by the extent of the monitoring effort, and are typically those associated with equipment that is needed during the first year of the program, such as vehicles, capture or recording equipment. These items are necessary to purchase to begin the program, but can be used in subsequent years. It is important to estimate the life of this equipment so that there are funds for replacements as certain pieces cease to work adequately.
Variable costs are those that vary with the sampling intensity. Cumulative personnel expenses (salaries, benefits, and indirect costs) are often the largest portion of the budget and these vary depending on the number of sampling locations measured. In addition it is important to calculate increased personnel costs over time due to raises and increased costs associated with benefits. Supplies are expendable items such as bait and flagging that must be replaced each year, so they also represent variable costs.
The greatest challenge to building and requesting a budget for a monitoring program is ensuring that funding will be available at the necessary time period (usually each year) over time. Given annual fluctuations in agency budgets, simply having the money allocated on a consistent basis becomes problematic. Most often the program leader will have to make an effective argument regarding the importance of the information during each budget cycle. This should become easier over time as results are summarized and the value of the data increase. A related difficult decision for a program leader or an agency to make however is when to stop a monitoring program. The tendency is to try to keep it operational for as long as possible, but one must begin to ask what the return is on the investment. Monitoring programs that have been ongoing for years or decades can become institutionalized and there can be considerable resistance to ending them. Yet this could come at the cost of taking funding from other more critical monitoring programs. It is therefore important to design monitoring programs with trigger points are included in the monitoring plan (e.g., the population reaches a certain level of growth for a certain number of years) that clearly indicate the program’s termination point. This will help facilitate the timely cessation of monitoring.
Summary
The logistics associated with implementing a monitoring plan may seem overwhelming but are integral to ensuring that the plan is implemented correctly and that the data will be useful. Adhering to random sampling monitoring plans, monumenting points, and using consistent plot designs from one time period to the next is critical. If stratification can reduce variance in estimates, then it should be used, but basing strata on vegetative characteristics should normally be avoided since vegetation structure and composition will likely change over time. Geographic or geologic features may be more useful and consistent strata.
Ensuring that personnel are trained, and that the necessary state, federal and institutional permits have been acquired take considerable time. How and when these activities will be conducted should be included in planning documents. Where sampling occurs on private land, time must be allotted to determine landownership and contact land owners for access rights.
Monitoring plans should be developed and followed to ensure ethical treatment of animals, and standardization in timing, techniques and locations over time. Personnel should be trained to follow these monitoring plans as closely as possible in order to reduce sampling error.
Finally, once the plan is designed and the costs associated with the logistics of the plan are estimated, a budget must be developed. Where budget constraints arise, then choices must be made regarding tradeoffs between data quality, response variables used, and statistical power to detect a trend. If these tradeoff analyses are not conducted before embarking on a monitoring program, then the end result could be data that are simply insufficient to detect a trend in the desired response variable, and funding and monitoring will likely end. On the other hand, collecting data consistently and estimating adequate power to detect trends has the potential to create a positive feedback loop in which acquiring funding for continuation of the program becomes easier over time as the value of the data increases. Including a trigger point in the monitoring plan that dictates when the monitoring should end is important, however, to avoid the monitoring program from becoming institutionalized and funded for its own sake.
References
American Fisheries Society (AFS), American Society of Ichthyologists and Herpetologists (ASIH), and American Institute of Fishery Research Biologists (AIFRE). 1987. Guidelines for the use of fishes in field research. Approved Sept 1987, Winston-Salem, NC. Published Mar-Apr 1988, Fisheries 13(2):16-23.
American Society of Mammalogists, Animal Care and Use Committee. 1998. Guidelines for the capture, handling, and care of mammals as approved by the American Society of Mammalogists. Journal of Mammalogy 79:1416-1431.
Anderson, R.M. 1965. Methods of collecting and preserving vertebrate animals. National Museum of Canada Bulletin 69:1-199.
Bonham, C.D. 1989. Measurements for terrestrial vegetation. John Wiley and Sons, New York. 338pp.
Carter, R., C.T. Bryson, and S.J. Darbyshire. 2007. Preparation and use of voucher specimens for documenting research in weed science. Weed Technology 21:1101–1108.
Cochran, W. G. 1977. Sampling Techniques. Ed. 3, New York, Wiley. 428pp.
Cottam, G. and J.T. Curtis. 1956. The use of distance measures in phytosociological sampling. Ecology 37: 451-460.
Elzinga, C.L., D.W. Salzer, J.W. Willoughby, and J.P. Gibbs. 2001. Monitoring plant and animal populations. Malden, MA: Blackwell Publishing. 368pp.
Fancy, S.G. 2000. Guidance for the design of sampling schemes for inventory and monitoring of biological resources in National Parks. Unpublished report dated March 24, 2000 from the National Park Service Inventory and Monitoring Program. 19pp.
Gaunt, A.S., L.W. Oring, K.P. Able, D.W. Anderson, L.F. Baptista, J.C. Barlow, and J.C. Wingfield. 1997. Guidelines to the use of wild birds in research. A.S. Gaunt and L.W. Orning, eds. Ornithological Council, Washington, D.C.
Gibbs, J.P., and P. Ramirez de Arellano. 2007. Program MONITOR: Estimating the Statistical Power of Ecological Monitoring Programs. Version 10.0. ESF State University of New York, Syracuse.
Gochfeld, M., C.D. Volz, J. Burger, S. Jewett, C.W. Powers, and B. Friedlander. 2006. Developing a health and safety plan for hazardous field work in remote areas, Journal of Occupational and Environmental Hygiene 3(12):671-683.
Hendricks, W.A. 1956. The mathematical theory of sampling. Scarecrow Press, New Brunswick, NJ. 364pp.
Iachan, R. 1985. Plane sampling. Statistics and Probability Letters 50:151–159.
Krebs, C.J. 1989. Ecological methodology. Harper Collins, New York. 654pp.
National Center for Infectious Diseases (NCID). 2003. NCID publications available online. U.S. Centers for Disease Control and Prevention, National Center for Infectious Diseases publications. http://www.cdc.gov/ncidod/publicat.htm
Nelms, C.O., W.J. Bleier, D.L. Otis, and G.M. Linz. 1994. Population estimates of breeding blackbirds in North Dakota, 1967, 1981–1982 and 1990. Am. Midl. Nat. 132:256–263.
Seber, G.A.F. 1982. The estimation of animal abundance and related parameters, 2nd edition. Edward Arnold Publ., London. 676pp.
Stevens, D.L., Jr. 1997. Variable density grid-based sampling designs for continuous spatial populations. Environmetrics 8:167–195.
Stewart, R. E., and H. A. Kantrud. 1972. Vegetation of prairie potholes, North Dakota, in relation to quality of water and other environmental factors. U.S. Geol. Surv. Prof. Pap. 585-D. 36pp.
Weir, L.A., J.A. Royle, P. Nanjappa, and R.E. Jung. 2005. Modeling anuran detection and site occupancy on North American Amphibian Monitoring Program (NAAMP) routes in Maryland. Journal of Herpetology 39:627–639.
Wiegert, R.G. 1962. The selection of optimum quadrat size for sampling the standing crop of grasses and forbs. Ecology 43: 125-129.
