10 Database Management
For many monitoring projects, data management is often considered a nuisance and of less importance than sampling design, objective setting, and data collection and analysis. Yet a proper database management system is a critical component of any monitoring plan and should be considered early in the planning process. In many ways, such a system serves as the ship’s log of a monitoring mission and should detail every step of data collection, storage, and dissemination. Sound data management is so vital because a monitoring project adapts and changes over time and as such, so might the data. Furthermore, because most monitoring projects are conducted over many years and include the inevitable changes in staff, data collection and methodologies, land ownership and accessibility, and shifting technologies, improper data management can fail to document these changes and undermine the entire monitoring initiative. In addition, because online data dissemination and digital archives are becoming increasingly popular (if not necessary), data management serves as a much needed blueprint of instructions for future users of the data who might not have been involved in any aspect of the original monitoring plan.
The Basics of Database Management
The data generated from monitoring programs are often complex and the protocols used to generate these data can change and adapt over time. Consequently, the system used to describe these data, and the methods used to collect them, must be comprehensive, detailed and flexible to changes. In a perfect world, monitoring data are collected and often entered into a database (as opposed to being stored in a filing cabinet). A comprehensive database should include six basic descriptors of the data that detail how they were collected, measured, estimated and managed. Ultimately, these basic descriptors ensure the long-term success of a monitoring effort because they describe the details of data collection and storage.
The six essential descriptors are: what (the type of organism), how many (units of observation for individual organisms or colonies, presence/absence, detection/non-detection, relative abundance, distance measurements), where (the geographic location at which the organism was recorded and what coordinate system was referenced), when (the date and time of the recording event), how (what sort of record is represented and other details of data-collection protocols; e.g., 5-minute point counts, mist-netting, clover trap, etc.), and who (the person responsible for collecting the data). Each of these components represents an important aspect of data collection that facilitates future use. For example, information on how a recording event was made allows someone separate from the data collection to properly account for variation in effort and detection probability, deal with data from multiple protocols, and determine whether the data are from multiple species or single-taxon records.
The General Structure of a Monitoring Database
Unfortunately, there is no “one size fits all” solution to the basic structure of a monitoring database. Monitoring programs are diverse and so are the data they collect. There are, however, several basic and standardized templates that can be used when creating a monitoring database (Huettmann 2005, Jan 2006). As an example, the Darwin Core is a simple data standard that is commonly used for occurrence data (specimens, observations, etc. of living organisms) (Bisby 2000). The Darwin Core standard specifies several database components including record-level elements (e.g., record identifier), taxonomic elements (e.g., scientific name), locality elements (e.g., place name), and biological elements (e.g., life stage). Jan (2006) provided another excellent example of a functional structure for an observational database. Using the terminology of Jan (2006), biological sampling information relates to field site visits, and each of these visits is considered a Gathering. Each Gathering event is to be described by the occurrence and/or abundance of a species and additional site information including site name, the period of time, the name of the collector, the method of collection, and geography. The geography field should indicate using the country codes using the International Standardization Organization (ISO) standards (www.iso.org), and it should have an attribute detailing whether this information is currently valid because political boundaries and names change over time (e.g., new countries form, their names can change) (Jan 2006). Geospatial data are stored under the heading of GatheringSite and includes coordinate data (e.g., latitude and longitude, altitude), gazetteer data (e.g., political or administrative units), and geo-ecological classifications (e.g., geomorphological types). It is important that this field allows for high-resolution geo-referencing for subsequent integration with a GIS (e.g., using 5 significant digits for latitude and longitude coordinates). The Unit field includes organisms observed in the field, herbarium specimens, field data, taxonomic identifications, or descriptive data. An Identifications field details the species’ common name, species’ scientific name, and a species code (using the Integrated Taxonomic Information System [ITIS; www.itis.gov]) to a Unit (specimen, observation, etc.). Identifications can then be connected to a taxon database using a TaxIdRef field. The organization of any monitoring database should have these necessary information fields (although field names may vary) and will likely require the use of a digital database for storage and manipulation.
Digital Databases
Digital databases are now considered an invaluable and commonly used tool for storing data generated from monitoring programs. Even in remote field sites, researchers are using mobile GPS (Global Positioning System) and PDA (Personal Digital Assistant) units to record georeferenced census tracks and species observations (Travaini et al. 2007) (Fig. 10.1). Using any laptop computer, these data can then be quickly integrated into database management software such as CyberTracker (cybertracker.org), Microsoft Excel (office.microsoft.com/en-us/excel), or Microsoft Access (office.microsoft.com/en-us/access). By using a digital database, researchers gain the ability to georeference census points for later integration into a GIS, such as ArcGIS (esri.com/software/arcgis/), allowing for additional analytical options such as predictive species distribution modeling (Fig. 10.1). Travaini et al. (2007) provided an excellent review and application of a field-based database framework for using digitally-stored data to subsequently map animal distributions in remote regions. A key advantage to recording data into a digital database during the collection event itself is the ability to develop and maintain multiple databases. Digital databases also increase the capacity to integrate data into online data management programs and thereby to access data at later dates.
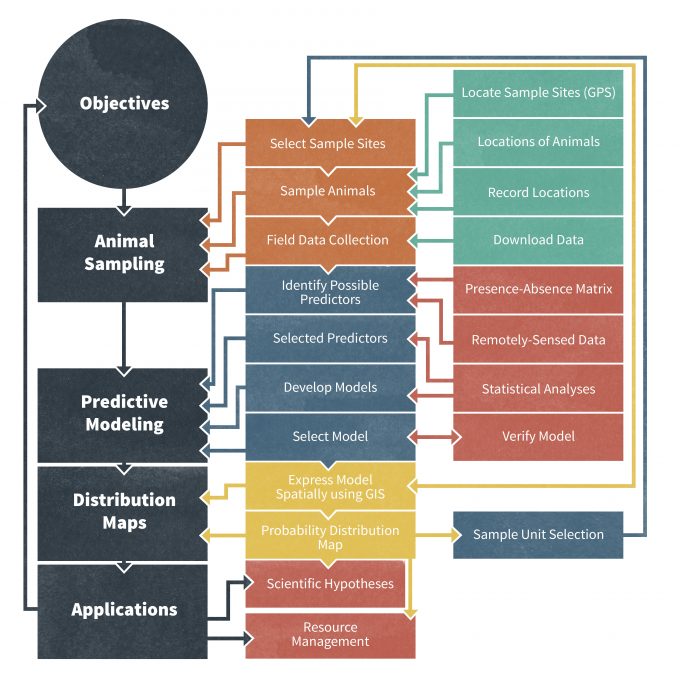
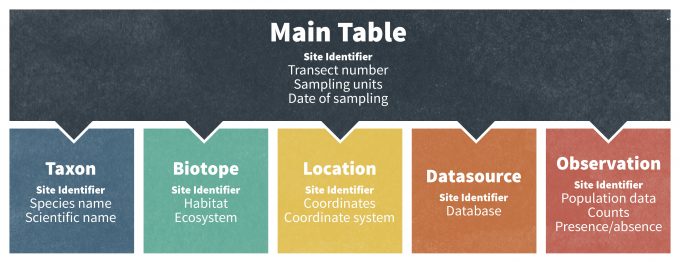
In addition to this, database managers often use online and digital databases because they can be readily linked to other databases for greater functionality. Connecting multiple databases results in a relational databases management system (RDMS) (Fig. 10.2), which allows for queries to be made among multiple databases. In light of these developments, the structure and framework of many large monitoring databases are increasingly sophisticated and data on demographic rates, abundance, and species occurrences can be linked with other geographic information stored in ancillary databases. For example, a standard relational database can consist of sub-tables of data that are connected through a common record ID number (Fig. 10.2). A Main table normally contains information on the sampling units, the units used for data presentation, the years of the study, and notes on sampling design. Other frequently used tables include a Taxon table (information about the organism sampled in each data set; see ITIS (see www.itis.org for globally accepted species names), a Biotope table (habitat of the organism), a Location table (geographical details of the monitoring site), a Datasource table (reference to the original source of the data), and the actual Data table (original population data). In this case, a relational database and a common record identifier enable the user to perform multiple queries based on species, taxonomic group, habitats, areas, latitudes or countries. This is particularly powerful because a user can query a unique identifier that refers to a specific study site and then extract data on that site from multiple data tables. In practice, developing, maintaining and retrieving data from a RMDS often requires knowledge of SQL (Structured Query Language; http://en.wikipedia.org/wiki/SQL), a widely used database filter language that is specifically designed for management, query and use of RMDS. SQL is a standardized language with a huge user community that is recognized both by the American National Standards Institute (ANSI) and International Organization for Standardization (ISO; [iso.org/iso/home.htm]). It is implemented in many popular relational database management systems including Informix (ibm.com/software/data/informix), Oracle (oracle.com/index.html), SQL Server (microsoft.com/sql/default.mspx (inactive link as of 05/18/2021)), MySQL (mysql.com) and PostreSQL (postgresql.org).
Data Forms
All data collectors should use a standard data form that is approved by stakeholders in the monitoring program (Table 10.1). Copies of these data forms should be included as an appendix to the planning document. The appendix should also provide a data format sheet that identifies the data type, unit of measurement, and the valid range of values for each field of the data collection form. The data format sheet should also identify all codes and abbreviations that may be used in the form.
Time Begin__________________Time End _________
| Date __________ | Sample point________ | Landscape__________________ | Observer __________ | |||
| Weather ____________________ | ||||||
| Obs. Num. | Species | Number | Distance(m) | Repeat (Y/N) | Behavior | Patch type |
| 1 | ||||||
| 2 | ||||||
| 3 | ||||||
| 4 | ||||||
| 5 | ||||||
| 6 | ||||||
| 7 | ||||||
| 8 | ||||||
| 9 | ||||||
| 10 | ||||||
| 11 | ||||||
| 12 | ||||||
| 13 | ||||||
| 14 | ||||||
| 15 | ||||||
| 16 | ||||||
| 17 | ||||||
| Species = use 4-letter code Number = number of individuals Repeat = enter “Y” only for repeat observations of the same bird Behavior = F(eeding), R(esting), O (flyover), Patch type = P(lowed), G(rass), W(Grassed waterway), S(hrubby), T(reed) |
||||||
Data Storage
For many monitoring programs, hardcopy data are still collected despite the increasing availability of digital formats. In general, there are three primary obstacles to the shift of hard copies to digital formats. First, significant amounts of (historical) hardcopy data remain to be digitized (e.g., in archives, libraries, and filing cabinets). Second, although technological advances are making the collecting of digital data in the field more feasible (Travaini et al. 2007), many field data are still collected in field notebooks when field conditions are difficult and the field-site is remote. Third, many digital datasets are still getting printed as hardcopy for cultural and logistical reasons.
In many cases, even when data are compiled digitally, hardcopies are collected as an important back-up for many monitoring programs, or such data are retained and maintained as critical sources of information for legacy programs that have been running for decades. Yet despite this, and although other examples of obstacles associated with the transition to digital documentation doubtless exist, there are many reasons why monitoring data should be collected and stored in a digital format (with necessary back-up systems). The advantages of using digital field data collection methods include immediate data availability (e.g. real-time online data entry), lack of labor-intense data key-in sessions afterwards, and automated metadata and processing. Given these benefits, a more universal use of digital data collection would be ideal, but many universities, governments, NGOs and agencies are hesitant to embrace current technologies. Reasons for reluctance to go entirely digital are varied but typically include a lack of computational training and insufficient infrastructure for using and storing digital data.
Metadata
Databases resulting from biological inventories and monitoring studies can benefit other scientific research efforts and facilitate species conservation programs for many decades. The usefulness of a database for these purposes, however, is determined not only by the rigor of the methods used to conduct the monitoring program, but also by the ability of future investigators to decipher the variable codes, measurement units, and other details affecting their understanding of the database. When a potential user of a database is interested in deciphering the details of that database, they often refer to the metadata. Metadata are “data about data” and are an essential aspect of any database because they serve as a guide provided by the developer of the database. Metadata facilitate information sharing among current users and are crucial for maintaining the value of the data for future investigations. Indeed, if monitoring data are placed online or meant to be shared among participatory stakeholders, then there needs to be a clear description documenting every relevant step of data curation and processing. There are few things more frustrating for potential data users than receiving a database or map with little or no information on what the variables represent or how the data were collected. The standardized metadata that accompany monitoring databases should be highly valued as one of the principal means for improving transferability of biological monitoring information among different programs, management units and future data users.
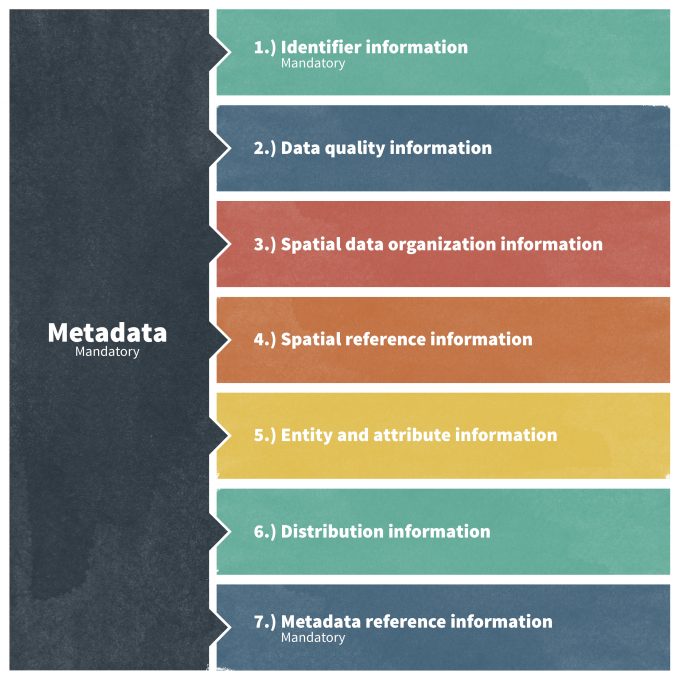
With respect to metadata, the Federal government has developed several systems, standards, and templates for database documentation that can be applied to any monitoring database. Since 1995, all Federal agencies have adopted a content standard for geospatial data called Content Standard for Digital Geospatial Metadata (CSDGM; Tsou 2002)). This standard was developed by the Federal Geographic Data Committee (FGDC), which is also responsible for reviewing and updating the standard as needed. The currently approved FGDC standard is CSDGM Version 2 – FGDC-STD-001-1998 and was developed to be applicable to all geospatial databases. The standard includes seven major elements. Certain GIS packages include software tools that automate a number of these metadata documentation tasks, however, the originator of the database must manually complete most fields. The process of describing data sources, accuracy tests, geo-processing methods, and organizational information can be tedious and add many hours to the preparation of a data set. This initial cost of the labor and time, however, will ensure that the data can be used for many years into the future, possibly for research or conservation purposes not anticipated by the originator of the data set.
Although prescient, the generic nature of the CSDGM, does not provide for standardization of many attributes commonly shared among biological databases. To extend the effectiveness of the CSDGM framework to biological sampling, the FGDC’s Biological Data Working Group has standardized the use of terms and definitions in metadata prepared for biological databases with the development of the Biological Metadata Profile (FGDC 1999). The Biological Metadata Profile falls under the broader National Biological Information Structure (NBII) (>www.nbii.gov) profile and applies to topics such as taxonomic classification, voucher specimens, environmental attributes, and others not considered in the CSDGM. The Biological Metadata Profile is also applicable to non-geospatial data sets. Considering that most monitoring programs collect biological information, database managers should consult the Biological Metadata Profile before and after data collection.
The FGDC standard and its profiles are widely embraced by the U.S. Federal Government and international initiatives (e.g., International Polar Year (IPY)). Nonetheless, several other metadata standards exist, including: a) Directory Interchange Format (DIF) for a short telephone entry description, which is still widely used by BAS (British Antarctica Service), b) EML (Ecological Metadata Language) for a rather detailed description of relational databases, which is used by Long Term Ecological Research sites in the U.S., and c) SML (Sensor Metadata Language) for a very powerful and progressive description of high-performance Sensors Networks. There is also a wide array of metadata standards that have local relevance only, and are not compatible with global metadata standards. There is a current movement, however, towards the development and implementation of a more global standardization. Variation among studies in metadata standards impedes global data availability, and deviating from the FGDC NBII standard often results in large information loss. The idea that more local, simpler metadata concepts can simply be mapped, and then cross-walked through automatic parsing software to other standards such as FGDC NBII in order to satisfy delivery needs, can prove fatal to data quality because once an information field is missing, its content can likely never again be filled in a way that maintains the rigor of the database as a whole.
Over 50 collective years of database experience in monitoring populations have led to one major conclusion: the lack of metadata make databases entirely unusable. Thus, metadata and data management needs to occupy a major section of the project budget and should be considered early in the planning process.
Consider a Database Manager
As you may be able to tell from the preceding sections, database management is not a simple task. It requires an understanding of complicated metadata standards and, in the case of many digital databases, a skill set pertaining to computer programming (e.g., SQL language). Unfortunately, perhaps because of the considerable training and effort that are necessary, database management does not receive sufficient attention in terms of time and budgetary allocations in many monitoring efforts. Tasks associated with database management are often given to lower ranking members of the research team, and considered ‘technician work’; not part of “real” science or monitoring. In other settings, databases are simply contracted out to others, and it is hoped that any problems can be fixed that way. Due to these practices, many monitoring databases exist in raw or clumsy formats, are published as dead-end PDFs, or are stored in older Excel-type worksheets. The worst-case scenario involves the consignment of years of hard copy data to a filing cabinet, then to a box, and eventually to the local recycling center (often when the original data manager retires). This situation is particularly discouraging considering that data management has critical implications in the monitoring process and data dissemination and that the proper storage and documentation of years of monitoring data is of utmost relevance for the future use of monitoring data. To overcome this situation, monitoring programs need to make the budgetary commitment necessary to ensure that they have the expertise required for excellent data management. This normally entails hiring experienced database managers.
An Example of a Database Management System: FAUNA
As an example of a recent database management system, the US Forest Service requires that all monitoring data be stored in the Forest Service’s Natural Resource Information System (NRIS) FAUNA database (see Woodbridge and Hargis 2006 for an example). All Forest Service monitoring plans outline several steps in preparing data for entry into the FAUNA database that are intended to be addressed during the development of an inventory or monitoring protocol. Although these basic steps are designed for Forest Service protocols, they can be incorporated into any monitoring initiative:
- All data collected in the field must be reviewed for completeness and errors before entry into FAUNA. The concerns and techniques specific to the protocol being developed should be discussed.
- Protocol development teams should become familiar with the major elements of the FGDC-CSDGM, Biological Metadata Profile (FGDC 1999) to better understand metadata standards.
- Complete descriptions and bibliographic citations for taxonomic, population, or ecological classification systems should be provided, including identification of keywords consistent with the Biological Metadata Profile where appropriate.
- Sources of maps, geospatial data, and population information that are used to delineate the geographic boundaries of the monitoring program or to locate sampling units should be identified.
- Units of measurement should be identified.
- The authors of the protocol and the personnel responsible for maintaining and distributing data resulting from the monitoring programs should be identified (i.e., data steward).
- The anticipated schedule for data reviews and updates should be described.
- All data codes, variable names, acronyms, and abbreviations used in the protocol should be defined.
- An outline or template of the structure of tabular databases in which monitoring program data will be held should be provided.
Summary
Database management is often an afterthought for many monitoring programs, but proper database management and documentation is critical for the long-term success of a monitoring program. An effective database management details six essential components of data collection including what, how many, where, when, how, and who collected the data. If possible, data should quickly be incorporated into a digital database either during data collection or shortly thereafter. Digital formats allow for the building of relational database management systems, often automated metadata documentation, and compatibility with current and global metadata standards. Given the increasing sophistication of database management systems, monitoring programs should place a greater emphasis on consulting or hiring a database manager with the necessary skill set needed for maintaining and querying large databases. The failure to develop a strong database management system early in the monitoring program can lead to information loss and an inability to properly analyze and implement the results of a monitoring initiative in the future.
References
Bisby, F.A., 2000. The quiet revolution: biodiversity informatics and the internet. Science 289: 2309–2312.
FGDC 1998 Content standard for digital geospatial metadata, version 2.0. FGDC-STD-001-1998. Federal Geographic Data Committee, Washington, DC [http://www.fgdc.gov].
Huettmann, F. 2005. Databases and science-based management in the context of wildlife and habitat: Toward a certified ISO standard for objective decision-making for the global community by using the internet. Journal of Wildlife Management 69:466-472.
Jan, L. 2006. Database model for taxonomic and observation data. in Proceedings of the 2nd IASTED international conference on Advances in computer science and technology. ACTA Press,Puerto Vallarta, Mexico.
Travaini, A., Bustamante, J., Rodríguez, A., Zapata, S., Procopio, D., Pedrana, J. & Martínez-Peck, R. 2007. An integrated framework to map animal distributions in large and remote regions. Diversity and Distributions, 13.
Tsou, M.H. 2002. An operational metadata framework for searching, indexing, and retrieving distributed geographic information services on the internet. Pages 312–333 In M. Egenhofer and D. Mark, editors. Geographic Information Science-Second International Conference GIScience 2002, Lecture Notes in Computer Science 2478, Springer, Berlin.
Woodbridge, B. and C.D. Hargis. 2006. Northern goshawk inventory and monitoring technical guide. USDA Forest Service General Technical Report WO-71. 80 p.
