2 Climate Classification Systems
Koppen-Geiger
The Koppen-Geiger climate classification system was originally developed in 1884 by Wladimir Koppen, and then repeatedly revised, finally by Rudolph Geiger in 1961. It is the most widely used tool in the world for categorizing climate zones, and this is primarily because it is based on temperature and precipitation which are the least demanding data sets to come by for any location on Earth {Bailey, Robert G. “Ecosystem Geography: From Ecoregions to Sites” Springer, New York 2009, p.65}
It divides the Earth’s climate types into 5 major climate types, and all of these types are primarily defined by temperature except for B which is defined by precipitation:
A: Tropical
B: Dry (Arid and Semi-Arid)
C: Temperate
D: Continental
E: Polar and Alpine
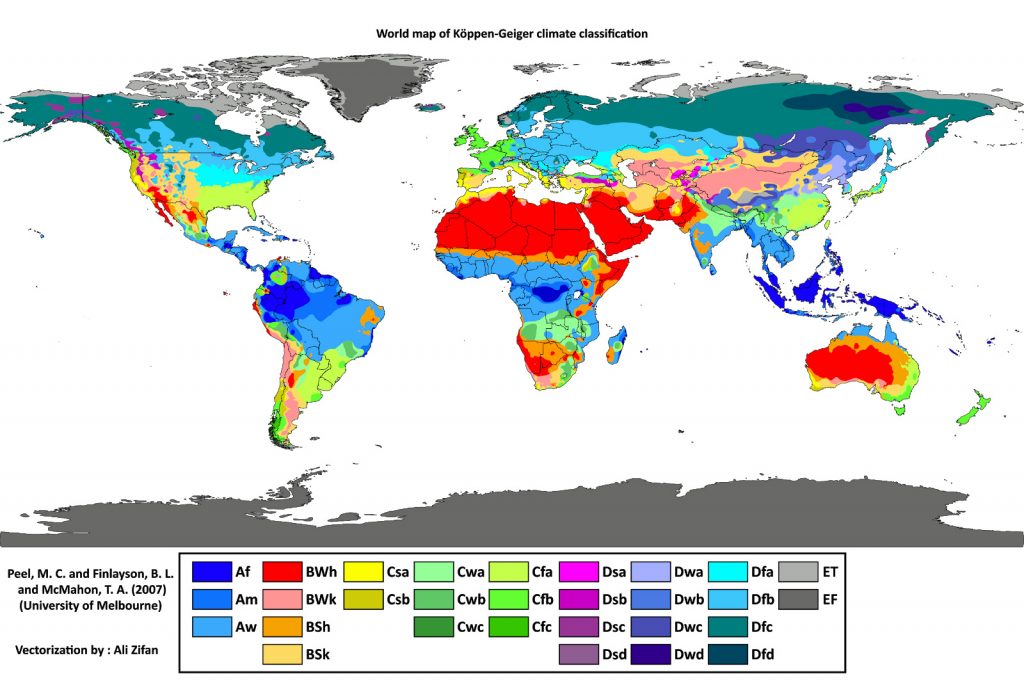
The A,B,C,D,& E in the code represent those major climate types. The second letter in the code represents the seasonality of precipitation. This tells us when during the seasons, precipitation comes to that climate. Does it come as a deluge in a monsoon rain pattern? Are there dry winters, dry summers, or is it wet all year round? The second letter in the code answers those questions..
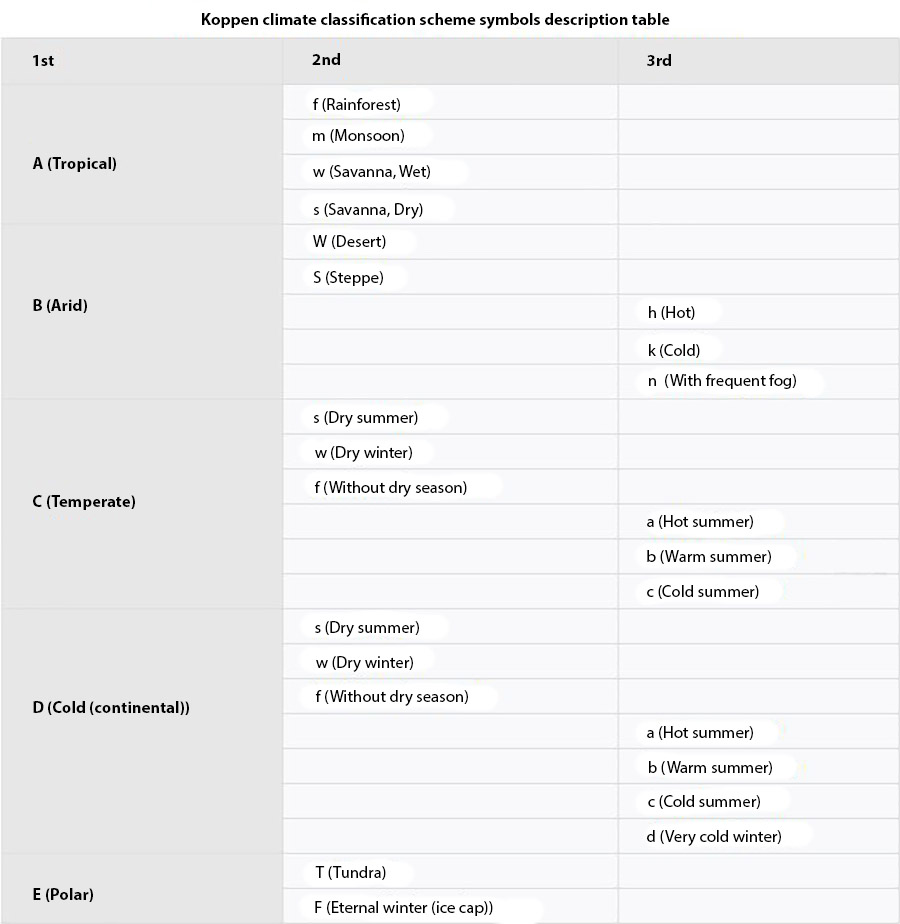
The third letter represents the level of heat, giving the range between hot, warm, cold, and very cold, depending on climate type. Whether a climate class is designated as hot, warm or cold depends upon the average temperature during the coldest and warmest months of the year, and the average temperature of several other months accounted as well. There are more detailed resources available that give lengthy specifications of the temperature classification criteria available in Appendix. C[1] Below is an example at the usefulness and dysfunctionality of this classification tool. Oregon State University is located is in Corvallis, Oregon in the Temperate Mediterranean climate type (Csb). This means that it is temperate, with a dry and warm summer.
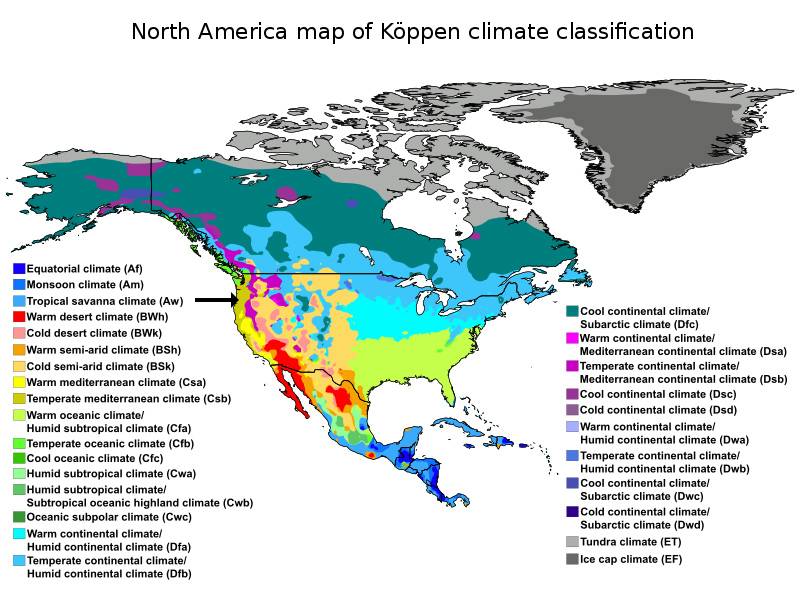
For anyone familiar with the climate of the West Coast of the United States, when we continue South from the Csb climate, the next climate type that we hit is the Warm Mediterranean (Csa), which is a temperate climate with a dry and hot summer in California’s Central Valley, where olives and almonds grow in abundance. As we go North from Corvallis, the next climate type we find is the Temperate Oceanic Climate (Cfb), which is a temperate climate with wet and warm summers as we find on the Olympic Peninsula in Washington State.
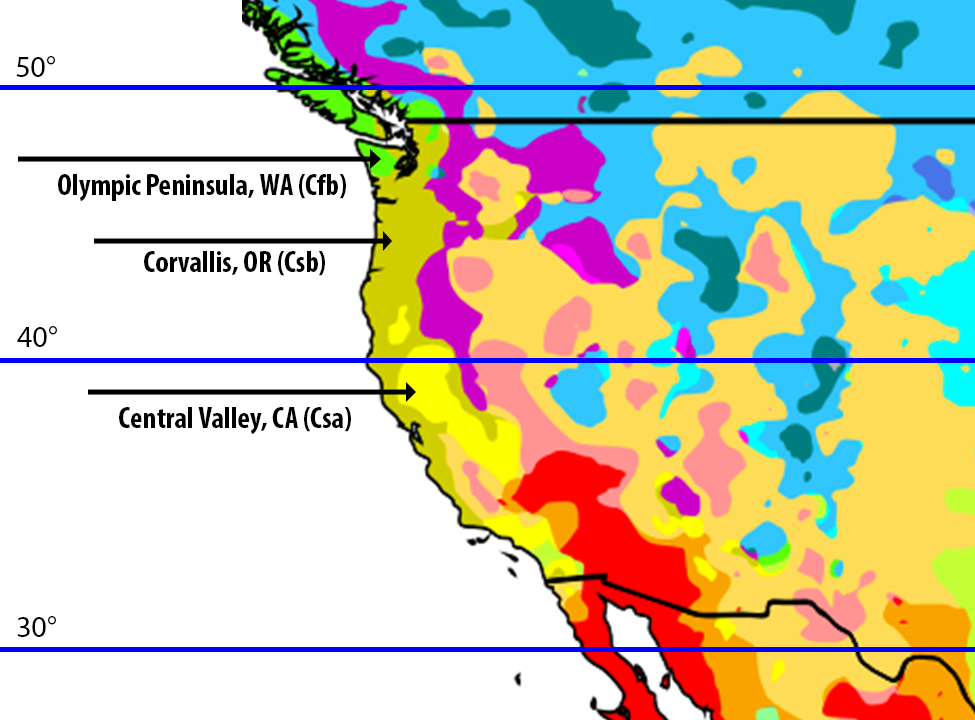
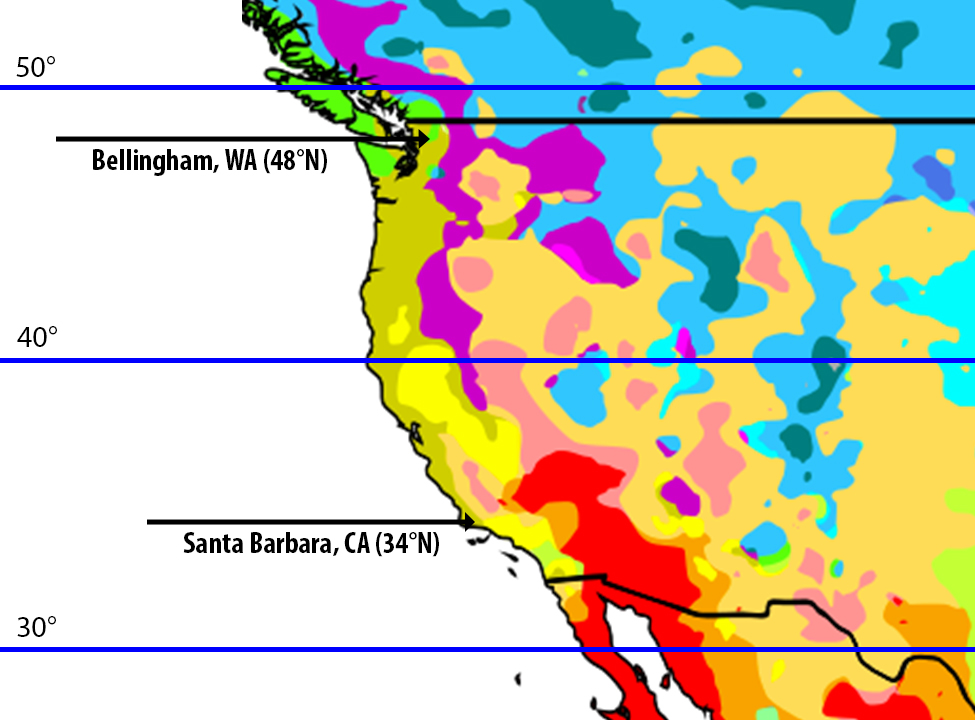
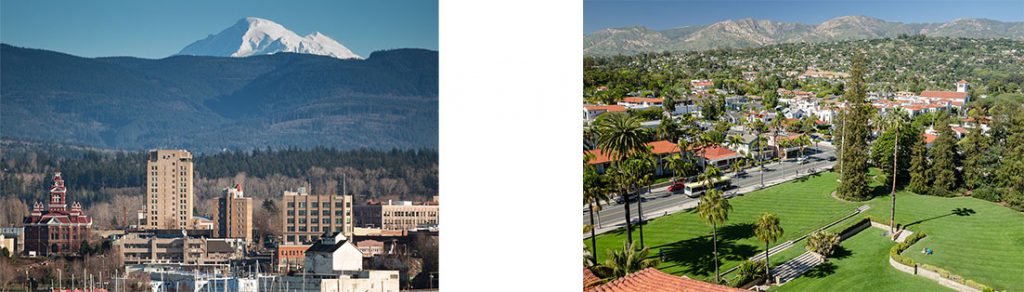
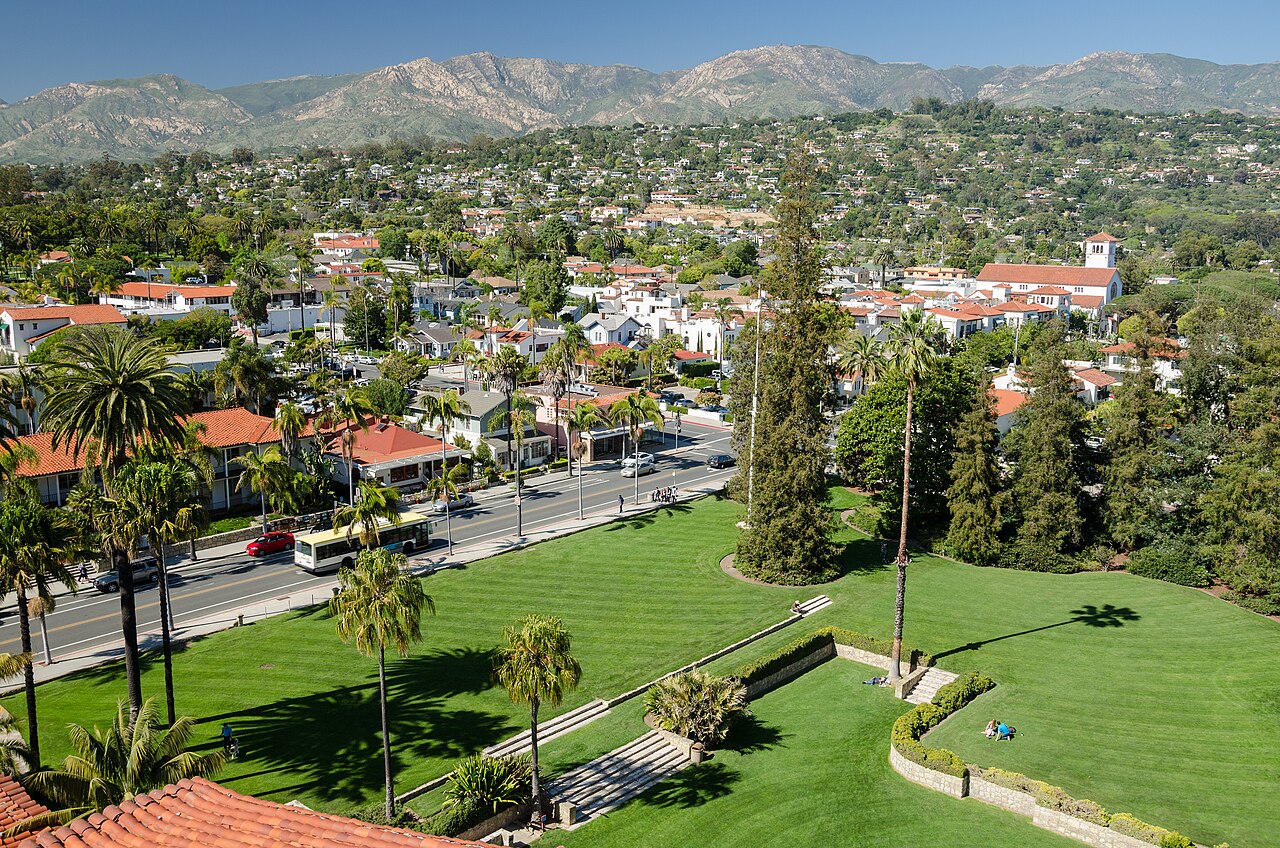
For anyone who really knows the area, there are a lot of things about this map that don’t make sense. For instance, the Temperate Mediterranean Climate zone (Csb) encompasses both Bellingham, Washington, at 48 degrees N latitude, as well as Santa Barbara, California, at 34 degrees N latitude. These locations are 14 degrees latitude different, and are extremely dissimilar to each other in rainfall, temperature, vegetation types, day length and seasonal variation. They do both fall into the Csb climate classification type, but this shows that the Koppen Geiger classification system can be a pretty blunt instrument in some cases.
Koppen-Trewartha
This was recognized by another geographer after Koppen named Glenn Thomas Trewartha, who revised the Koppen Geiger maps and produced the Koppen Trewartha maps in 1966 and then again in 1980. When we look at the Trewartha maps, we see that the area around Santa Barbara is characterized as steppe, and the area around Bellingham is considered Oceanic.
Trewartha’s maps did a lot more to define the climate zones in the mid-latitudes, especially in North America and Asia, to reflect vegetative zones and present a more useful map. When possible, it is preferable to use Trewartha’s improved maps. Although Trewartha’s maps are more reflective of ecosystem variations, it is much more common to find Koppen-Geiger’s maps available for more locations. Koppen-Geiger is more widespread in its usage, and detailed maps have been created for more locations based on Koppen-Geiger climate classes.
Trewartha split the climate types into 6 categories with their defining temperature or precipitation amounts:[2]
A – Tropical: Frost is limited in continental locations; in marine areas the average monthly temperature is above 18°C (64.4°F)
B – Dry: Potential evaporation equals or exceeds precipitation
C – Subtropical: At least 8 months have average temperatures above 10°C (50°F)
D – Temperate: At least 4 months have average temperatures above 10°C (50°F)
E – Boreal: The warmest month has an average temperatures above 10°C (50°F)
F – Polar: All months have an average temperatures below 10°C (50°F)
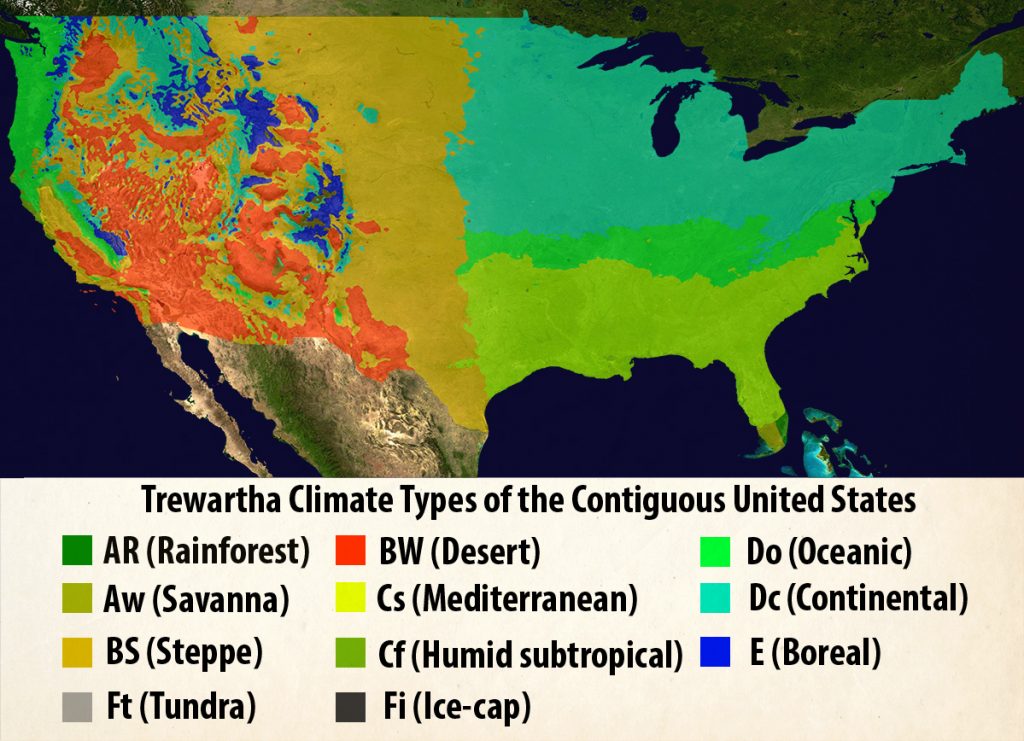
When we break this down further, we get specifics for all of the Koppen-Trewartha’s 13 climate types of the world: Note – the maps used here as examples show 11 climate types. Some maps you will find show 11, and some all 13.[3]
Ar Tropical wet: all months average above 18°C (64.4°F) and no dry season
Aw Tropical wet-dry: same as AR but at least 2 months dry in winter
BSh Tropical/subtropical semiarid: evaporation exceeds precipitation, and all months average above 0°C (32°F)
BWh Tropical/subtropical arid: one-half or below the precipitation of BSh, and all months average above 0°C (32°F)
BSk Temperate semiarid: same as BSh but with at least one month average below 0°C (32°F)
BWk Temperate arid: same as BWh but with at least one month average below 0°C (32°F)
Cs Subtropical dry summer (Mediterranean): 8 months average above 10°C (50°F), coldest month average below 18°C (64.4°F), and a dry summer
Cf Subtropical humid: same as Cs but no dry season
Do Temperate oceanic: 4-7 months average above 10°C (50°F), coldest month average above 0°C (32°F)
Dc Temperate continental: same as Do but with the coldest month average below 0°C (32°F)
E Boreal or subarctic: Up to 3 months average above 10°C (50°F)
Ft Tundra: all months average below 10°C (50°F)
Fi Polar ice cap: all months average below 0°C (32°F)

This is Trewartha’s simplified world map of climate classification, but there are many more detailed regional maps that can be found.
Thornthwaite
Another less commonly used climate classification system that you may find helpful is the Thornthwaite Climate Classification System. Charles Warren Thornthwaite was a US climatologist who devised his system in the 1930’s and 1940’s. His system was originally based purely on a mathematic equation factoring in precipitation and evaporation to identify climate types. This did not take into account the seasonality of precipitation or extreme high and low temperatures but purely the amount of water entering the system from the atmosphere and the amount leaving through evaporation. Later on he added other aspects to his equation based on the water demands by plants and their potential evapotranspiration, calculated from data on air temperature and day length.
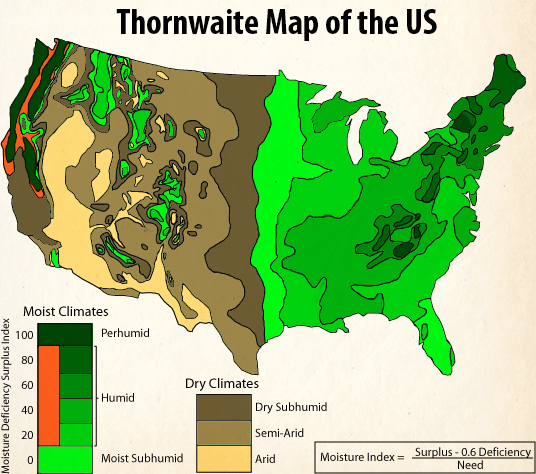
When we view Thornthwaite’s map of the US, the Western half looks very similar to Koppen and Trewartha’s maps, but the Eastern half of the country looks quite different, more closely following elevation changes, with the Appalachian Mountain chain obvious in the zones of Perhumid and moist humid areas (black, dark blue, and green) in the Mid-Atlantic region of the country.
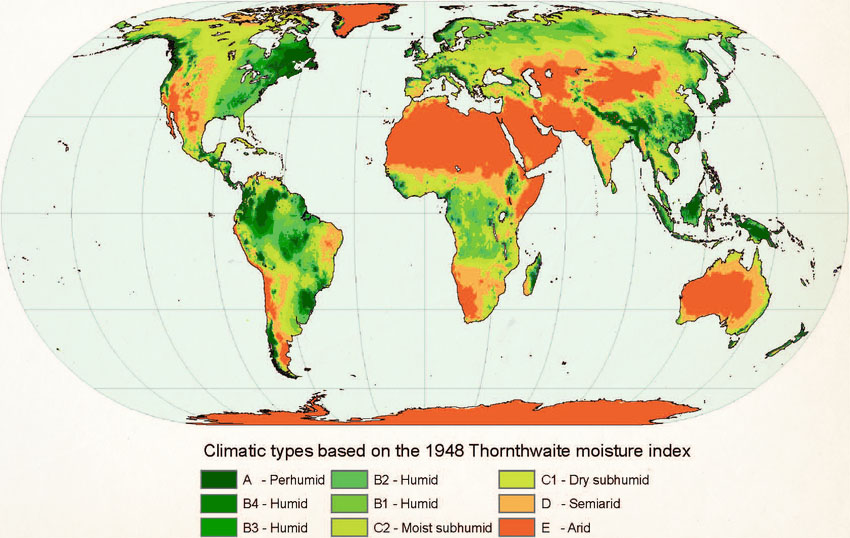
The Thornthwaite map will be most useful as another reference to check to make sure there are no major differences between areas that are being overlooked when assessing locations for their climate analogue and climate change analogue potentials.
It’s important to recognize that any one of the climate classification maps shown are incredibly general, so looking at the particular factors of your site will be important for you to get to the next level of understanding of the details and conditions that you are designing for.
