7 Climate Change Analogue Examples
I will now go through the process of locating a climate change analogue for two places I am intimately familiar with: my current home in Corvallis, Oregon and my previous home in Prescott, Arizona.
Case study #1: Corvallis, Oregon, USA

Step 1: Locate the site on a Koppen Geiger climate change forecast map and identify the projected climate classification.
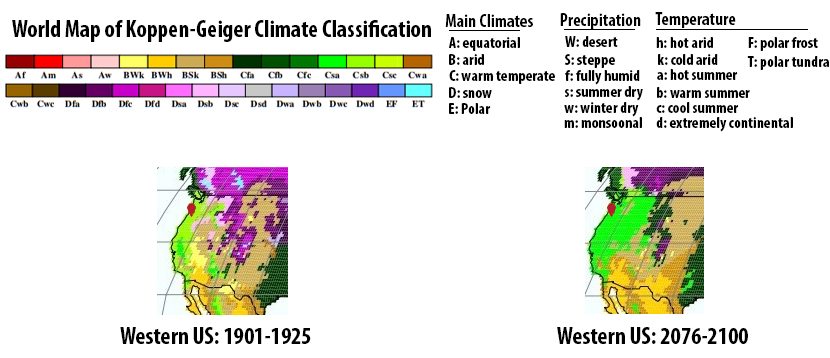
In short, Western Oregon is projected to go from a Csb climate type to a Csa, meaning from a Warm Summer Mediterranean climate to a Hot Summer Mediterranean Climate
Step 2: Research region-specific climate change forecasts.
The Pacific Northwest of the US is fortunate to have top-notch climate change research going on and easy-to-digest forecasts for the various biomes within the region. To get a well-summarized forecast, I just needed to look to Oregon State University’s state funded Oregon Climate Change Research Institute and their publication “The Third Oregon Climate Assessment Report January 2017”. [1]
In the legislative summary at the beginning of the report, they broke down the general trends for the state, and then specific forecasts for the Willamette Valley in which Corvallis is located. It reads:
Oregon will continue to warm Under continued increasing greenhouse gas emissions, Oregon’s climate is projected to warm on average 3–7°F by the 2050s and 5– 11°F by the 2080s. If greenhouse gas emissions level off by mid-century, warming would be limited to 2–5°F by the 2050s and 2–7°F by the 2080s. Annual precipitation is projected to increase slightly, although with a high degree of uncertainty. Summers are expected to warm more than the annual average and are likely to become drier. Extreme heat and precipitation events are expected to become more frequent.
In the Willamette Valley, declining snowpack, earlier snowmelt, and greater summer water demand may increase summer water scarcity; and wildfire activity is expected to increase.
So in summary, warmer and drier in summer with extreme heat and extreme precipitation events during the rainy season.
Step 3: Using a climate data chart, see how close the area is to shifting climate zone classifications.
Here is a climate data chart for Corvallis, Oregon, home of Oregon State University:
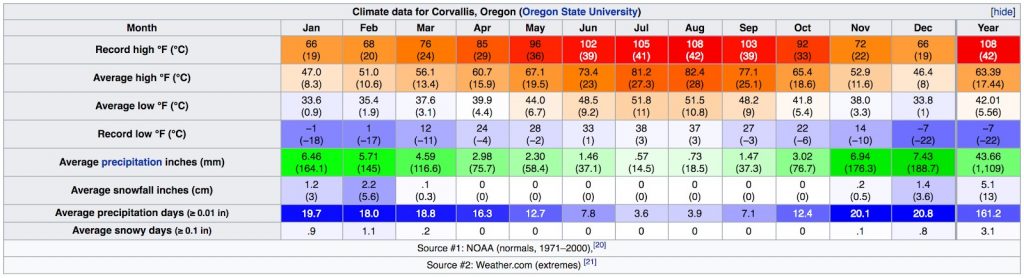
The monthly average high and low temperatures and the average monthly precipitation amounts are the pieces of data that will help to see how solidly in one climate class or another a site is. Commonly available charts may or may not include the daily mean temperature, which is different than the average high and average low. So for the purposes of seeing where a site sits within the range of a climate type, the average monthly low and high temperatures will need to be added and then divided by 2 to get the daily mean temperature if it is not provided in the climate data chart.
average monthly low + average monthly high
______________________________________ = daily mean temperature
2
I find these charts easily by searching a city name on Wikipedia. This method can only be done for sites where this climate data is available.
Corvallis falls in the Koppen Geiger class Csb. The Csb description has been broken down with comments about Corvallis’ climate data:
Csb = Warm-summer Mediterranean climate
1) Coldest month averaging above 32 °F (0 °C)
Yes. January is the coldest month and the average temperature is 40.3°F (4.6°C)
2) All months with average temperatures below 71.6 °F (22 °C).
Yes. August has the highest monthly temperature at 66.95°F (19.15°C)
3) At least four months averaging above 50 °F (10 °C).
Yes. 7 months average above: April 50.3F (10.15°C), May 55.55°F (13.1°C), June 60.95°F (16.1°C), July 66.5°F (19.15°C), Aug 66.95°F (19.4°C), Sept 62.65°F (17.05 °C), Oct 53.5°F (12°C)
4) At least three times as much precipitation in the wettest month of winter as in the driest month of summer, and driest month of summer receives less than 1.2 in (30 mm).
Yes. The wettest month is Dec with 7.43” (188.7mm) of precipitation, and the driest month is July with .57” (14.5mm) of precipitation.
Now we’ll look at Corvallis’ climate data in comparison to the next hotter climate classification:
Csa = Hot-summer Mediterranean climate
1) Coldest month averaging above 0 °C (32 °F)
Yes. January is the coldest month and the average temperature is 40.3°F (4.6°C)
2) At least one month’s average temperature above 71.6 °F (22 °C)
No. The average highest monthly temperature is in August at 66.35°F (19.05°C)
3) At least four months averaging above 10 °C (50 °F)
Yes. 7 months average above: April 50.3F (10.15°C), May 55.55°F (13.1°C), June 60.95°F (16.1°C), July 66.5°F (19.15°C), Aug 66.95°F (19.4°C), Sept 62.65°F (17.05 °C), Oct 53.5°F (12°C)
4) At least three times as much precipitation in the wettest month of winter as in the driest month of summer, and driest month of summer receives less than 30 mm (1.2 in).
Yes. The wettest month is Dec with 7.43” (188.7mm) of precipitation, and the driest month is July with .57” (14.5mm) of precipitation.
The only place where Corvallis deviated from the Csa climate class is in the average highest monthly temperature. These averages are typically measured over a 30 year period. But individual years have already started deviating into Csa temperature ranges. For example, August 2017 had an average monthly temperature of 22.85°C (73.13°F), where high temperature records were set throughout the state. [2]
This led to an extremely active fire season, as vegetation adapted to Csb conditions met Csa temperatures. The results in the Pacific Northwest were literally choking.
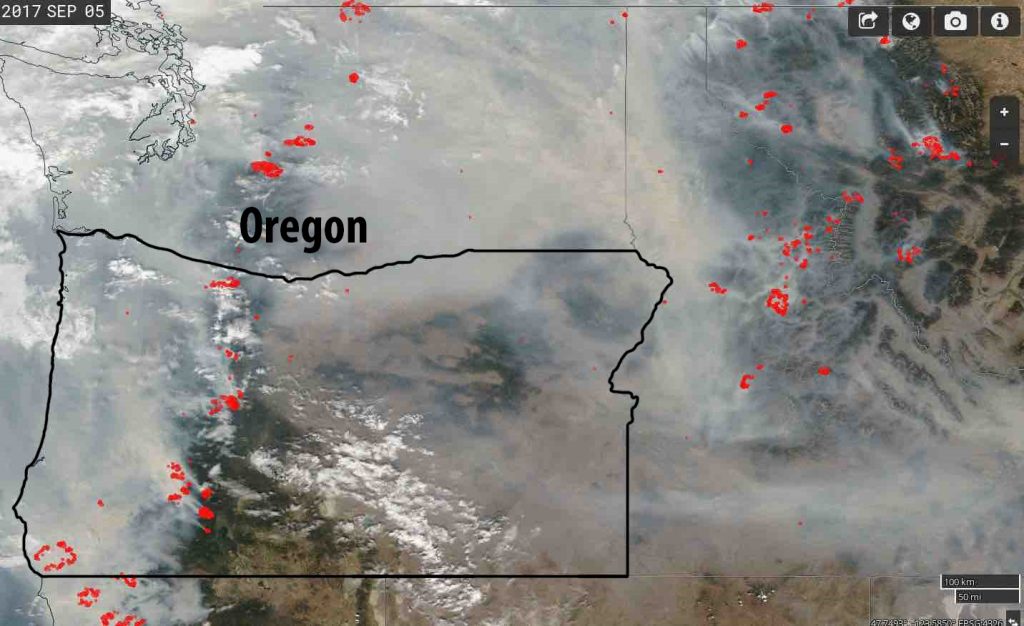
A quick check of average August temperatures in Corvallis over the last 10 years show that 7 of them saw temperatures above average, although only 2017 had a high enough average to fall within Csa range.
To expand on the impact of the warm season heat of 2017, when we go further South into the Csb and Csa climates of Central California, at the height of landscape dehydration before the rains arrive, we see massive and catastrophic wildfires there as well. This is after San Francisco received it’s all time record high temperature of 106°F (41°C) on September 1, 2017.
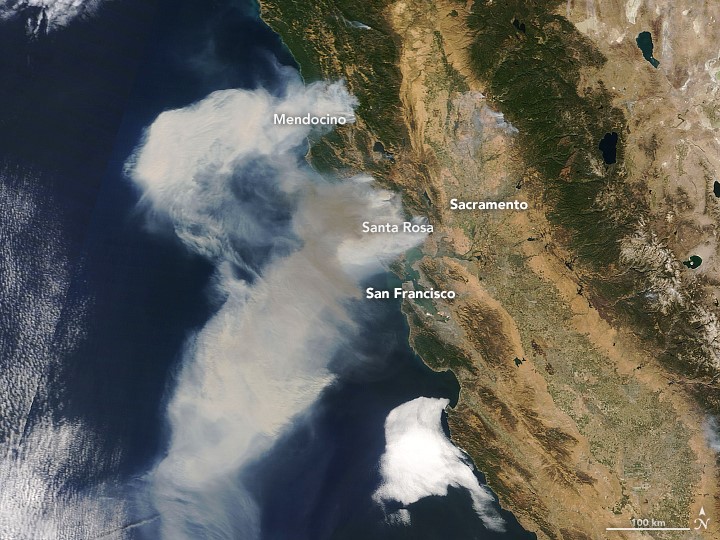
Image Source: NASA Earth Observatory images by Joshua Stevens, using MODIS data from LANCE/EOSDIS Rapid Response
Is this just an extreme deviation from the norm, or a glimpse into the new norm? Personally I’m taking it as a wake up call, and my Permaculture design and education work is now factoring more extreme heat events and wildfire scenarios into the equation.
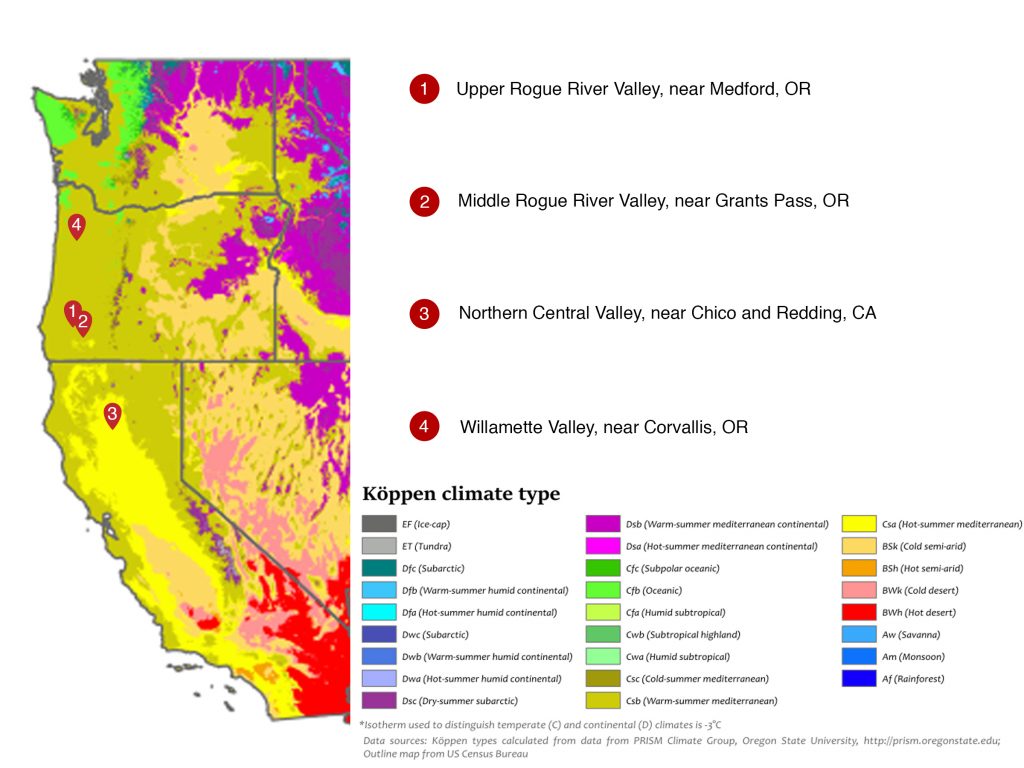
Step 4: Find regions that are located now within the projected new climate type.
The obvious first place to look in finding a climate change analogue for the Willamette valley in Oregon is to head South and find the closest valley area with a Csa designation. This is because Corvallis and the Willamette Valley is close to sea level, below 500 ft (150m), and when we look at the West Coast of the US, there are a lot of areas of low elevation in a similar proximity to the coast both up and down in latitude. So going down latitude looking at areas with a similar elevation and landscape positioning should yield a close climate change analogue.
Luckily an internet search found a Koppen map of the United States that has higher resolution than most, put together by the PRISM Climate Group of Oregon State University.[3] That lead me to look first in Southern Oregon, in the Upper Rogue River Valley around Medford and the Middle Rogue Valley around Grants Pass, as those are the closest valley-bottom locations within the Csa climate class. Further South than that I’d like to look in the northern Central Valley of California in the region between Reading and Chico. So I will examine each of those four locations to see if one stands out as a more likely climate change analogue.
One important point to make is that there will not be one perfect climate change analogue. There will be components of different locations that are relevant to study and that will represent climate types at different points in the future. But in order to obtain specific climate data, it is necessary to pick specific locations for analysis.
Recall step 4 in the methodology for locating climate change analogues. The first two actions were to “Look for areas within 10 degrees North or South of your latitude.”, “Look for areas with the same proximity to water; oceanic or continental.” That was what I did by looking south along the West Coast.We will now go step by step through each item. I created a chart for easy comparison of some of the major measurements:
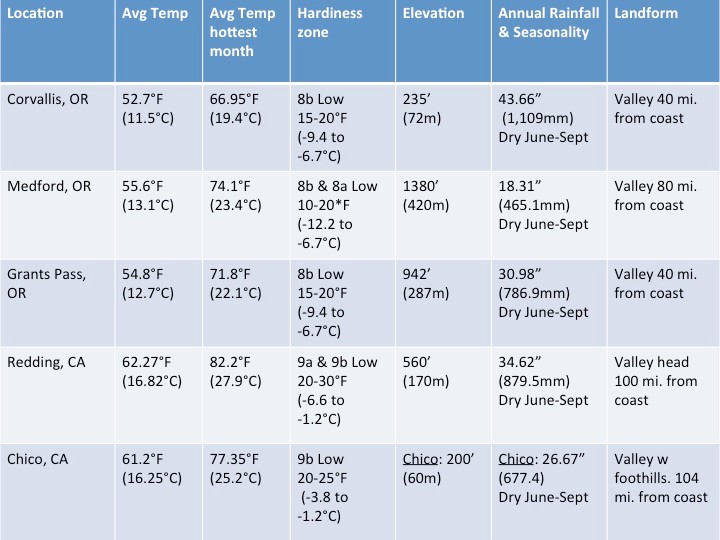
Here are the things not covered on the chart:
Examine global air circulation and storm tracks.
Jetstream comes from the West and is same for all locations. However, the further South the location, the less impact of the Polar jetstream and the greater impact of tropically derived “atmospheric river” events.
Examine nearby ocean currents.
Same for all locations. Cold California current moves water from poles towards equator.
Compare topographic features and landscape positioning.
Corvallis: Mid-Valley between river and foothills, on East side of Coastal Mountains. 40 miles (64 km) from coast
Medford: Middle valley bottom, 80 miles (129 km) from coast
Grants Pass: East side of valley with river running through. 56 Miles (90 km) from coast
Redding: Head of valley with river running through, edge of foot hills and valley bottom. 100 miles (161 km) from coast
Chico: East side of valley. Edge of foothills and valley. 104 miles from coast
Compare global soil regions.
Corvallis: Mollisols
Medford: Mollisols
Grants Pass: Inceptisols
Redding: Inceptisols
Chico: Entisols
For my climate change analogue, I decided to look at both long and short term possibilities. The short term analogue is the town of Grants pass on the Rogue River in Southern Oregon. Here are some pertinent points:
- Grants Pass is in a Csa climate class and is located about 150 miles (240 km) to the South of Corvallis
- It’s about 700’ (213m) in elevation higher than Corvallis.
- It is only 16 miles (26km) further from the coast than Corvallis.
- That distance between Grants Pass and the Pacific Ocean is filled with multiple mountains above 4000’ (1200m), which seem to have the effect of making Grants Pass drier than Corvallis by around 12.5” (350mm) of precipitation per year.
So this is not a perfect analogue, because Corvallis is set to get wetter during the winter, and Grants Pass has significantly more sunny days (196 as opposed to Corvallis’ 159), but temperature-wise, Grants Pass is 2.1F (1.2°C) warmer on average and 4.85°F (2.5°C) degrees warmer during August, the hottest month. It also has the same hardiness zone as Corvallis, 8b. This makes Grants Pass an excellent place to look at plant species in terms of temperature and the future plant palette for a warmer climate.
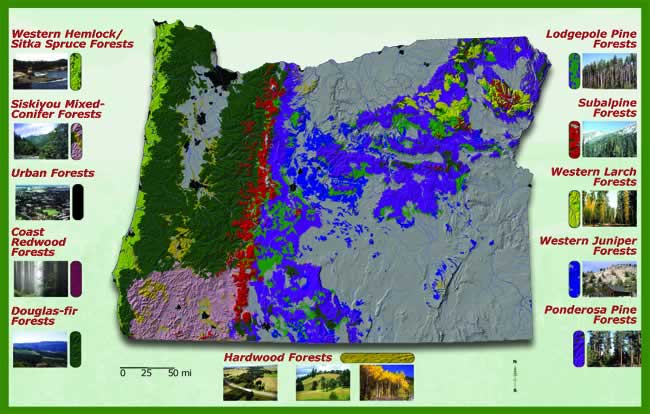
One important thing to note is that the Douglas Fir forest type does not extend into Southern Oregon, which is in the Siskiyou mixed-conifer forest zone. Does this mean that the Douglas Fir forest will possibly be retreating North? Will higher winter rainfall be enough to compensate for higher summer temperatures with less summer precipitation? Is fire the most likely agent of the Douglas Fir range moving North? Can the Permaculture design perspective help to avoid catastrophe?
These are huge questions whose answers affect the lives of millions of people, wildlife, and the entire economy and vitality of the region. Any comprehensive solution will need to involve government and institutions at all levels.
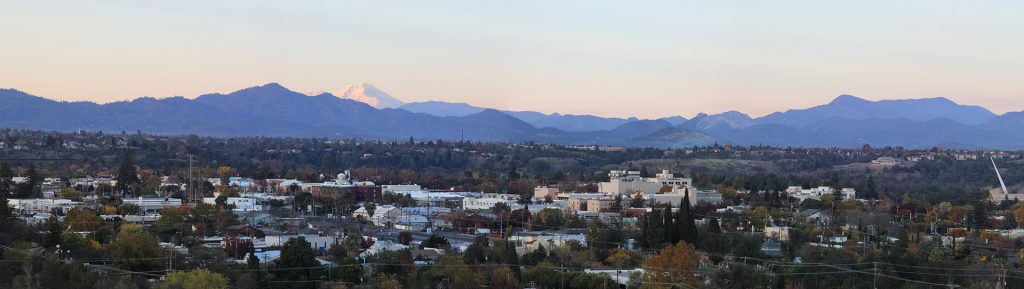
For the pessimistic longer term runaway-climate-change outlook of what the Central Willamette Valley may resemble into the next century, I went 280 miles South to the Northernmost city in California’s Central Valley, Redding.
Redding stood out as a long term climate change analogue for these reasons:
- It is close in elevation to Corvallis at 225’ (68.5m) higher.
- It is close in rainfall, only 9” (228mm) lower than Corvallis.
- Corvallis and Redding have a similar topography where river meets foothills
- Redding’s average temperature is about 9.4°F (5.3°C) warmer than Corvallis.
- Redding’s average temperature during the hottest month of the year is 15.25°F (8.5°C) hotter than Corvallis.
- Redding’s yearly low temperatures are about 5-10°F (9-18°C) higher than Corvallis.
When we examine the differences in the average annual temperatures and the average temperature during the hottest month, this is a pretty extreme warming scenario. The Oregon Climate Change Research Center’s says that “Under continued increasing greenhouse gas emissions Oregon’s climate is projected to warm on average 3–7°F by the 2050s and 5– 11°F by the 2080s. If greenhouse gas emissions level off by mid-century, warming would be limited to 2–5°F by the 2050s and 2–7°F by the 2080s”.[4] By these standards, Redding fits into their models as a potential analogue by the end of the century.
Here are some other issues to consider in this scenario:
- Rainfall in Western Oregon is set to increase, so rainfall gap may widen.
- With undulating jetstream, there’s also the possibility of more extreme periodic cold waves, like the one seen in 2013 when Corvallis hit -1°F (-18°C), and nearby Willamette Valley city Eugene reached -10°F (-23°C).
Overall, it looks like a pretty good fit, and I’m going to be paying a lot more attention next time I go through there! Here are some interesting things learned from doing further research on Redding:
- Olives are grown there. Olives die at 10°F (-12°C) but there are attempts to grow cold-adapted varieties in the Willamette Valley now. This could be a potential new crop with a warming climate.
- California’s Central Valley is known for its almonds, however there is not significant acreage grown in the Redding area. Is is a matter of temperature, soils or water? This requires further research.
- Aside from olives, the other top crop items are wild rice, pasture, nursery stock, and barley for grains.
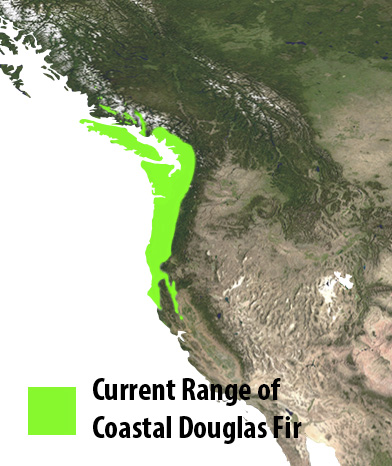
- The ecosystem type is Oak Woodland, with the absence of Douglas Fir, the predominant tree in Western oregon. The map below shows the current range of Coast Douglas Fir (in green). Douglas fir does not extend into the Central Valley in California. This brings up the same questions from the assessment of Grants Pass, about the Douglas Fir range retreating northward and the possibility of massive tree die-off and wildfire.
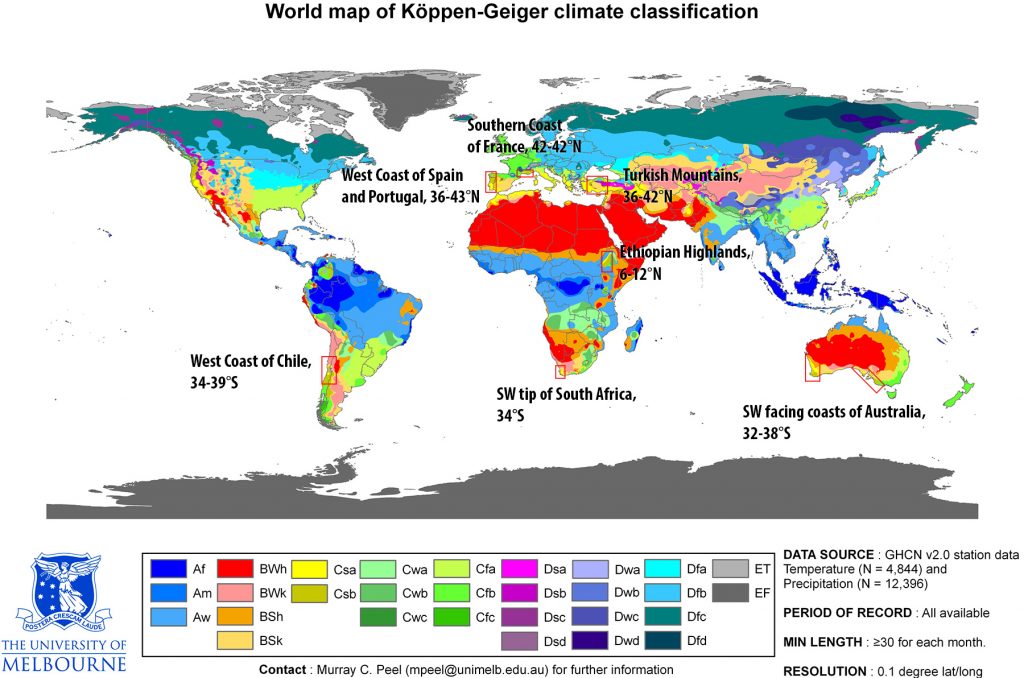
One key point of observation to learn the most about the potential climate shift from Csb to Csa is to look at other places in the world where the Csb and Csa climate classes border each other. These are areas that we will find similar temperature, precipitation, and precipitation seasonality. In nearly every one of these locations, the Csb is also bordered by the Cfb, which is an oceanic climate similar to Csb but with summer rainfall.
Those regions that have similar geography to Western Oregon, located on the west coasts of continents in temperate climate latitudes are of particular interest because of similarities in weather patterns, solar influence, and relationship to the ocean. If we as Permaculturists are going to help develop new ecosystems for new climatic conditions, then studying the edge between climate zones analogous to our own could yield some very innovative techniques and valuable species that could be of great assistance. Below are some places of interest in the world to do more research on:
Case study #2: Prescott, Arizona, USA
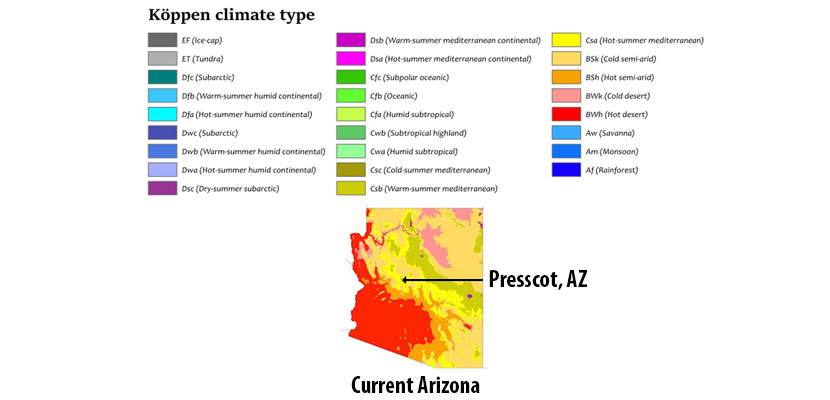
Step 1: Locate the site on a Koppen Geiger climate change forecast map and identify the projected climate classification.
For the current climate classification, I was able to locate a more detailed Koppen climate map of Arizona with higher resolution put together by the PRISM Climate Group at Oregon State University. This map shows Prescott sitting right on the edge between Csb Warm summer mediterranean and Csa Hot summer mediterranean, yet also in very close proximity to Bsk Cold semi-arid. We’ll sort out which classification it is in by examining the climate data.
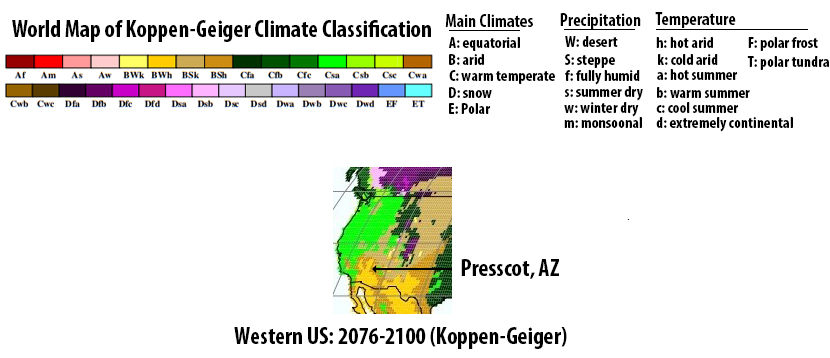
On the climate change forecast model, although the resolution is low, Prescott is placed in Bsh Hot arid steppe. The low resolution does not account for the microtopography shown on the current Arizona map, where Prescott is tucked into a North facing bowl with water runoff from tall adjacent mountains, but it’s a good guide from which to start.
Step 2: Research region-specific climate change forecasts.
Arizona is set to warm disproportionately more than other places, along with extended droughts, decreasing snowpack, and hence increasing wildfires. The US Environmental Protection Agency (EPA) had this to say about Arizona’s overall climate outlook:
“Arizona’s climate is changing. The state has warmed about two degrees (F) in the last century. Throughout the southwestern United States, heat waves are becoming more common, and snow is melting earlier in spring. In the coming decades, changing the climate is likely to decrease the flow of water in the Colorado River, threaten the health of livestock, increase the frequency and intensity of wildfires, and convert some rangelands to desert.”[5]
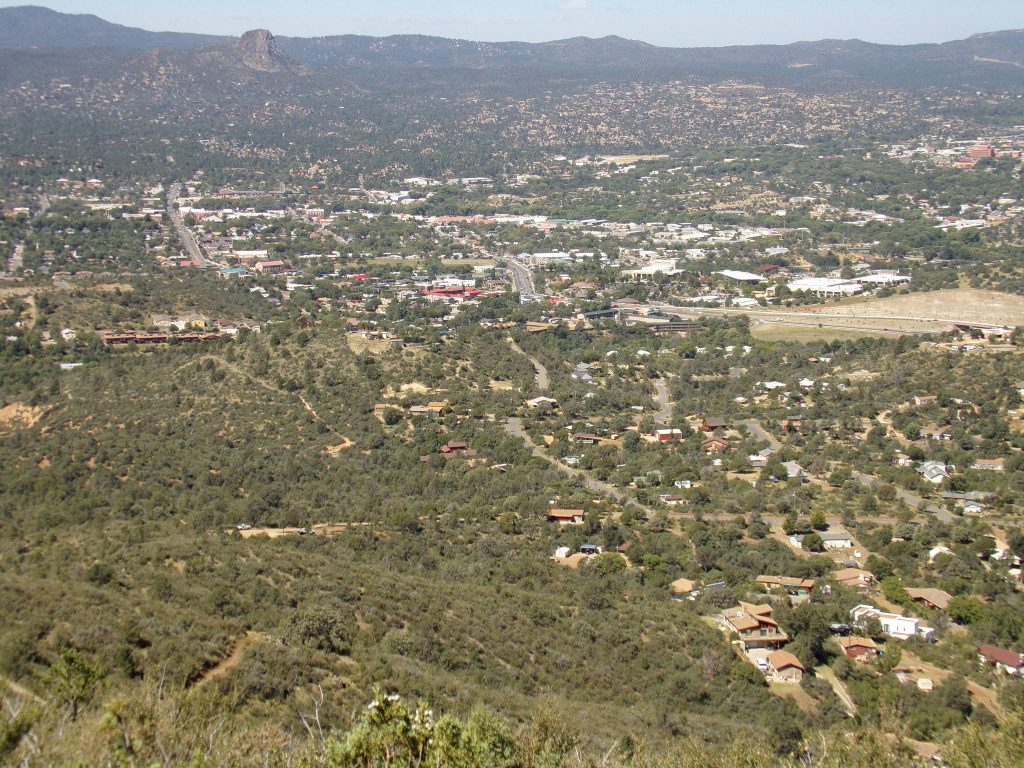
Another article talks about the climate future of Flagstaff, Arizona in reference to the climate of Prescott. Flagstaff is located about 2,000ft (610m) higher than Prescott and the projected rise in temperature of about 7°F (3.9°C) could likely be the same for Prescott by 2100.
“The area around Prescott provides a good visual for what areas around Flagstaff will likely look like by the end of the century, Kolb said. The city is an average of 7 degrees warmer than Flagstaff, which is about the temperature increase this area is expected to experience by 2100, according to climate change predictions. Prescott is mostly surrounded by grasses and shrubs, but there are still patches of forest in cooler, wetter areas.”[6]
Another recent study shows that Arizona’s monsoon rains are increasing in intensity, while at the same time daily average precipitation is falling throughout the state.[7] This goes along with the general climate change trend where monsoonal rainfall is becoming more intense and erratic.
In summary, Prescott is set to get significantly hotter, punctuated by extreme heat events and extreme monsoon rain events, with less snowpack and likely a transition to a more grass and shrub than tree based ecosystem. Hopefully wildfire will not be the primary agent of the shift in vegetative type.
Step 3: Using a climate data chart, see how close the area is to shifting climate zone classifications.
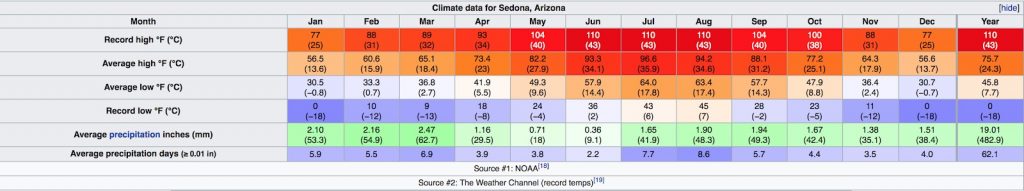
Here is a climate data chart for Prescott, Arizona:
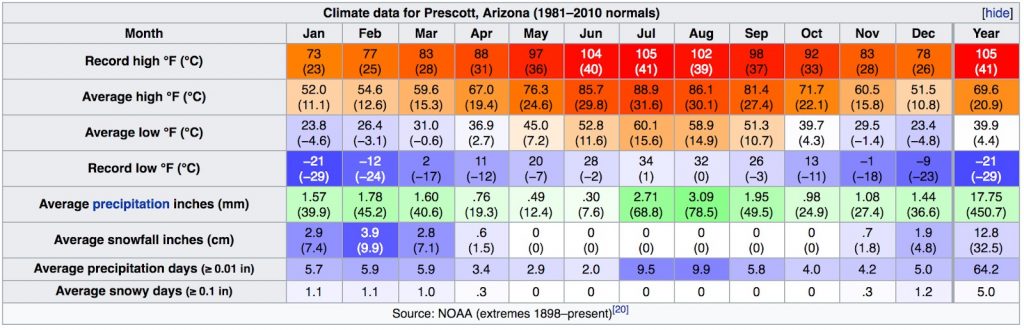
Prescott falls in the Koppen Geiger class Csa. The Csa description has been broken down with comments about Prescott’s climate data:
Csa = Hot-summer mediterranean climate
1) Coldest month averaging above 0 °C (32 °F)
Yes. Average lowest monthly temperature is December at 37.45°F (3°C)
2) At least one month’s average temperature above 22 °C (71.6 °F)
Yes. Average highest monthly temperature is in July, at 74.5°F (23.6°C)
3) At least four months averaging above 10 °C (50 °F).
Yes. 7 months average above: April 51.9F° (11.05°C), May 60.15°F (15.9°C), June 69.25°F (20.2°C), July 74.5°F (23.6°C), Aug 72.5°F (22.5°C), Sept 66.35°F (19.05 °C), Oct 55.7°F (13.2°C)
4) At least three times as much precipitation in the wettest month of winter as in the driest month of summer, and driest month of summer receives less than 30 mm (1.2 in).
Yes. Wettest month is Aug with 3.09” (78.5mm); Driest month is June with .30” (7.6mm).
Equation: 3 x .30 = .90″, .90″<3.09″
Now we’ll look at Prescott’s climate data in comparison to the two next hotter climate classifications. The original low-resolution Koppen climate change prediction map has Prescott as BSk, Hot semi-arid climate. But in looking at the more detailed PRISM Climate Group map of current Koppen Geiger classes, there is greater resolution, and thus more thought needs to be put into this. There is such diversity of topography, solar aspect, and soil and vegetation conditions in this region, that it was helpful to overlay the PRISM map on a Google Earth image to see the subtleties of how climate types interact with topography. It helps that I am intimately familiar with the landscape, soils and vegetation types in this region.
There are areas where the Csa climate type borders both the BSh (Hot semi-arid) and BSk (cold semi-arid) climate types. So in order to make an accurate prediction, both need to be examined in relation to Prescott’s current climate.
BSh & BSk = Hot and cold semi-arid climates
1) Multiply the average annual temperature in Celsius by 20, then add
Average high (20.9°C) + Average low (4.4°C) ÷ 2 = 12.65°C average annual temperature.
12.65 x 20 = 253
(a) 280 if 70% or more of the total precipitation is in the spring and summer months (April–September in the Northern Hemisphere, or October–March in the Southern), or
No. 52% of annual precipitation falls between April-September.
Equation:
April (19.3mm) + May(12.4mm) + June(7.6mm) + July (68.8mm) + August(78.5mm) + Sept(48.5mm) = 235.1mm
Total precipitation = 450.7mm
235.1 ÷ 450.7 x 100 = 52%
(b) 140 if 30%–70% of the total precipitation is received during the spring and summer, or
Yes. 52% of annual precipitation falls between April-September. So 140 + 253 = 393
(c) 0 if less than 30% of the total precipitation is received during the spring and summer.
No
2) If the annual precipitation is less than 50% of this threshold, the classification is BW (arid: desert climate); if it is in the range of 50%–100% of the threshold, the classification is BS (semi-arid: steppe climate).
No. It is neither
Annual precipitation = 450.7mm. That is not less than 50% of 393
3) A third letter can be included to indicate temperature. Originally, h signified low-latitude climate (average annual temperature above 18 °C (64.4 °F) while k signified middle-latitude climate (average annual temperature below 18 °C), but the more common practice today, especially in the United States, is to use h to mean the coldest month has an average temperature above 0 °C (32 °F), with k denoting that at least one month’s averages below 0 °C.
Average annual temperature is 12.65°C, below 18 °C (64.4 °F)
Average temperature of coldest month is average high (10.8°C) + average low (-4.8°C) ÷ 2 = 3°C, which is above 0 °C (32 °F).
Summary:
In order for Prescott to get into the B climate classes, there would need to be a combination of reduced precipitation and increased temperature because of how the B classes are calculated. For instance, if the rainfall reduced to 15” (381mm) annually and the temperature went up by 9.81°C (17.66°F) then Prescott could be BSh. But that is more extreme than the highest emissions scenarios which puts annual temperature rise by the end of the century at around 8°F (4.4°C), so it’s most likely that even by the end of the century, Prescott will stay within the Csa range, although it will move closer to BSh.[8]
Step 4: Find regions that are located now within the projected new climate type.
Because there is not a distinct transition to a different Koppen Geiger climate type, I chose to investigate nearby areas. I began by looking at the average annual temperature, elevation, precipitation and landform of surrounding cities and comparing them to Prescott:
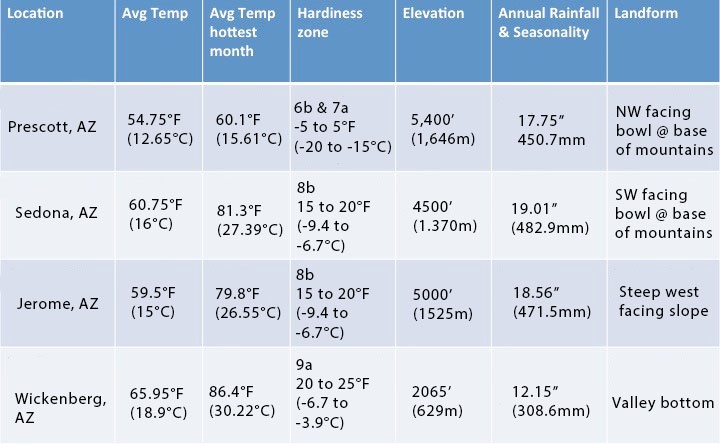
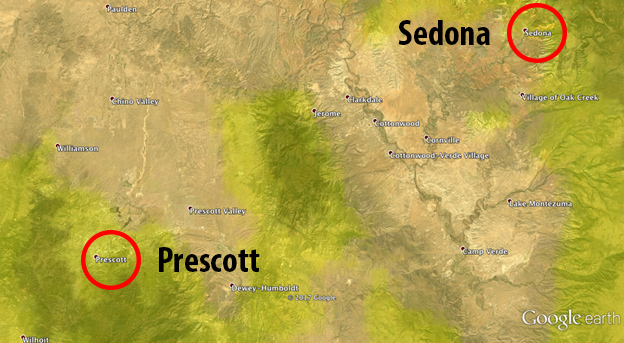
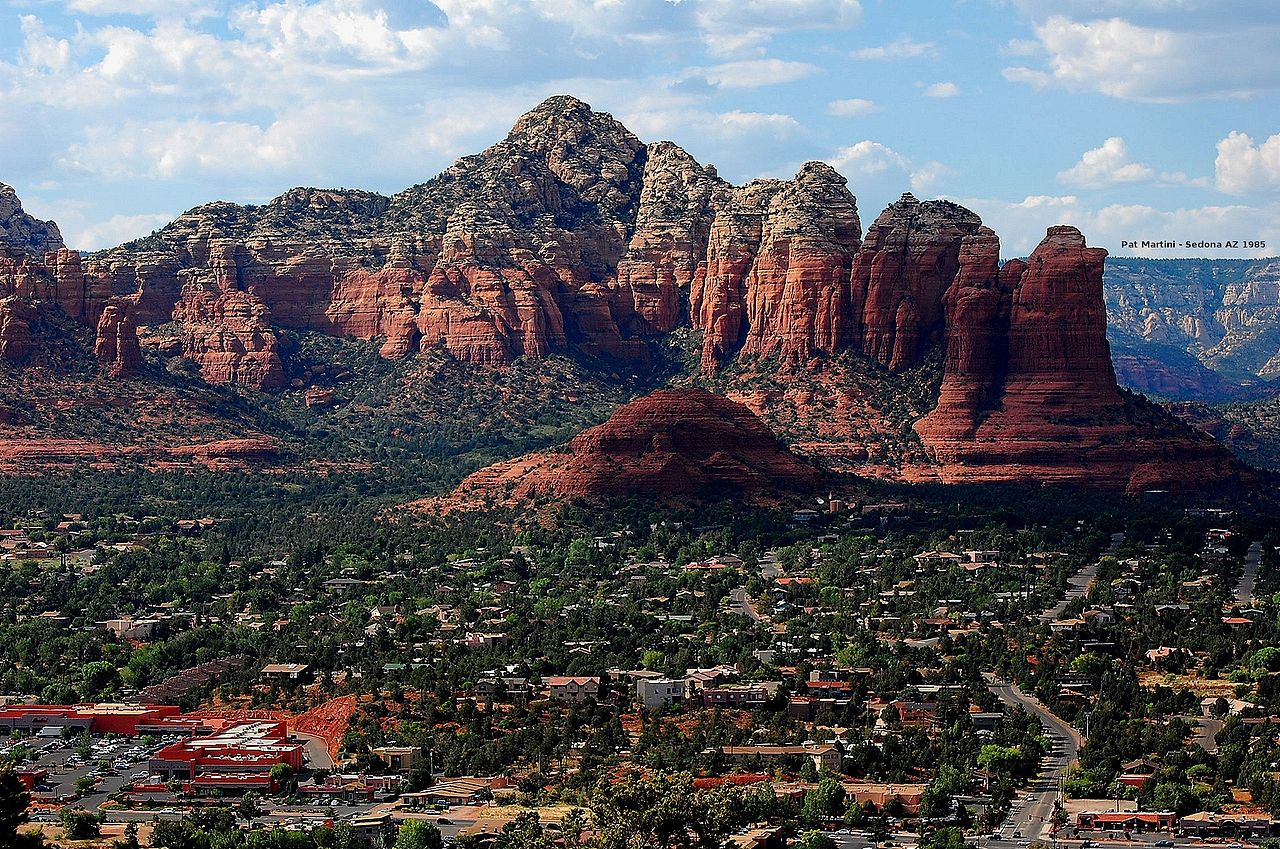
Climate Change Analogue: Sedona, Arizona
After this short analysis, I’m going to look further into Sedona as a realistic near-term (mid-century) climate change analogue. This is principally because it is 6°F (3.3°C) hotter than Prescott on average, and is located in a bowl at the base of a mountain with many rock features and undulating topography within the town. Where Prescott is located in the transition between Csc, Csb, and Csa, Sedona is located in the transition between Csa and BSk. Both locations are between mountain and valley ecosystems with varied topography. Both towns are also built around a waterway, although Prescott’s is an intermittent creek and Sedona’s is perennially flowing.
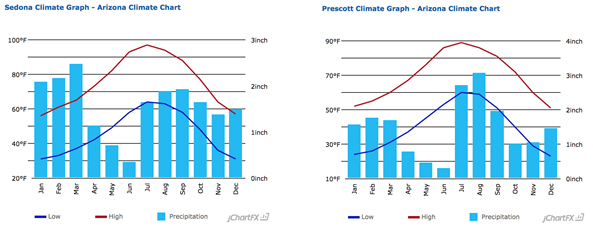
Even though Sedona is 900’ (274m) lower than Prescott, the precipitation is slightly higher. This is atypical because normally in this region precipitation is reduced with lowered elevation. A quick look at the climatograms from each location show that Sedona gets more precipitation than Prescott January-April but less rainfall during the monsoons in July and August. I do not understand the dynamics of that. But regardless, the higher temperatures and subsequent increased evapotranspiration of plants means a dramatic change in the ecosystems between Sedona and Prescott. Sedona has a lot of unvegetated monolithic rock features which have a high runoff coefficient during storm events, so the landscape characteristics combined with higher temperatures mean Sedona is overall a drier landscape than Prescott.
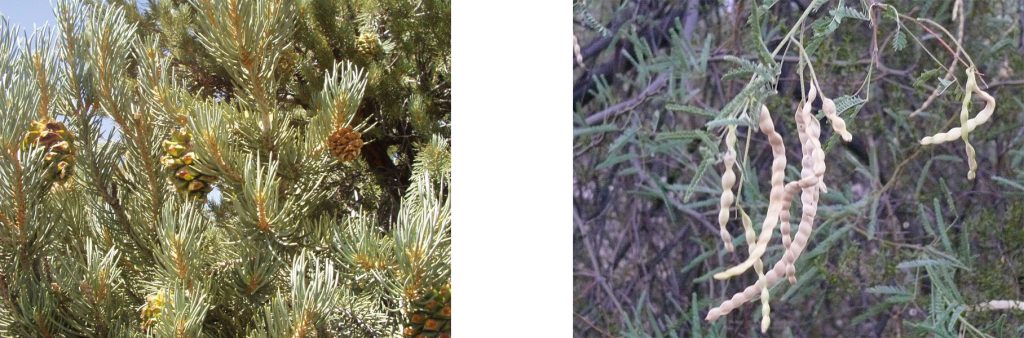
One result of this greater heat and aridity in Sedona is that it is dominated by different tree species than Prescott. The iconic tree of Prescott is the Ponderosa Pine (Pinus ponderosa), found within the city and its outskirts. The dominant trees in Sedona are species primarily found in hotter drier areas: several varieties of Juniper (Juniperus spp.) and Pinyon Pine (Pinus edulis), along with desert chaparral species like Velvet Mesquite (Prosopis velutina) and Catclaw acacia (Acacia gregii). Sedona also has excellent peaches and apricots which are missing in cooler Prescott where blossoms freeze in spring.
Many of the native plants present in Sedona like the Pinon Pine and Velvet Mesquite are actually traditional native food plants that have a high value as perennial staple crops that are adapted to the heat and drought of Arizona. This could be a silver lining from the Permaculture perspective, and could inform future plantings as the Ponderosa Pine forest retreats to higher elevations. There are Pinon Pine trees growing now in the Prescott basin, which could be propagated and planted on the hotter solar aspects. Velvet Mesquite seeds could be collected from the highest elevation they are found at and could also be planted on hotter aspects within the basin.
Both landscapes are fairly fire-prone and have experienced catastrophic fires in the vicinity in recent years. If the Ponderosa Pine forest is retreating to higher elevations, than tree mortality and wildfire are likely agents of that change. Controlled burning is currently practiced within the main fire sector outside of the town of Prescott, and that is a strategy for ecosystem management and fire mitigation that is encouraged from the Permaculture perspective.
- Dalton, M.M., K.D. Dello, L. Hawkins, P.W. Mote, and D.E. Rupp (2017) The Third Oregon Climate Assessment Report, Oregon Climate Change Research Institute, College of Earth, Ocean and Atmospheric Sciences, Oregon State University, Corvallis, OR. Print. ↵
- “August Weather 2017”. Accuweather. Web. https://www.accuweather.com/en/us/corvallis-or/97333/month/330142?monyr=8/01/2017 ↵
- “Köppen types calculated from data from PRISM Climate Group”. Oregon State University. Web. http://prism.oregonstate.edu ↵
- Dalton, M.M., K.D. Dello, L. Hawkins, P.W. Mote, and D.E. Rupp (2017) The Third Oregon Climate Assessment Report, Oregon Climate Change Research Institute, College of Earth, Ocean and Atmospheric Sciences, Oregon State University, Corvallis, OR. Print. ↵
- “What Climate Change Means for Arizona”. United States Environmental Protection Agency. Aug.2016. Web. Stolte, Daniel. “Arizona’s Future Climate: Temps Rising, Water Disappearing”. University Communications. 24 Mar. 2014. University of Arizona. Web. https://uanews.arizona.edu/story/arizona-s-future-climate-temps-rising-water-disappearing ↵
- Cowan, Emery. “Bleak Future for Warming Forest”. Trees. 11 Jan. 2015. Arizona Daily Sun. Web. http://azdailysun.com/news/local/bleak-future-for-warming-forest/article_21fe9e42-7585-5a84-b4d2-31d6c65c3ee7.html The Nature Conservancy’s “Climate Wizard” program “Climate Wizard”. The Nature Conservancy. Web. Dec. 2017 http://www.climatewizard.org/ puts heating for the Prescott region at around 6°F by 2080. ↵
- Magill, Bobby. “Global Warming is Fueling Arizona’s Monstrous Monsoon”. Climate Central. 4 Aug. 2017. Web. http://www.climatecentral.org/news/warming-fueling-arizonas-monstrous-monsoons-21679 ↵
- Cayan, D., M. Tyree, K. E. Kunkel, C. Castro, A. Gershunov, J. Barsugli, A. J. Ray, J. Overpeck, M. Anderson, J. Russell, B. Rajagopalan, I. Rangwala, and P. Duffy. 2013. “Future Climate: Projected Average.” In Assessment of Climate Change in the Southwest United States: A Report Prepared for the National Climate Assessment, edited by G. Garfin, A. Jardine, R. Merideth, M. Black, and S. LeRoy, 101–125. A report by the Southwest Climate Alliance. Washington, DC: Island Press. ↵
