5 Climate Change Projections
It is impossible to say exactly what will happen as the global average temperature continues to rise and humans continue to emit carbon and other greenhouse gases, decrease forest cover, increase urban heat islands, and persist in a myriad of other impacts on the biosphere. There are feedback loops that get triggered and complex consequences that are unforeseeable.
In spite of this fact, there are climate models and educated projections of specific impacts on different climate types that are created by scientists from all over the world based on data from weather measurements and inputted into complex computer models. In this next section we will examine some of the likely scenarios that are agreed upon by the majority of models.
The basic summary of the IPCC’s (Intergovernmental Panel on Climate Change) 2014 report says this about projected changes in the climate system:
Surface temperature is projected to rise over the 21st century under all assessed emission scenarios. It is very likely that heat waves will occur more often and last longer, and that extreme precipitation events will become more intense and frequent in may regions. The ocean will continue to warm and acidify, and global mean sea level to rise.[1]
General Predicted Trends
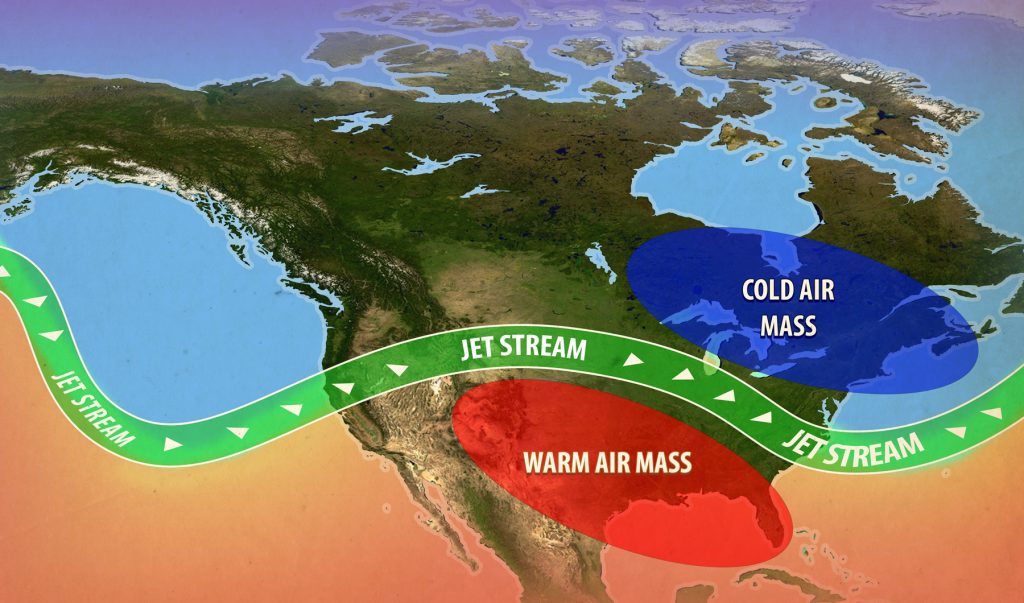
1) The Jetstream
As the Arctic and Antarctic heat up, they lose a volume of ice coverage that was formerly reflecting light and heat back out into the atmosphere. Dark ocean and land are left, which more readily absorbs heat. For this reason, the Arctic and Antarctic are heating at a faster rate than the equator.[2]
The temperature differential between the poles and the equator is what pressurizes the jetstreams. The jetstreams are air currents in our atmosphere that move bands of moisture around the planet. The warm equatorial air mass and cold polar air masses meet and the boundary of these air masses become the Polar jetstreams in both the northern and southern hemispheres. These jetstreams wiggle around the globe and move up and down latitudes with seasonal changes. As these jet streams wiggle, on the equatorial side it is warm, and on the polar side it is cold, so the position of the jetstream determines what type of weather is happening in a location. At the mid-latitudes, if one is on the equator side of the jetstream, it is hot. On the pole side it is cold. And within the jetstream it is precipitating.
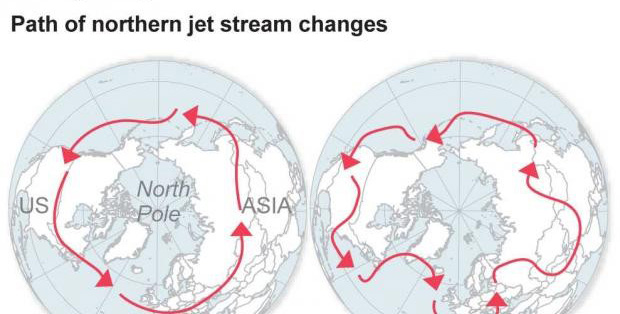
When the Arctic and Antarctic heat more than the equator (because of the reflective sea ice melt), then the temperature differential between poles and equator is reduced, and the jetstream becomes depressurized. So instead of wiggling around and moving weather through, it becomes stalled, and it’s undulating wave becomes deeper. When the jetstream is stalled and sluggish, weather persists for longer, whether it is rain, snow, heat, drought, or cold. Each one of these conditions becomes expanded. Longer dry spells, fiercer and slower moving storms, and more deeply penetrating cold snaps are all the results of a slowing jet stream.[3]
2) Wetter Tropics
Because of increased temperatures, there is projected to be more water evaporating into the atmosphere. This will lead to changes in precipitation, but they will not be uniform. For the wet tropics and especially the equatorial Pacific, precipitation will likely increase, and extreme precipitation events will very likely increase. This translates to the intensification of hurricanes, typhoons, and monsoon precipitation.[4]
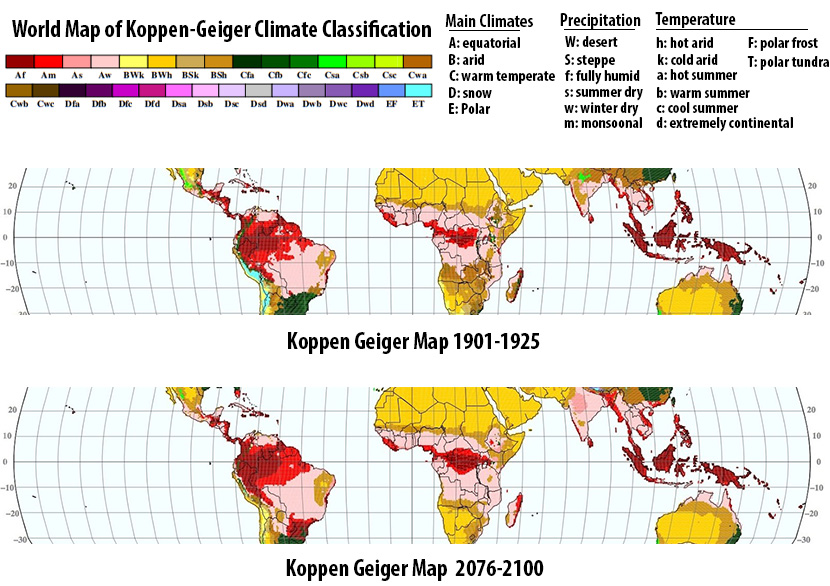
In looking at Koppen Geiger climate projections for 2076-2100 compared to 1901-1925 under the IPCC’s A1FI emissions scenario, there is a dramatic expansion of all equatorial humid climate types.
What will this actually look like? At the time of this writing, hurricane Harvey is dropping an all time record amount of precipitation for a single storm on the US mainland, a full 50” (1.27m) on Houston, Texas and the surrounding areas. This is one aspect of expanding tropical moisture and one that calls for extreme flood and storm surge resilience in equatorial communities.
3) Expanded Dry Areas
The IPCC states that there’s “robust evidence” with “high agreement” that the changes in surface and groundwater resources in dry subtropical regions will be reduced, and drought frequency will likely increase. That is coupled with more extreme heat events overall, punctuated by increasing extreme precipitation events when it does rain.[5]
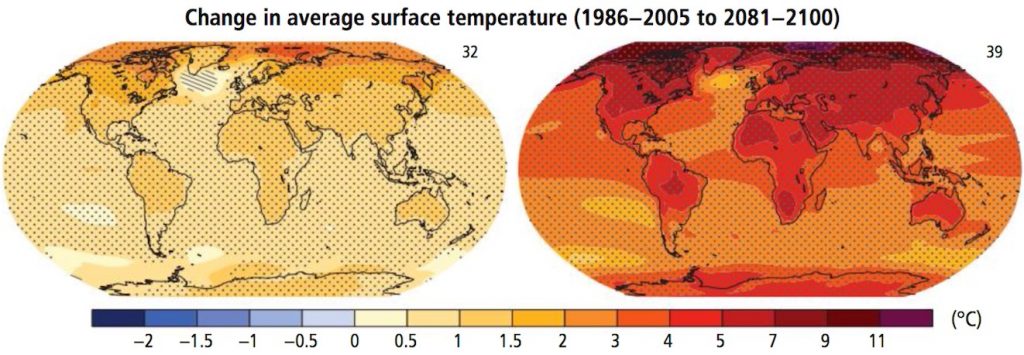
This diagram from that same IPCC report shows areas of projected decreased precipitation in the browns and tans. Also note the increased rainfall in other places, in both equatorial zones as well as higher latitudes.
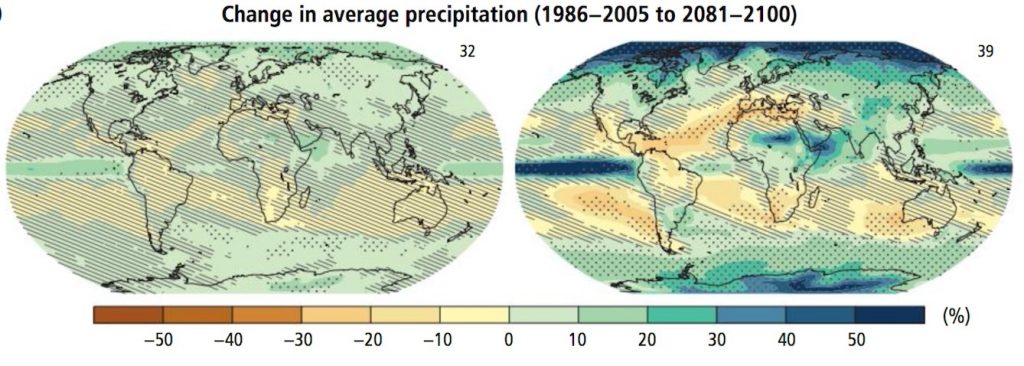
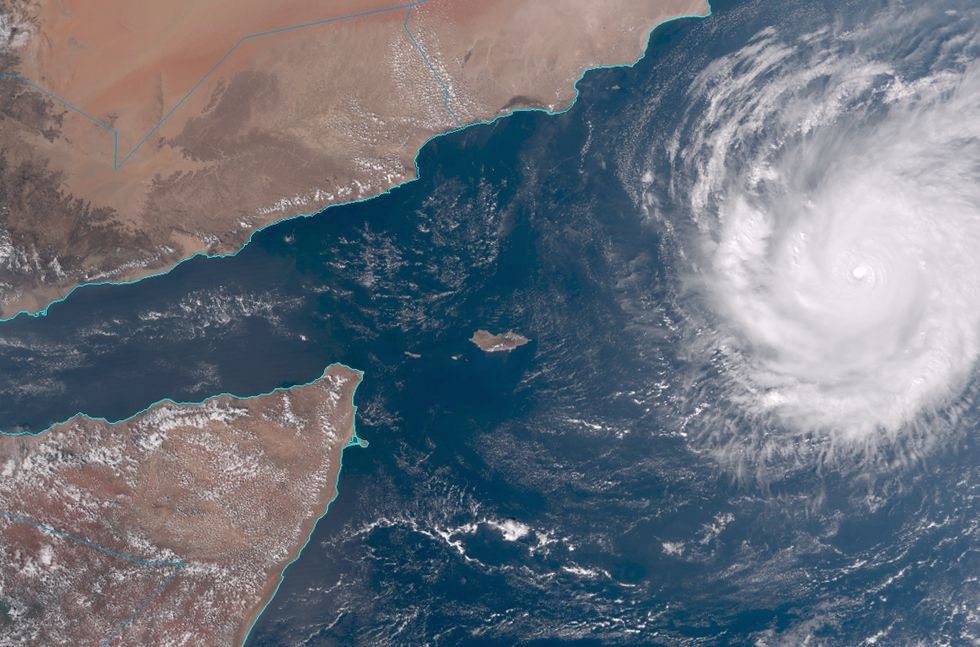
This is a very low resolution map without much detail, but notice projections of increased rainfall on the horn of Africa and the Southern Arabian Peninsula. I can’t help but wonder if the projection of increased rainfall over that extremely arid area will take the form of devastating storms like Tropical Cyclone Chapala that battered Yemen in 2015 and caused massive flooding throughout that country that is primarily in the Bwh hot desert climate class. Chapala was fueled by record warm water temperatures in the Indian Ocean and dumped several years worth of precipitation.
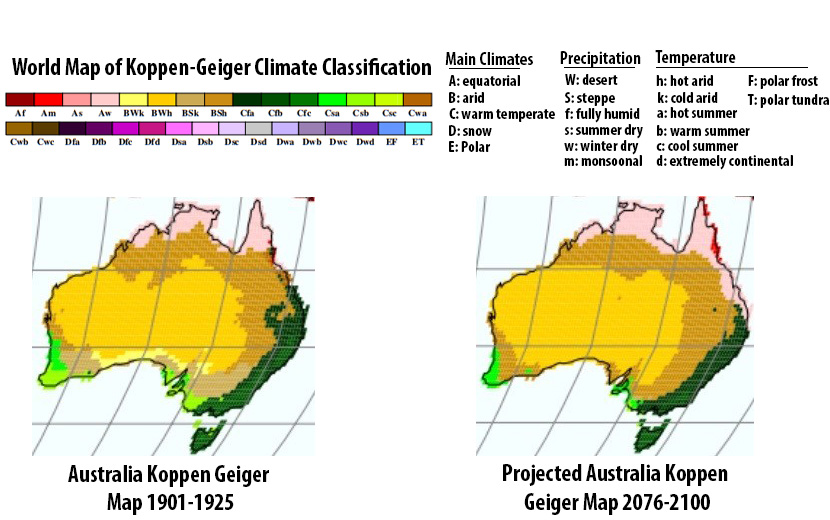
Either way, with hotter and drier deserts, their edges will naturally expand into the ecosystems at their edges. This map of Australia and the projected shift in climate types is illustrative of this fact. Notice the reduction of the Cfa, Csb, and Cfc climate types (temperate) along with the elimination of the Bwk and Bsk climate types (cold arid) and the expansion of Bwh and Bsh climate types (hot arid). There is however some expansion of Aw (equatorial winter dry) in the north and northeast, which means that region gets some benefit of the trend towards wetter tropics.
4) High Latitude Warming
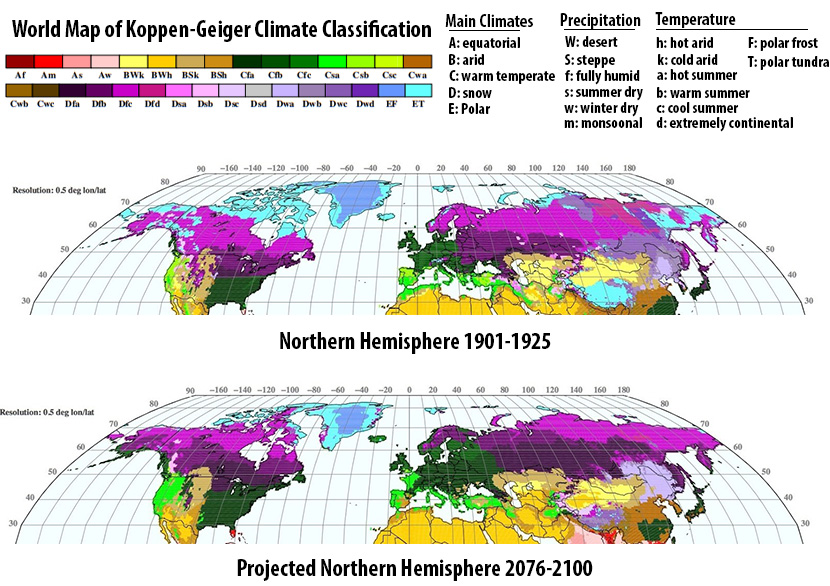
The higher latitude land masses in the northern hemisphere are projected to warm more than any other place on Earth. This will have a very visible impact on the landscape through the reduction of snow cover, sea ice, and the melting of permafrost. Satellites have already observed a reduction in sea ice concentrations, and some scenarios predict the Arctic to be ice free in summer by 2050[6].
Overall there will be a reduction of climate zones classified as boreal forest, snow climates and polar climates.[7]
Notice the retreat of the purple and blue colors which are the snow and polar climate types, and the amount of landmass affected by this shift. This will be a different world than it is right now by the end of the century.
In scientist James Lovelock (creator of the Gaia Hypothesis)’s 2006 book The Revenge of Gaia, he speculates that later on in the 21st century, human civilization will be confined to a narrow band of about 200 million people living around the Arctic Circle, as this will be the most expansive area of the temperate climate zone where broadscale agriculture will still be able to be practiced.[8]
That speculation does not match up with the pictured projected change of the Koppen-Geiger map, but it certainly makes one think. Already there is stiff competition for newly accessible fossil fuel resources around the Arctic because of melting ice.[9]
5) Altitudinal Shifts
Travelling up any mountain range or plateau reveals elevational boundaries between vegetative types. Ecosystems are stratified as one moves through elevation. With climate change projections, that stratification will change, and dramatically in some places.
The elevational shift of climate zones will not be consistent throughout the world because there are so many variations in the number of elevational zones present and at what elevation these zones are found at between various latitudes. [10]
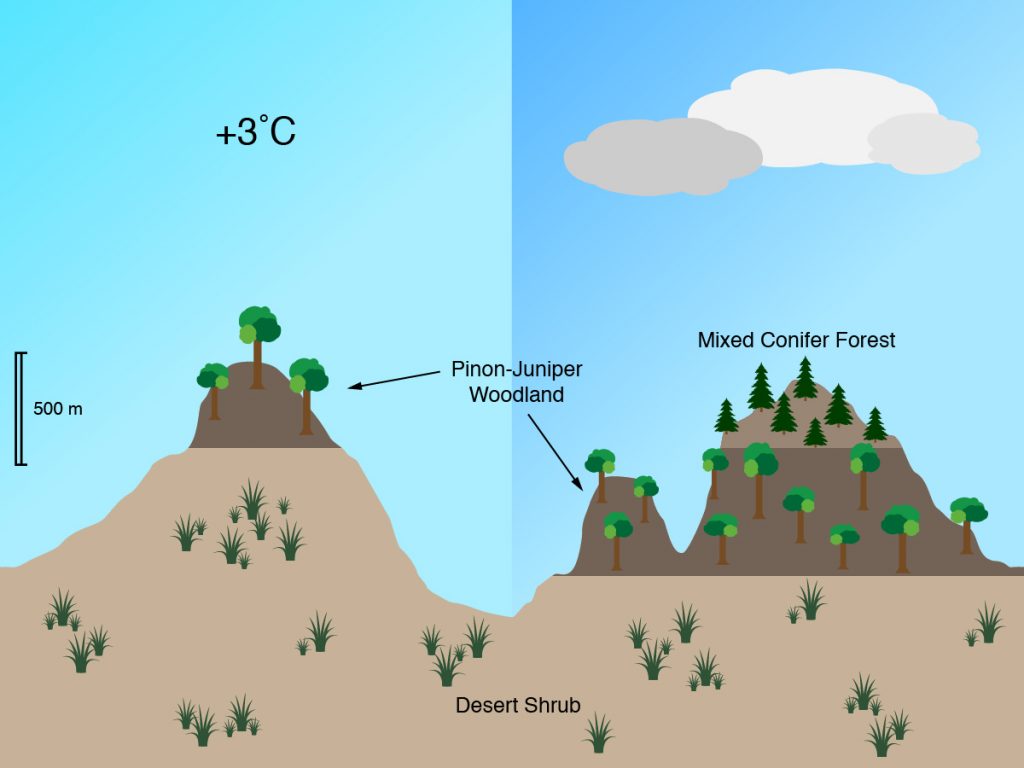
This diagram projects the change of the elevational boundaries of vegetative types in the Great Basin of Nevada, USA in a 3˚C warming scenario. We see an increase in desert scrub vegetation, a raising up of the Pinon-juniper woodland, and the elimination of the coniferous forest from the top in this diagram. One has to wonder how the ecosystem makes a transition like that when a catalyst like a wildfire could reset the whole ecosystem in a flash. The regrowth after the fire would reflect the new ecosystem and climate type.
This altitudinal shift in climate types explains a lot of the changes we see in Figure 15 in the mid latitudes. Notice especially the changes in the Himalayas and Tibetan Plateau. Permaculturists have a unique opportunity to adapt to elevational climate shifts by amplifying microclimates within complex elevational topography to include a maximum diversity of species that represent the greatest elevational range.
- IPCC, 2014: Climate Change 2014: Synthesis Report. Contribution of Working Groups i,ii and iii to the Fifth Assessment Report of the Intergovernmental Panel on Climate Change [Core Writing Team, R.K.Pachauri and L.A.Meyer 9eds.)]. IPCC, Geneva, Switzerland, 151 pp. ↵
- J. Richter-Menge, J. E. Overland, J. T. Mathis, and E. Osborne, Eds., 2017: Arctic Report Card 2017, http://www.arctic.noaa.gov/Report-Card. ↵
- Frances, Jennifer A, and Stephen J. Vavrus. Evidence for a wavier jet stream in response to rapid Arctic warming. Environmental Research Letters. 2015. Web. Jan. 2018 ↵
- IPCC, 2014: Climate Change 2014: Synthesis Report. Contribution of Working Groups i,ii and iii to the Fifth Assessment Report of the Intergovernmental Panel on Climate Change [Core Writing Team, R.K.Pachauri and L.A.Meyer 9eds.)]. IPCC, Geneva, Switzerland, 151 pp. Print. ↵
- IPCC, 2014: Climate Change 2014: Synthesis Report. Contribution of Working Groups i,ii and iii to the Fifth Assessment Report of the Intergovernmental Panel on Climate Change [Core Writing Team, R.K.Pachauri and L.A.Meyer 9eds.)]. IPCC, Geneva, Switzerland, 151 pp. ↵
- Hartmann, Dennis L., Global Physical Climatology. Elsevier, Amsterdam, The Netherlands, 2016. Pg 418 ↵
- Bailey, Robert G. “Ecosystem Geography: From Ecoregions to Sites” Springer, New York 2009, p.121 ↵
- Lovelock, James. The Revenge of Gaia. New York: Basic Books. Print. ↵
- Macalister, Terry. “The New Cold War”. The Guardian. Web. https://www.theguardian.com/environment/ng-interactive/2015/jun/16/drilling-oil-gas-arctic-alaska ↵
- Bailey, Robert G. “Ecosystem Geography: From Ecoregions to Sites” Springer, New York 2009, p.122 ↵
