1 Climate
Climate Definition
According to the Intergovernmental Panel on Climate Change:
Climate in a narrow sense is usually defined as the “average weather,” or more rigorously, as the statistical description in terms of the mean and variability of relevant quantities over a period ranging from months to thousands or millions of years. The classical period is 30 years, as defined by the World Meteorological Organization (WMO). These quantities are most often surface variables such as temperature, precipitation, and wind. Climate in a wider sense is the state, including a statistical description, of the climate system.[1]
In the permaculture design process every design is site specific and responds to it’s unique conditions. We have a lot of examples to observe and study that can help guide our design decisions based on what has worked for other people in similar climates. Identifying and assessing our climate type is the first major step to understanding what the major forces are that we will be responding to in our designs.
Resilience Definition
1) The capability of a strained body to recover its size and shape after deformation caused especially by compressive stress
2) An ability to recover from or adjust easily to misfortune or change [2]
Climate Resilience
Climate resilience is a term that begun to show up as a search term on Google and gained popularity starting around 2008. It is used by governments and scientists to encompass the dual process of both mitigating risk and adapting to changes. It can be seen as a shortening of the phrase “climate change resilience” and has various definitions. The following section will explore just a few of many out there:
“The capacity of a community, business, or natural environment to prevent, withstand, respond to, and recover from a disruption.”
- The National Oceanic and Atmospheric Administration’s “U.S. Climate Resilience toolkit” [3]
“Climate-resilient pathways include strategies, choices, and actions that reduce climate change and its impacts. They also include actions to ensure that effective risk management and adaptation can be implemented and sustained.”
- International Panel on Climate Change [4]
“Resilience is the capacity of a system, be it an individual, a forest, a city or an economy, to deal with change and continue to develop. It is about how humans and nature can use shocks and disturbances like a financial crisis or climate change to spur renewal and innovative thinking.”
- Stockholm Resilience Centre of Stockholm University in Sweden[5]
“Climate resilience can be generally defined as the capacity for a socio-ecological system to: (1) absorb stresses and maintain function in the face of external stresses imposed upon it by climate change and (2) adapt, reorganize, and evolve into more desirable configurations that improve the sustainability of the system, leaving it better prepared for future climate change impacts.”
- Wikipedia’s definition which is a conglomeration of several sources [6]
From the permaculture perspective, this text takes the approach that “the problem is the solution”, and focuses on identifying some of the tools and techniques that can help social-ecological systems to both forecast and innovate around climate change disturbances in a creative way. This will allow for the continual development of productive and ecologically harmonious human societal systems as a response. The interpretation of resilience being used in this text does not see Earth’s socio-ecological systems bouncing back to what they were prior to accelerated climate change, because the changes are already well under way and are set irreversibly in motion. Our definition sees resilience as evolution, where humanity adapts or transforms its relationships with socio-ecological systems in an inventive way in the face of massive disturbance. The results of this metamorphosis being a novel and healthy ecosystem.
Social Dimensions of Climate Change
The social dimensions of climate change is a topic that could fill many books unto itself, and there are many books and articles dedicated to the subject. It’s impossible to get into any detailed discussion about climate change’s impact without the human economic, social and political implications arising. How we respond now and in the future will determine the direction of humanity.
Some of the disruptions that are projected to affect people and nations are sea level rise, the intensification of oceanic-borne super storms, drought-induced crop failures, wildfire, stress and failure of water distribution systems, the migration of insect-borne diseases, and a myriad of other possible outcomes from climate destabilization. There will be changes in the geographic range that particular crops will thrive in. There will be extreme heat events in cities that will stress power grids and other critical infrastructure. There will be those working on mitigation and adaptation to these problems and those that deny and blame and point fingers.
The destabilizing effects of climate change are bound to have the greatest impacts on the poor who do not have the financial agency to relocate, survive a crop loss, rebuild a destroyed home, or turn on or up the air conditioner during an extreme heat wave. Countries like The Netherlands, who are mostly below sea level and have been designing around protection from sea levels since their inception have striking engineering feats like massive sea walls and floodgates to protect them from the sea. But these are costly pieces of infrastructure which will only ever go in to protect the most valuable real estate in the current capitalist world economy.

For many people, fleeing a bad situation and becoming refugees or staying where they are in abject poverty and substandard living conditions will be the only options. For some societies war will be the response to the stresses that climate instability will cause. There are dark roads that humanity has taken in the past in response to crises of survival, and these are pathways that we need to dedicate ourselves to avoiding.
This book aims to provide vital tools of foresight into what we are expecting to face so the design response can be inventive and insightful. Having the ability to decipher the patterns of landscape and climate and foresee the potential shifts provides pertinent information for an appropriate permaculture design response.
Although this book is primarily focussed on the geophysical mechanics of climate change, deciphering the projections, finding analogue climates, and learning the major design responses to the hazards we face, at its core the goal is to better prepare humanity so we can enter this disruptive phase with grace, foresight and intelligence. The permaculture ethics of “Earth Care, People Care, and Reinvestment of Surplus” into those ethics are served by this work. Please use these tools for the betterment of earth and it’s peoples.
Climate Analogue Introduction
Throughout the planet there is an exceptional diversity of climate zones and microclimates within those zones. Each ecoregion of the world is unique in so many ways. precipitation patterns, temperature, topography, vegetation, and global air and ocean circulation patterns, for example. That’s not even mentioning the incredibly diverse human elements including culture, politics, history and land use.
No two places are exactly alike in all of these regards, so the design patterns for a particular region will not look exactly the same anywhere else. Permaculture is about comprehensively site specific design. Each place has its unique confluence of factors, both human and ecological, which the design is a response to.
There are, however, a great many similarities between ecoregions. Many places do have similar rain and snowfall patterns, prevailing winds, elevation profiles, plant types, and average high and low temperatures. When you locate another place on the planet with very similar conditions to your own, there is a treasure trove of information to be gleaned. What are the thriving plants species present there? What are the traditional and indigenous agricultural and horticultural practices? What is the vernacular architecture? What animals are present? Are there species and practices that could be relocated or borrowed that would assist in the development of a permaculture system in another location?
The answers to the above questions are the reasons to locate your climate analogue. This is not just a practice to help design within your region as a permaculturist. It also helps when assessing and designing a site anywhere in the world. Maybe you are not familiar at all with the plant types and practices in Hangzhou, China, but perhaps you are familiar with plants and methods in Jacksonville, Florida, USA which has a similar latitude, elevation, and location on a continental eastern coast with the same potential for powerful hurricanes and typhoons. The knowledge possessed about Jacksonville is now directly transferable to working in Hangzhou.
Climate Analogue and Climate Change Analogue
Terminology within the permaculture field is often different from conventional terminology. The jargon around permaculture is actually a common critique. In the permaculture field a climate analogue (as described above) is a climate that is currently analogous to another. However, in more mainstream scholarly articles a climate analogue primarily refers to the future climate after climate change.
In this book I will be discussing both current and future climate analogues. So for clarification, I will refer to a current climate analogue as a Climate Analogue and a future climate analogue to a Climate Change Analogue.
Climate’s Ingredients
Robert G. Bailey put it simply in his seminal work Ecosystem Geography: “The spatial distribution of life forms today [is] a function of latitude, continental position, and elevation”.[7] These are the three primary geographic positions that determine climate, and in this next section we will be looking at different aspects and ways to articulate these three basic elements.
The Earth is an incredibly diverse place with many unique combinations of factors that shape the climate conditions of a particular location. Every place has dominant forces that are the most important conditions to design for in order to create a resilient and productive Permaculture system. As we go through each of the climate ingredients, you should be filling out the “Climate Analogue Worksheet” for your location, located in the appendix of this book. The information that you gather will be used later on to find climates that are analogous to your own. You can glean important knowledge about things that are working in other similar climatic locations to you in other parts of the world. From a practical design sense this could include plant and animal species to responsibly introduce[8], water management practices, architecture and building techniques, village and city design, wildfire mitigation, gardening and horticultural techniques, cultural practices, and other things. The possibilities are endless for what can be learned from studying an analogue climate.
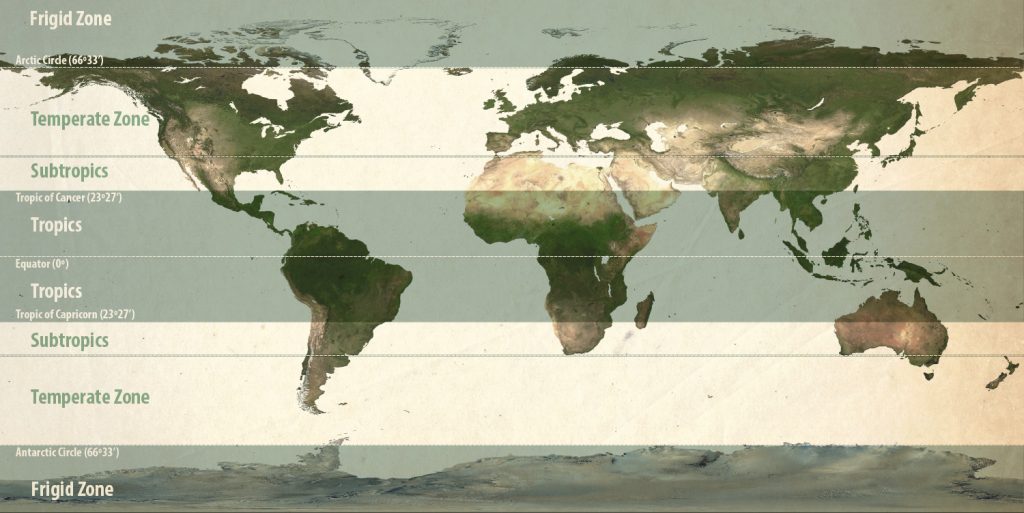
Latitude
Finding an analogous latitude is one of the important and first things to look at when identifying a climate analogue for your current location. There are the general climate types based on latitude which are the frigid, temperate, subtropical and tropical zones in both the Northern and Southern hemispheres (see diagram below). Each of those zones covers a wide expanse, and there are significant differences between the extreme ranges within each zone. For example Anchorage, Alaska and San Francisco, California are both located at sea level on the coast within the temperate climate zone but are 24 degrees latitude apart and have extremely different day-length variations and average daily mean temperatures over 20°F (10°C) apart.
Solar radiation, also known as insolation, is highest at the equator and decreases as one travels towards the poles. This variation is due to the amount of atmosphere which sunlight needs to pass through, and the angle with which it strikes the Earth’s surface. This angle becomes more acute during winter as one gets closer to the poles, and the sun passes through a lot of atmosphere when it is hitting the land at an acute angle. The closer a location is to the poles, the more day-length varies with the seasons and the colder average temperatures are when all other things are equal, like elevation and proximity to a water body. At the Arctic and Antarctic circles it is dark all day and night on the Winter Solstice, and is light all day and night on the Summer Solstice. At the equator day length does not vary throughout the year.
There is no solid rule for determining the temperature change as one changes latitude. If the Earth were a homogenous sphere with no topography or different materials or currents, there would be a consistent temperature gradient that would follow latitude and the decrease in solar radiation as one moves away from the equator. But topography is irregular. Mountain ranges are found at every latitude, running in every direction. There are oceans, ice caps, land masses, and currents that have different capacities to absorb, store, reflect, and transfer heat. Because of this and other factors that influence temperature in a particular region, it is very seldom that latitude is an isolated influence and temperature changes can be mapped solely on latitude changes.
On the coasts there are warm and cold ocean currents that affect temperature. Islands and peninsulas have temperatures moderated by surrounding ocean. The tip of the Southern Hemisphere is surrounded by ocean with substantial temperature moderation. The Gulf Stream current brings warm water that moderates the temperature in Western Europe. The interiors of continents have mountain ranges and elevation changes that alter temperature and the flow of warm and cold air masses. The Earth is just too irregular to have a solid rule about latitude’s effect on temperature. But there are general trends.
The tropics are located between the equator and tropics of Cancer and Capricorn at 23.5 degrees North and South. In the tropics latitude’s effect on temperature change is lowest because the angle of the sun does not change dramatically with the seasons. The angle stays mostly overhead and latitude is not a dominant factor in determining climate.
The subtropics compose a relatively narrow band roughly between 23.5 degrees and 34 degrees. The change in temperature due to latitude begins to increase here. But it is still not a major factor due to the narrow range of the subtropics.
The rate of change in the temperate zone becomes much more dramatic, which exists from around 34-66 degrees latitude. This dramatic rate only increases beyond the arctic circle where each degree change in latitude provides an exceptional difference in insolation and temperature.
In the Southern Hemisphere there is a lot more ocean, and this really moderates the rate of temperature change between latitudes. So there will be less change as one goes further South. Additionally, South America and Africa are shaped like points to the South, so the increasing amount of ocean surrounding them as one goes further South helps to moderate the temperature just as the latitude affects increase.
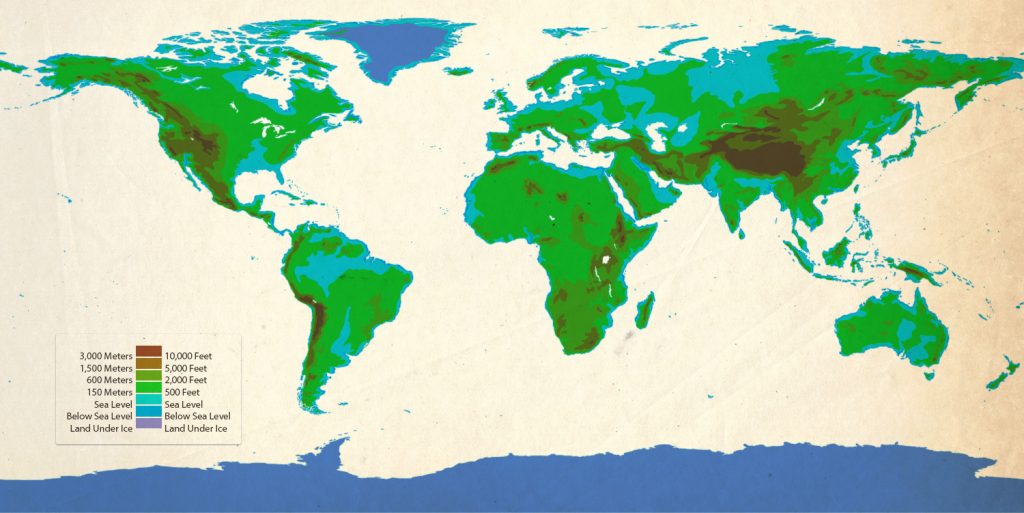
Elevation / Altitude
“We can describe the actual arrangement of ecosystems by the interplay of the principal of climatic regularity and surface irregularity.” – Robert G. Bailey[9]
Elevation serves a huge role in determining the climate of an area. If it were not for elevation changes, the world would have much more regular and consistent temperature gradients based on latitude. Changes in elevation are irregular and were formed by plate tectonics. Elevation seems to have no correspondence to latitude. There are interesting interactions between latitude and elevation that influence climate on a macro scale. For instance, on the west coasts of North and South America, the major mountain ranges are running in a north-south direction, placing them perpendicular to the atmospheric flows of the subtropical and polar jetstreams. This makes it easier to find an analogous climate because there is somewhat of a mirror image between these two continents on the West coasts.
The change in temperature is measurable with rise and fall in elevation because air expands and cools as it rises in altitude. The average rate of atmospheric cooling is 6.5 degrees C per kilometer. So as an easy “rule of thumb” way to calculate the temperature effects of altitude change this translates to roughly 2 degrees C per 300 meters or about 3.5 degrees F per 1000 ft.[10]
This means that where I lived in the high desert town of Prescott in the Arizona Mountains at an elevation of 5300’ (1600m) and a latitude of 35°N, the mean annual temperature is just about the same as that of The Dalles, Oregon located at 700’ (215m) and at a latitude of 45°N. Higher altitudes at lower latitudes equal lower altitudes at higher latitudes. There are many resources to determine elevation. Below is a world map of elevations. Determining a location’s elevation is a key component to finding a climate analogue.
It’s important to remember that there are also other topographic influences that can play a big role in temperature. For example, cold air drainage in a canyon or bottomland where a valley bottom can be cooler than the temperature at a higher elevation. It’s important not to always assume that higher elevation means it is cooler. All other factors need to be examined as well.
It’s also important not to assume that just because two areas have the same elevations and the same average temperatures, that they are analogous climates. If these areas are at different latitudes, then they may have very different solar declination, day length, seasonal variation, and rain and snowfall patterns.
Proximity to Large Water Body
Proximity to large water bodies is another major distinction between climate types, and divides them into Oceanic and Continental climates. As has been discussed already, large bodies of water have a temperature moderating effect; they keep coastal areas cooler in summer with ocean breezes and thermal storage of a large body of water, and warmer in winter without the same freezing temperatures that can be found in the continental interior at the same latitude.
Temperature has the ability to fluctuate much more over land masses that can heat and cool much more quickly than large volumes of water. Continents with a large interior land area also have the capacity to convey polar air masses deep down towards the equator. A polar air mass cannot come down over the ocean like it can over land. So the farther away that an area is from the ocean, the more capacity there is for a cold air intrusion from the poles during winter.
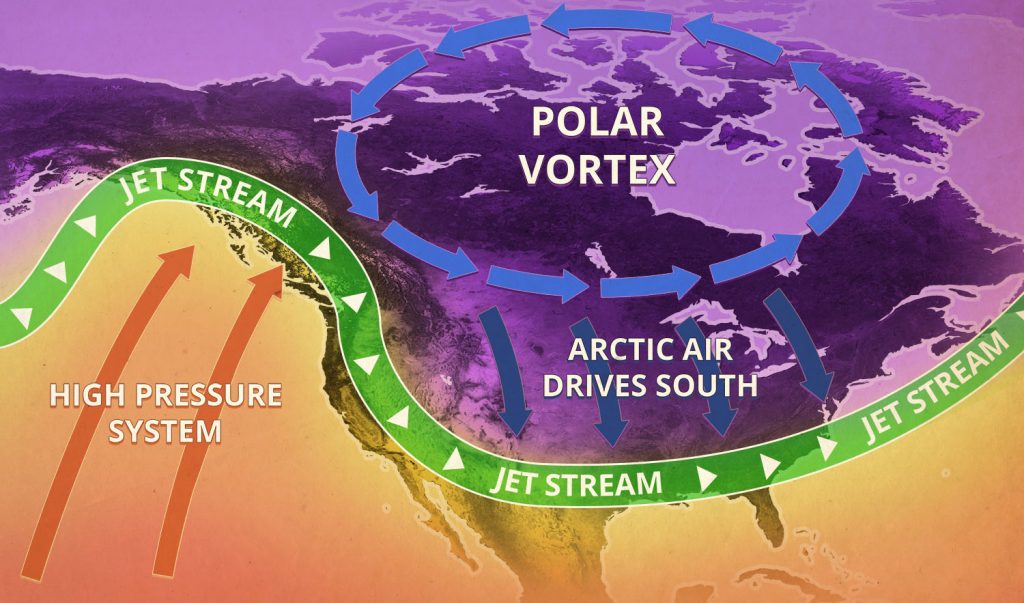
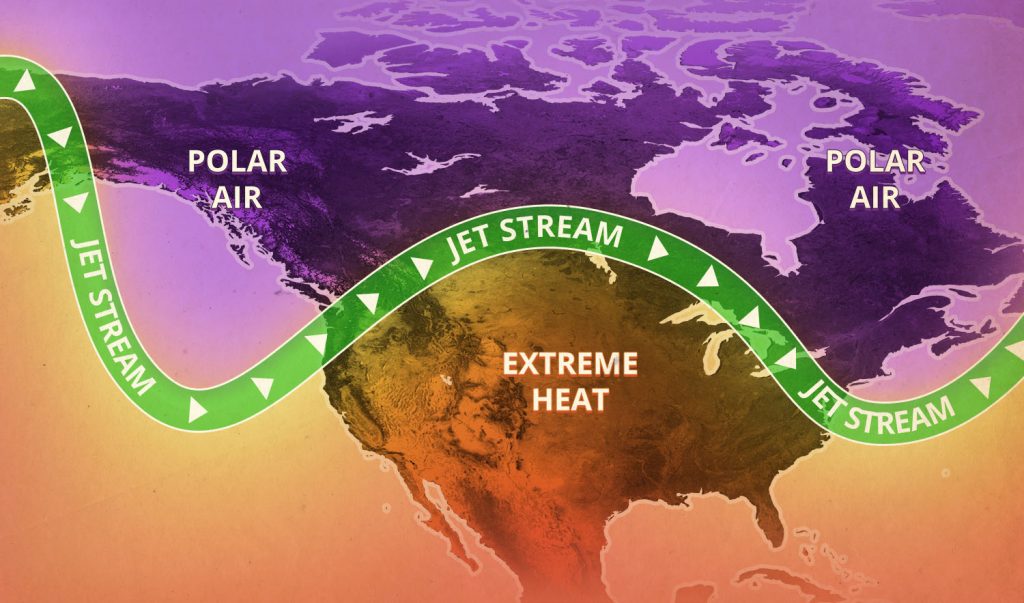
Not only does cold air find its way toward the equator over large landmasses, but heat can build up in interior deserts without the cooling effect of the ocean. A high pressure system can build a heat dome that can be sustained for a long time in the continental interior. It is only when that heat dome gets so big that it can push out to the coasts that there is a coastal heat wave in the oceanic climate zones.
The effects of the climate and weather patterns on a site can be dramatically influenced by it’s proximity to the moderating temperature and humidity effects of a large water body. When assessing a site’s climate conditions and finding it’s analogue, it is important to note it’s proximity to a large water body or distance into the interior of a continental land mass and check that any analogue has a similar position relative to these factors.
Precipitation Amount
The volume of precipitation is one thing that distinguishes one climate zone from another and has very obvious effects in vegetation type and size, streamflow, hydrology, humidity, and animal species. Precipitation includes both rain and snowfall.
Precipitation is not a factor that can be looked at in isolation because temperature plays such a big role in how the precipitation moves through the landscape system, whether as rain or snow, during a growing season or during dormancy. So directly along with the precipitation volume is the precipitation seasonality for determining the major aspects that define a climate and its analogue.
Precipitation Seasonality
The timing of precipitation is one of the main defining elements of climate, and represents one of the major components of many climate classification systems. Whether or not a climate zone receives consistent rainfall determines whether or not there is a dry season. The presence or lack of a dry season has a great influence on vegetation types, the surface flow of water, and subsurface hydrology.
If there are wet and dry times of the year, then the timing in relation to temperature is a defining feature. In the wet-dry tropics, the variation in seasons is defined by the seasonality of precipitation. In temperate climates with a wet and dry season, whether the rain comes during the warm or hot growing season or the cool or cold winter season dictates what plant and animal species are present.
Allan Savory in his Holistic Management system created a scale where the “brittleness” of a landscape is based on the seasonal humidity and its effect on the cycles of decay and decomposition. So the rates and processes of decay are another really important ecological function that is affected greatly by the seasonality of precipitation, and can be a factor that is considered and designed around in land management and stewardship. [11]
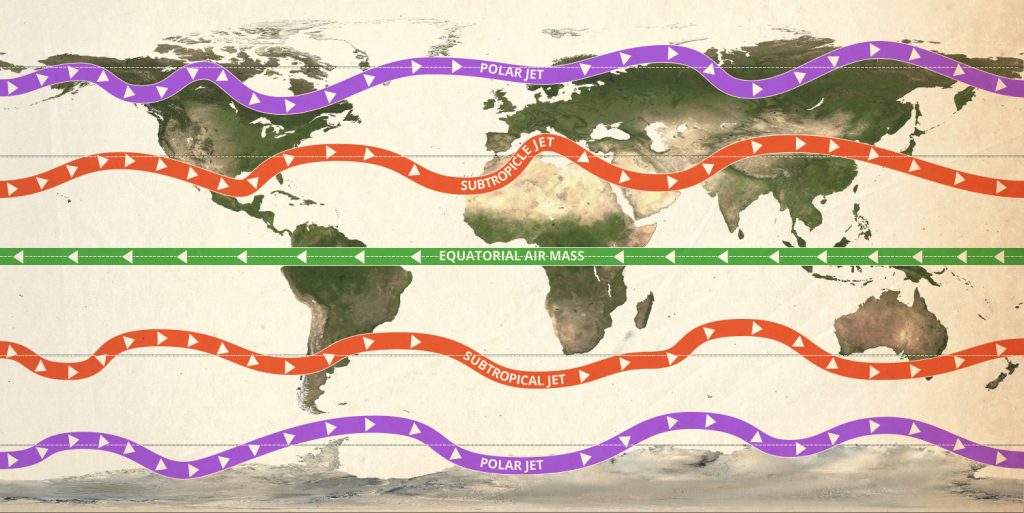
Global Air Circulation and Storm Systems
The global circulation patterns are the agents of weather and provides the climatic engine which determines the seasonality of precipitation, the strength and direction of winds, and the exchange of air masses between the poles and equator through cold air intrusions. The mechanism of this circulation involves the rising and falling of air masses called Hadley cells, which cause the Subtropical and Polar Jet Streams to wiggle their way around the planet, with cold air masses towards the poles and warm air masses towards the equator. Within these meandering jet streams are bands of precipitation moving around the planet.
Tropical storm systems come up from the Equator and bring monsoons, typhoons and hurricanes to bear upon land masses. These storms are derived within the warm regions of the Equator and move warm moist air masses to become entrained into the jet streams, pulling warm air out of the Equator towards the poles, keeping the temperature of the planet in balance.
Understanding the normal and extreme patterns of these circulatory systems is a big part of understanding the factors that shape regional climate. Literacy in the global air circulation system is a great asset to understanding the roots of climate zones.
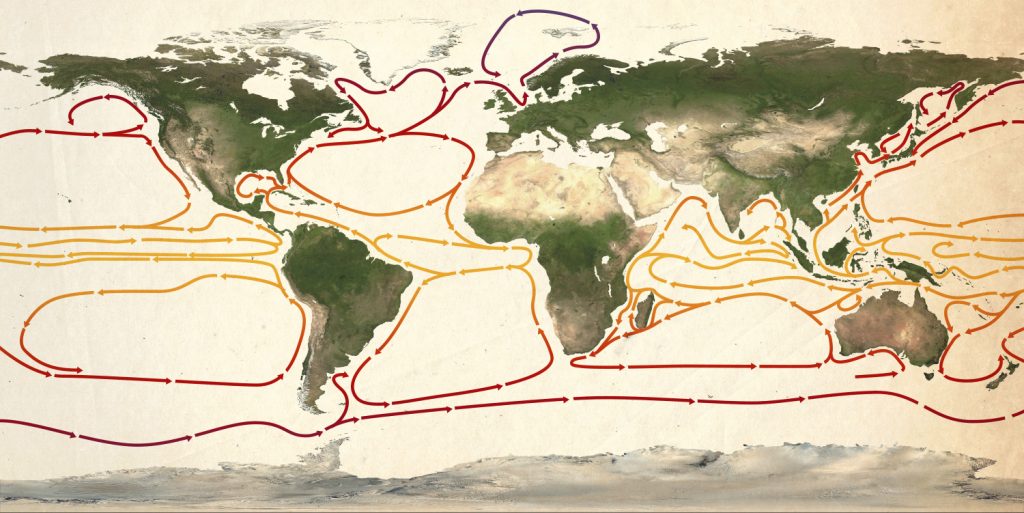
Ocean Currents
The oceans have consistent currents that alter the climate on coastal areas and land masses. One well-known ocean current is the North Atlantic Current that brings warm water from the tropical Gulf of Mexico up along the Eastern Seaboard of the United States and across the Atlantic over to the UK and Western Europe. This causes the temperature in the UK and Western Europe to be milder in winter compared to coastlines of the same latitude that have cold ocean currents, like the West Coast of North America. Ocean currents play a large role in determining the climate of some areas, so it’s an important thing to be aware of.
Geographic Features
Where a region sits within the topography of the landscape has a major climatic influence for a number of reasons. On every topographic feature like a mountain range or hills there is a windward and leeward side. The windward side is facing the direction of the prevailing winds which carry storm systems from the oceans over continental land masses. As air rises up against mountain ranges, it cools and water vapor condenses into precipitation. The windward side therefore is the wetter side and usually has a very different plant composition. This change in atmospheric conditions based on the change in elevation is called the orographic effect.
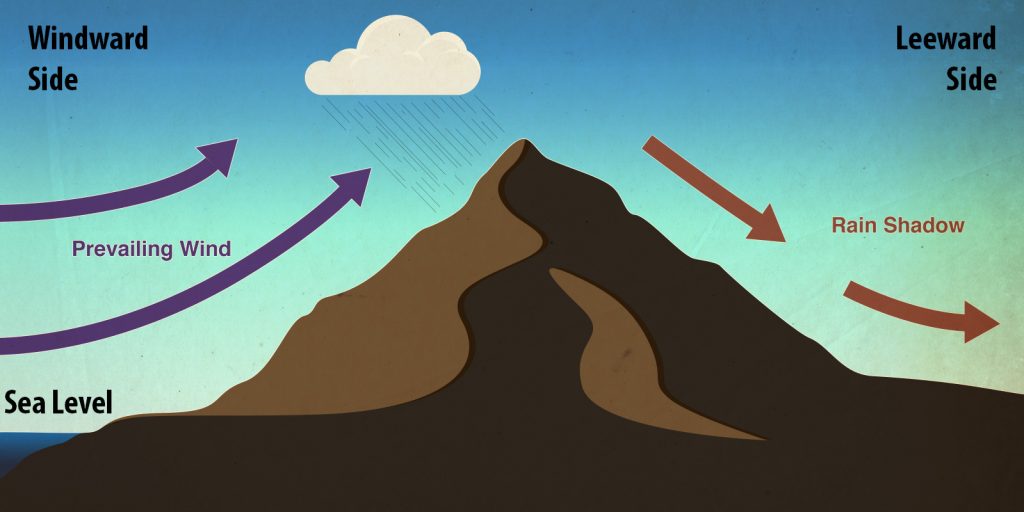
As an air mass moves onto a continent from the ocean and hits a mountain range, warm air rises, cools, and condenses, and dropping out precipitation. This creates a rainshadow on the other side, as air descends, warms, and loses it’s capacity to hold water vapor. This same orographic effect continues into the interior of the continent for each mountain range that runs perpendicular to the direction of prevailing storms. [format] Arthur, Michael, and Demian Saffer. “The Orographic Effect.” Integrate: Interdisciplinary Teaching About Earth for a Sustainable Future. Web. Pennsylvania State University. Mar. 2018 [/format]
Another geographic feature to note are major rivers that create their own climate zones within their proximity due to the deposited soils, moisture content, and moderated temperatures of a large mass of water. The delta of a river in particular has very distinct ecological conditions, with the edge between salt and freshwater, containing high levels of nutrients as well as specific types of plant, animal and aquatic species.
Landscape Positioning & Microclimate
The more detailed we examine a particular region, and then a specific site within that region, it becomes a tapestry of different microclimates that have their own climatic conditions. For example, whether a slope is facing North, South, East or West determines how the sun hits that slope throughout the year, which has a big effect on temperature and moisture. The compass direction that a slope faces is called ‘aspect’.
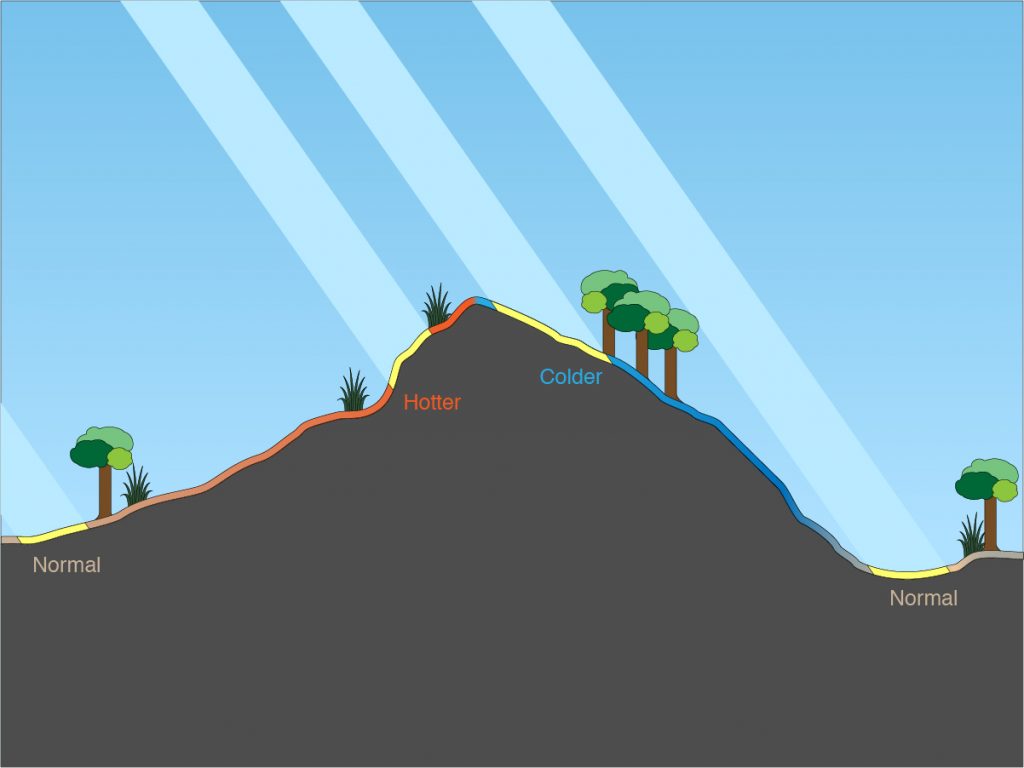
Whether a slope is steep or gentle impacts the angle that the sun hits it in different seasons and affects the amount of solar radiation it absorbs. Vegetation can be completely different on the north facing or south facing slopes of a valley because of the solar radiation and the subsequent moisture retention of that slope and evapotranspiration of the plants.
If a location is in a canyon or valley surrounded by elevational features like mountains or plateaus, then cold air can drain down and create a frost pocket in the lowlands. A valley bottom position has multiple elements flowing down into it: frost, water, and soil deposition. Diurnal winds also provide an updraft through mountain valleys during hot days.
The mid-slope of a region is often a “banana belt”, where cold air drains down and an area remains warmer above the frost pocket. A banana belt is any segment of a region that has warmer weather than the surrounding region, and the positioning within the greater geographic landscape is often the cause.
Evapotransporation rates
Evapotransporation rates have a large influence on climate, and when the evaporation of moisture from the air and transpiration of water from plants (evapotranspiration) exceeds rainfall in an area, that is the definition of a desert. The evapotransporation rate is not an element that will be calibrated as a stand-alone number in a climate classification survey, but is a component in systems that look at the moisture index, which assesses evaporation rates, temperature, and day length.
The rate at which a plant and soil lose water to the atmosphere is a critical factor in the overall moisture level of an area which affects the types of plant and animal species living there..
Temperature
Temperature is the most basic measure of a climate along with rainfall and seasonality of precipitation. Many of the previous climate ingredients like proximity to the ocean, landscape positioning, ocean currents, elevation and latitude can all be summed up with the simple average yearly temperature of a place.
Temperature determines evaporation rates and plant and animal species. Temperature does not necessarily give one a clue about latitude, elevation, or the seasonal fluctuations of a place. On the top of Mount Kilimanjaro in Kenya which sits on the equator there are arctic conditions because of the great height.
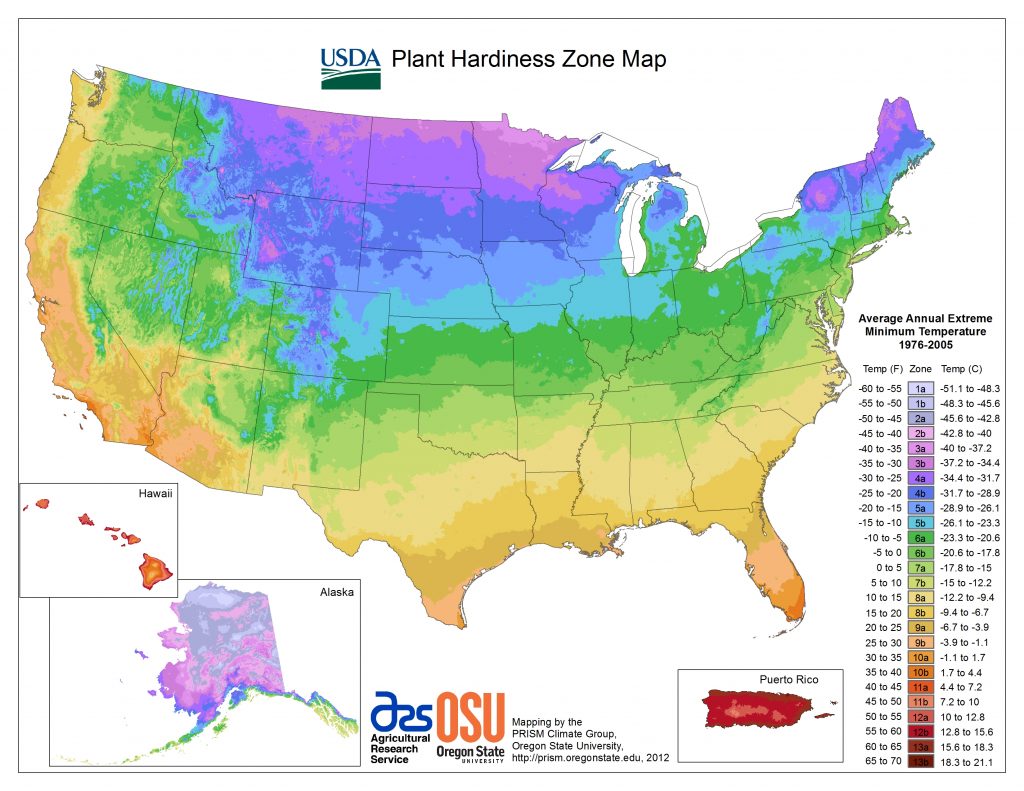
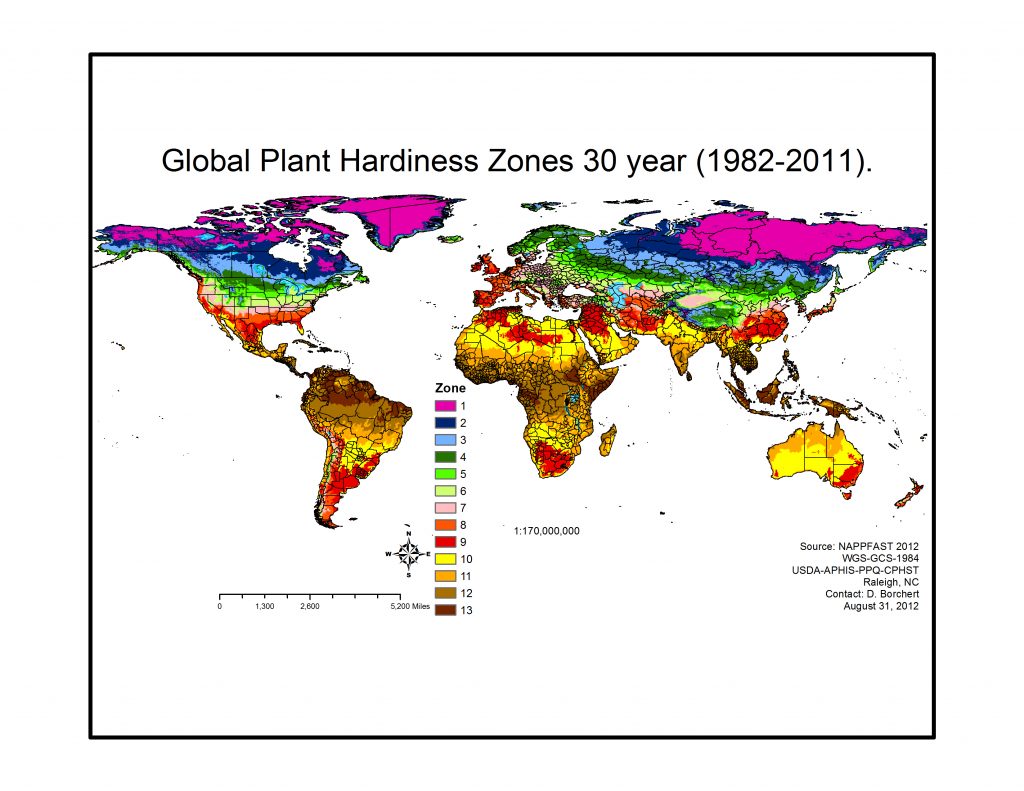
Plant Hardiness
An important climate classification system that is commonly used by gardeners and agriculturists the world over are plant hardiness zones. Plant hardiness zones look strictly at the average annual extreme minimum temperature.
Interestingly, the USDA Plant Hardiness Zone Map was updated in 2012 and the new map is generally one 5-degree Fahrenheit half-zone warmer than the previous map throughout much of the United States. This is attributed to more sophisticated temperature measurement technology and also the fact that the temperature has risen in recent years.[12]
- “Glossary”. Working Group 1: The Scientific Basis. Intergovernmental Panel on Climate Change. Web. Dec. 2017. https://www.ipcc.ch/ipccreports/tar/wg1/518.htm ↵
- “Definition of Resilience”. Merriam-Webster. Web. Mar.2018 https://www.merriam-webster.com/dictionary/resilience ↵
- “Glossary”. U.S Climate Resilience Toolkit. Web. Mar.2018. https://toolkit.climate.gov/content/glossary ↵
- Denton, F., T.J.Wilbanks, A.C. Abeysinghe, I. Burton, Q. Gao, M.C. Lemos, T. Masui, K.L. O’Brien, and K.Warner. “Climate-resilient pathways: adaptation, mitigation, and sustainable development. In: Climate Change 2014: Impacts, Adaptation, and Vulnerability. Part A: Global and Sectoral Aspects. Contribution of Working Group II to the Fifth Assessment Report of the Intergovernmental Panel on Climate Change” [Field, C.B., V.R. Barros, D.J. Dokken, K.J. Mach, M.D. Mastrandrea, T.E. Bilir, M. Chatterjee, K.L. Ebi, Y.O. Estrada, R.C. Genova, B. Girma, E.S. Kissel, A.N. Levy, S. MacCracken, P.R. Mastrandrea, and L.L.White (eds.)]. Cambridge University Press, Cambridge, United Kingdom and New York, NY, USA, Print. ↵
- “What is resilience? An Introduction to a Popular Yet Often Misunderstood Topic”. Stockholm Resilience Centre. Web. Stockholm University. Mar. 2018.http://www.stockholmresilience.org/research/research-news/2015-02-19-what-is-resilience.html ↵
- “Climate Resilience”. Wikipedia. Web. Mar.2018. https://en.wikipedia.org/wiki/Climate_resilience#Definition_of_climate_resilience ↵
- Bailey, Robert G. Ecosystem Geography. New York: Springer, 1996. Print. ↵
- Observe codes of conduct to reduce the threat of invasive species introduction. Chart from this page: https://www.bgci.org/resources/article/0698 ↵
- Bailey, Robert G. Ecosystem Geography. New York: Springer, 1996. Print. ↵
- Dasch, E. Julius. “Macmillan Encyclopedia of Earth Sciences”Simon and Schuster Macmillan, 1996 ↵
- Ward, Bruce. "The Implications of Brittleness." Bruce Ward Legacy Trust. Web. Mar. 2018. http://www.holisticresults.com.au/green-participant-area/biodiversity-supports-everything/1-3-1-the-implications-of-brittleness ↵
- Kaplan, Kim. USDA Unveils New Plant Hardiness Zone Map. Agricultural Research Service 25 Jan. 2012. United States Department of Agriculture. Web. Jan. 2018 ↵
