Main Body
Micronutrients Overview & Dietary Reference Intakes (DRIs)
Micronutrients consist of vitamins and minerals. In this chapter, an overview of vitamins and minerals will be presented followed by a description of the dietary reference intakes (DRIs), which are used as benchmarks of micronutrient intake.
Sections:
8.1 Vitamins
8.2 Minerals
8.3 Covering Vitamins & Minerals
8.4 Dietary Reference Intakes (DRIs)
8.1 Vitamins
The name vitamin comes from Casimir Funk, who in 1912 thought vital amines (NH3) were responsible for preventing what we know now are vitamin deficiencies. He coined the term vitamines to describe these compounds. Eventually it was discovered that these compounds were not amines and the ‘e’ was dropped to form vitamins1.
Vitamins are classified as either fat-soluble or water-soluble. The fat-soluble vitamins are:
Vitamin A
Vitamin D
Vitamin E
Vitamin K
The water-soluble vitamins are vitamin C and the B vitamins, which are shown in the table below.
Table 8.11 The B vitamins and their common names
| Vitamin | Common Name |
| B1 | Thiamin |
| B2 | Riboflavin |
| B3 | Niacin |
| B5 | Pantothenic Acid |
| B6* | Pyridoxine |
| B7 | Biotin |
| B9 | Folate |
| B12* | Cobalamin |
*Normally used instead of common names
A common question from students about B vitamins is: “Why are there so many B vitamins? It is not like they ran out of letters in the alphabet to name them.”
Before they even knew that vitamins existed, a scientist named E.V. McCollum recognized that a deficiency in what he called ‘fat-soluble factor A’ resulted in severe ophthalmia (inflammation of the eye). In addition, a deficiency in ‘water-soluble factor B’ resulted in beriberi (a deficiency discussed more later)1.
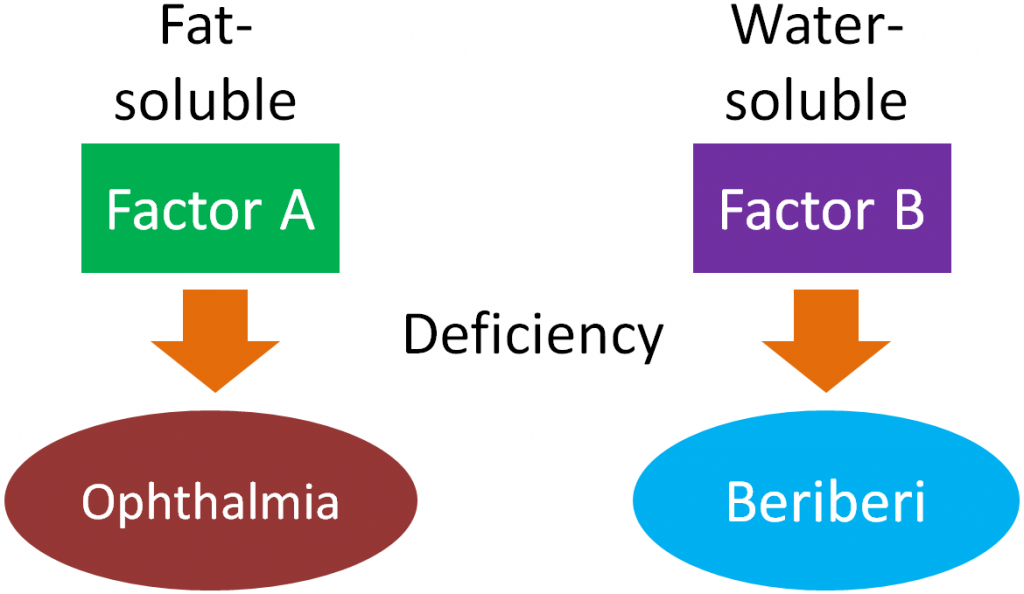
Factor A is what we now know as vitamin A. However, researchers soon realized that factor B actually consisted of two factors that they termed B1 and B2. Then they realized that there are multiple components in B2, and they began identifying the wide array of B vitamins that we know today1.
You might be thinking “but the numbers on the B vitamins still do not add up.” You are right, vitamins B4, B8, B10, and B11 were discovered and then removed leaving us with the B vitamins shown in Table 8.11.
Relative to other scientific milestones, the discovery of vitamins is a fairly recent occurrence, as shown in the table below.
Table 8.12 Vitamin, year proposed, isolated, structure determined, and synthesis achieved up to 19441
| Vitamin | Year Proposed | Isolated | Structure Determined | Synthesis Achieved |
| Thiamin | 1901 | 1926 | 1936 | 1936 |
| Vitamin C | 1907 | 1926 | 1932 | 1933 |
| Vitamin A | 1915 | 1939 | 1942 | – |
| Vitamin D | 1919 | 1931 | 1932 | 1932 |
| Vitamin E | 1922 | 1936 | 1938 | 1938 |
| Niacin | 1926 | 1937 | 1937 | 1867* |
| Biotin | 1926 | 1939 | 1942 | 1943 |
| Vitamin K | 1929 | 1939 | 1942 | 1943 |
| Pantothenic Acid | 1931 | 1939 | 1939 | 1940 |
| Folate | 1931 | 1939 | – | – |
| Riboflavin | 1933 | 1933 | 1934 | 1935 |
| Vitamin B6 | 1934 | 1936 | 1938 | 1939 |
* Was established long before it was known to be a vitamin
A number of B vitamins serve as cofactors/coenzymes. The following table lists the cofactors/coenzymes formed from B vitamins that will be discussed in more detail in the following subsections.
Table 8.13 Cofactors/coenzymes formed from B vitamins
| Vitamin | Cofactors/Coenzymes |
| Thiamin | Thiamin Pyrophosphate (TPP) |
| Riboflavin | Flavin Adenine Dinucleotide (FAD),
Flavin Mononucleotide (FMN) |
| Niacin | Nicotine Adenine Dinucleotide (NAD),
Nicotine Adenine Dinucleotide Phosphate (NADP) |
| Pantothenic Acid | Coenzyme A |
| Vitamin B6 | Pyridoxal Phosphate (PLP) |
| Biotin | – |
| Folate | Tetrahydrofolate (THF) |
| Vitamin B12 | Adenosylcobalamin, Methylcobalamin |
References & Links
- Carpenter K. (2003) A short history of nutritional science: Part 3 (1912-1944). J Nutr 133(10): 3023-3032
8.2 Minerals
Minerals are elements that are essential for body functions that can’t be synthesized in the body. Some people refer to them as elements instead of minerals, and the names can be used interchangeably. However, in the nutrition community, they are more commonly referred to as minerals. Minerals can be divided up into three different categories:
Macrominerals
Trace Minerals (aka Microminerals)
Ultratrace Minerals
There is not an exact, agreed on definition for how the different categories are defined, but in general they are defined by the amount required and found in the body such that:
Macrominerals > Trace Minerals > Ultratrace Minerals
Table 8.21 Alphabetical listing of the 20 minerals and their chemical symbols
| Macrominerals | Trace Minerals | Ultratrace Minerals |
| Calcium (Ca) | Chromium (Cr) | Arsenic (As) |
| Chloride (Cl)a | Copper (Cu) | Boron (B) |
| Magnesium (Mg) | Fluoride (F) | Nickel (Ni) |
| Phosphorus (P)b | Iodine (I) | Silicon (Si) |
| Potassium (K) | Iron (Fe) | Vanadium (V) |
| Sodium (Na) | Manganese (Mn) | |
| Molybdenum (Mo) | ||
| Selenium (Se) | ||
| Zinc (Zn) |
a Chlorine ion, Cl-
b Phosphate in body, PO4
The table below shows the estimated amount of the macrominerals, trace minerals, and ultratrace minerals found in the body.
Table 8.22 Amount of different minerals found in the body1
Macrominerals Trace Minerals Ultratrace Minerals
| Calcium | 1200 g | Iron | 4 g | Silicon | 1 g |
| Phosphorus | 780 g | Fluoride | 3-6 g | Boron | 17 mg |
| Potassium | 110-140 g | Zinc | 2.3 g | Nickel | 15 mg |
| Sodium | 100 g | Copper | 70 mg | Arsenic | 7 mg |
| Chloride | 95 g | Selenium | 14 mg | Vanadium | 0.1 mg |
| Magnesium | 25 g | Manganese | 12 mg | ||
| Iodine | 10-20 mg | ||||
| Molybdenum | 5 mg | ||||
| Chromium | 1-2 mg |
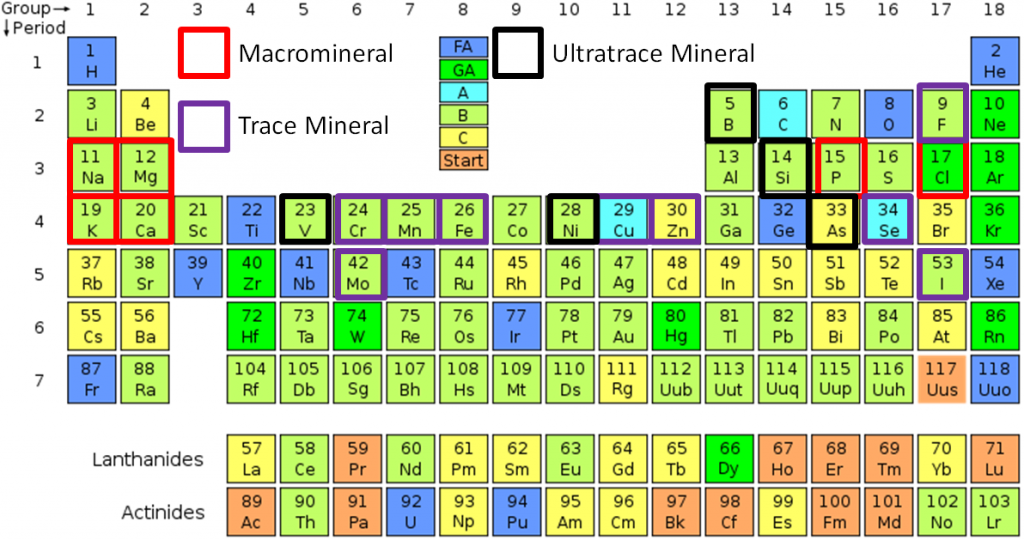
Minerals are elements. The figure below shows the distribution of minerals in the periodic table, which you should be familiar with from your chemistry education.
References & Links
- Emsley, John. Nature’s building blocks : an A-Z guide to the elements. 2001. Oxford, Oxford University Press.
- http://en.wikipedia.org/wiki/File:Periodic_Table_by_Quality.SVG
8.3 Vitamins & Minerals Functional Categories
There are two common ways to teach about vitamins and minerals in nutrition classes. The traditional way is to start with fat-soluble vitamins and go down through the vitamins alphabetically (i.e. vitamin A, vitamin D, vitamin E, vitamin K). However, this method leads students to learn about vitamins and minerals more individually instead of how they work together. For instance, it makes sense to cover calcium with vitamin D, and iron with copper and zinc. We are going to cover vitamins and minerals based on their function rather than covering them by whether they are a water-soluble vitamin or trace mineral. The hope is that you will gain a more integrative understanding of vitamins and minerals from this approach.
Here are the different functional categories that we are going to cover. Notice that some micronutrients fit into more than one functional category. Each vitamin and mineral will be covered only in one section, with some mention of its overlap in other section(s) in certain cases.
| Antioxidants | Macronutrient Metabolism | 1-Carbon Metabolism | Blood | Bones & Teeth | Electrolytes |
| Vitamin E | Thiamin | Folate | Vitamin K | Vitamin D | Sodium |
| Vitamin C | Riboflavin | Vitamin B12 | Iron | Calcium | Potassium |
| Selenium | Niacin | Vitamin B6 | Vitamin B6 | Vitamin K | Chloride |
| Iron | Pantothenic Acid | Folate | Phosphorus | Phosphorus | |
| Copper | Vitamin B6 | Vitamin B12 | Magnesium | Magnesium | |
| Zinc | Biotin | Copper | Fluoride | ||
| Manganese | Vitamin B12 | Calcium | Vitamin A | ||
| Riboflavin | Vitamin C | Iron | |||
| Iodine | Copper | ||||
| Manganese | Zinc | ||||
| Magnesium |
No References
8.4 Dietary Reference Intakes (DRIs)
Dietary Reference Intakes (DRIs) are more than numbers in the table, even though that is often how many people view them. The link below takes you to the tables that many people commonly associate with the DRIs. These tables have been updated to include the new RDAs for vitamin D and calcium.
| Web Link
DRI Tables (inactive link as of 05/18/2021) |
Most of you are probably familiar with Dietary Guidelines. DRIs and Dietary Guidelines provide different information for different audiences.
Dietary Guidelines provide qualitative advice to the public about diet and chronic disease prevention and maintaining health.
DRIs provide quantitative advice to professionals about amounts of nutrients or food components to be of benefit.
DRIs are a collective term to refer to these components:
Estimated Average Requirement (EAR)
Recommended Dietary Allowance (RDA)
Adequate Intake (AI)
Tolerable Upper Intake Level (UL)
A number of people refer to the UL as simply the “upper limit”, leaving off “tolerable”.
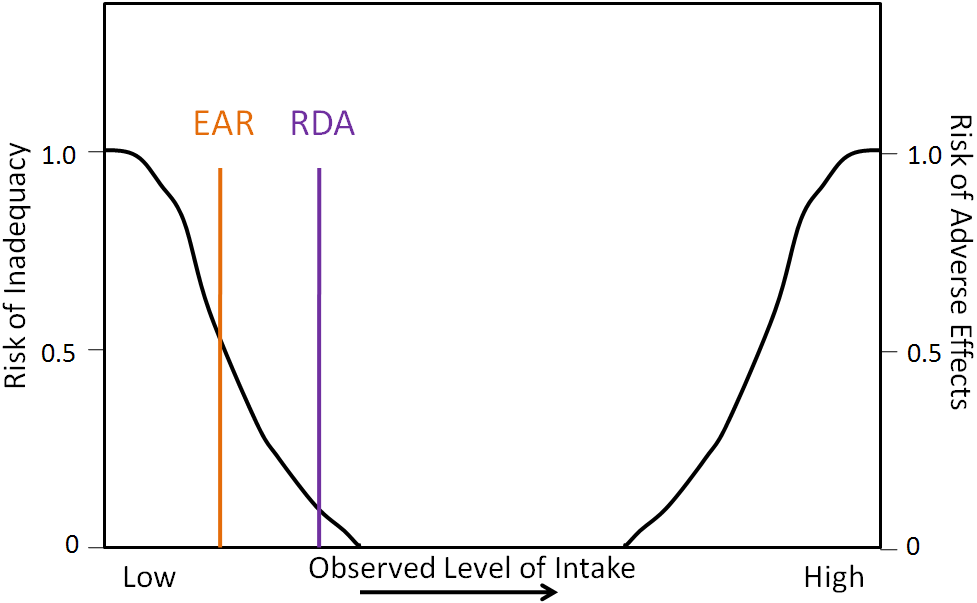
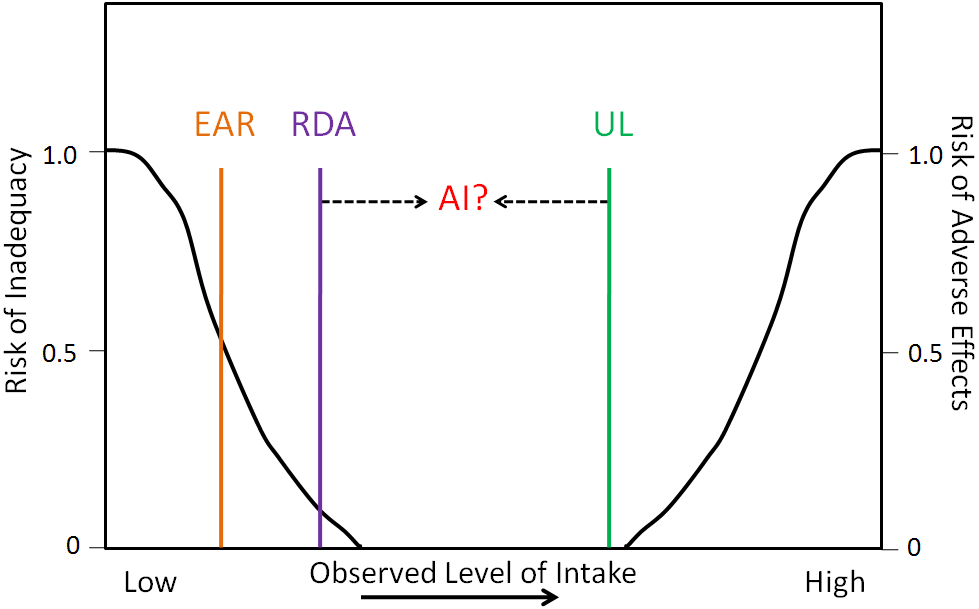
The RDA is the measure that professionals use to assess the quality of people’s diets. It is the requirement estimated to meet the needs of 97.5% of the population. But the RDA is calculated using the EAR. Therefore, the EAR needs to be set before an RDA can be set. There must be applicable research in order to set an EAR. An EAR is the estimated requirement for 50% of the population (hence the average in its name), as shown in the figure below. On the left vertical axis is the risk of inadequacy, and on the bottom of the figure is the observed level of intake that increases from left to right. We will talk about the right axis label in a later figure. Notice that for the EAR, the risk for inadequacy is 0.5 (50%) whereas the RDA the risk of inadequacy is 0.025 (2.5%).
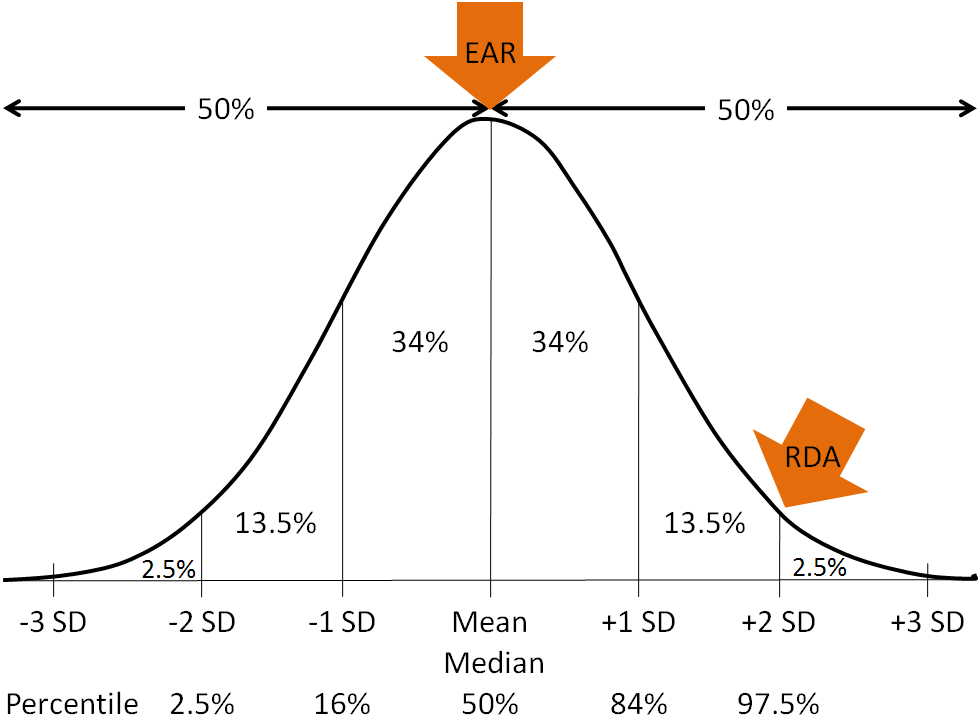
The figure below shows the EAR on the normal distribution and splits out the different standard deviations as percents. Notice that for 50% of population, their adequate intake is below the EAR and 50% of the population their adequate intake is above the EAR.
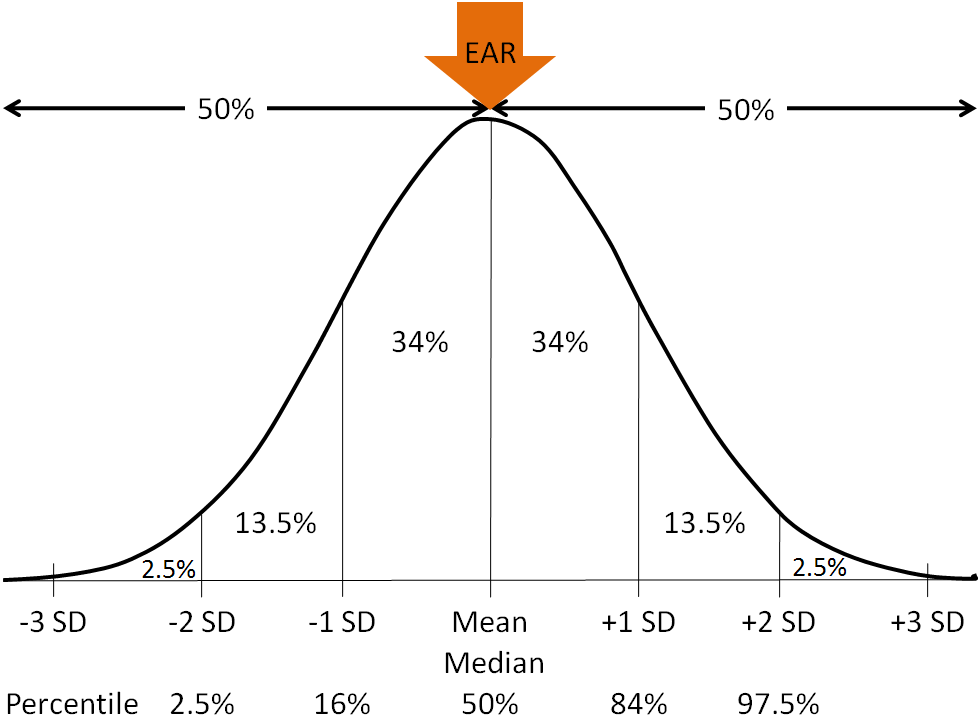
If an EAR is set, the formula for setting the RDA is:
EAR + 2 Standard Deviations = RDA
The following figure shows the distribution and how the percentages and standard deviation changes from the EAR. Only 2.5% of the population will have a need above the RDA for a particular nutrient.
For nutrients lacking the research evidence needed to set an EAR, an AI is set instead. An AI is a level that appears to be adequate in a defined population or subgroup. As you can see, the EAR is adequate for 50% (0.5) of the population and is lower than the RDA. The RDA is adequate for 97.5% (0.025) of the population, and higher than the EAR. The AI level of intake is believed to be between the EAR/RDA and the UL, but since it is not research-based, it is not exactly known where this level falls as shown below.
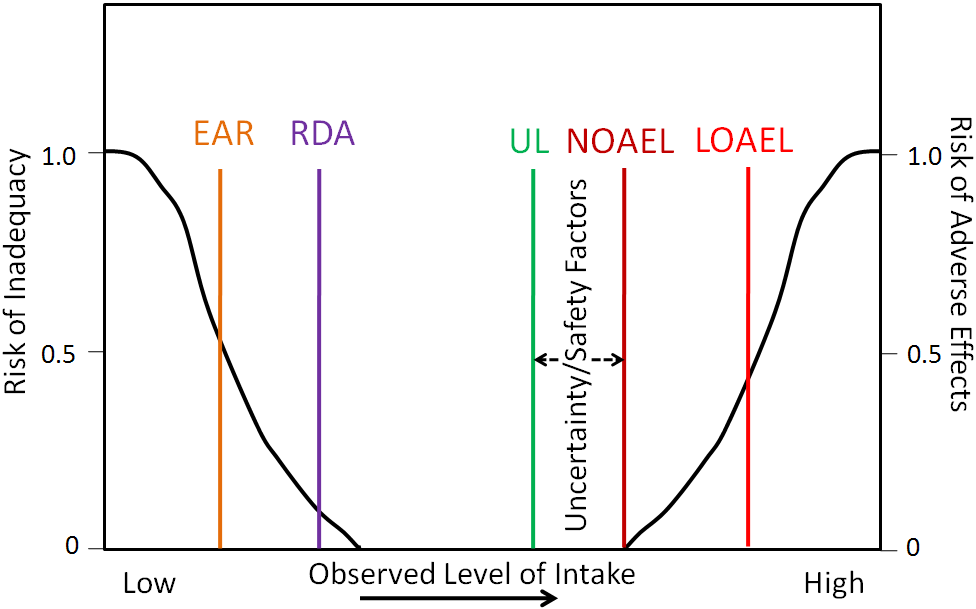
The last of the DRIs is the Tolerable Upper Intake Level (UL). This is the highest level of daily nutrient intake that is unlikely to pose risk of adverse health effects to almost all individuals in the population. To set this, the committee first sets a no observed adverse effect level (NOAEL) and/or the lowest observed adverse effect level (LOAEL). The UL is then set lower based on a number of uncertainty/safety factors off the NOAEL or LOAEL as shown below. The right vertical axis is used to represent the risk of an adverse event. Notice the NOAEL at the point where no adverse effects have been reported. The LOAEL is somewhere above the NOAEL. The UL is set at a level where it is believed that people will not experience the selected adverse effect.
How are Americans doing in meeting the DRIs? The following figure shows the percentage of Americans that are not meeting the EAR for some of the earlier micronutrients that had DRIs set. Keep in mind that the EAR is lower than the RDA.
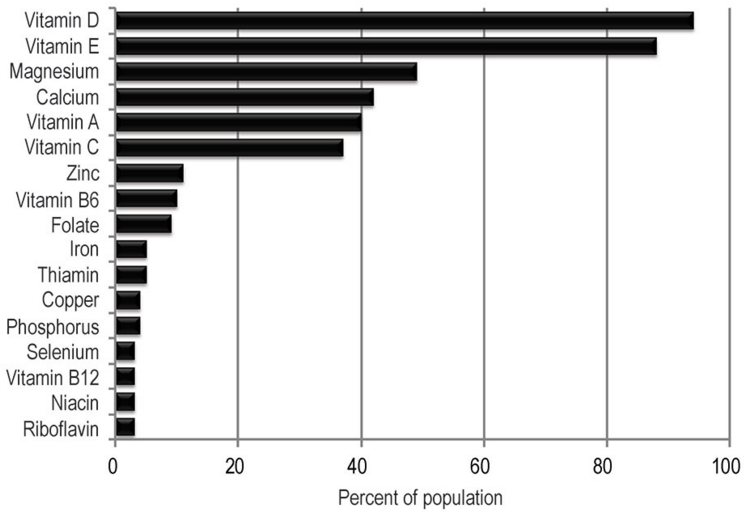
As you can see, a large percentage of Americans don’t meet the EAR for vitamin E, magnesium, vitamin A, and vitamin C. Also, keep in mind that this also does not include micronutrients that have AI instead of EARs and RDAs.
References & Links
- http://health.gov/dietaryguidelines/2015-scientific-report/06-chapter-1/d1-11.asp
Link
DRI Tables – http://www.nationalacademies.org/hmd/~/media/Files/Activity%20Files/Nutrition/DRI-Tables/5Summary%20TableTables%2014.pdf?la=en
