Main Body
Energy-Yielding Macronutrients
2 Energy
As you have learned, there are three energy-yielding macronutrients: carbohydrates, proteins, and lipids. This chapter goes more in depth about these major dietary components.
Sections:
2.1 Carbohydrates
2.2 Proteins
2.3 Lipids
2.1 Carbohydrates
Carbohydrates have become surprisingly divisive. Some people swear by them, others swear against them. But it is important to understand that carbohydrates are a diverse group of compounds that have a multitude of effects in the body. Thus, trying to make blanket statements about carbohydrates is probably not a good idea.
Carbohydrates are named because they are hydrated (as in water, H2O) carbon. Below is the formula showing how carbon dioxide (CO2) and water (H2O) are used to make carbohydrates (CH2O)n and oxygen (O2). The “n” after the carbohydrate in the formula indicates that the chemical formula is repeated an unknown number of times, but that for every carbon and oxygen, there will always be two hydrogens.
\begin{equation}
\ce{CO2 + H2O \to (CH2O)_n + O2}
\end{equation}
Carbohydrates are produced by plants through a process known as photosynthesis. In this process, plants use the energy from photons of light to synthesize carbohydrates. The formula for this reaction looks like this:
\begin{equation}
\ce{6CO2 + 6H2O + Light \to C6H12O6 + 6O2}
\end{equation}
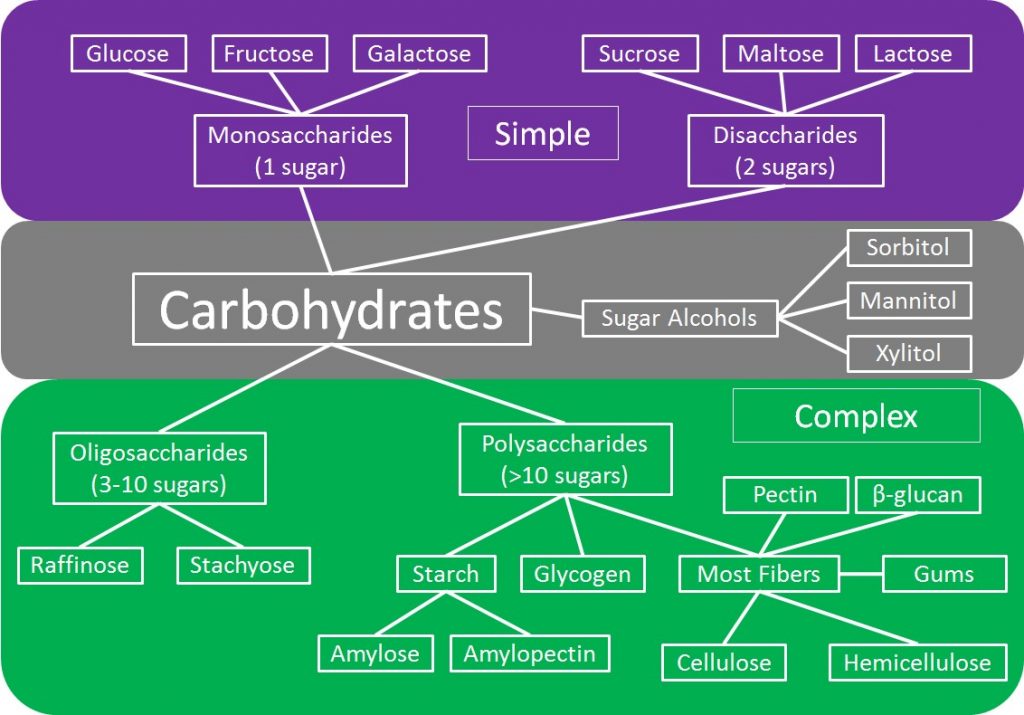
There are many different types of carbohydrates as shown in the figure below. The first way that carbohydrates can be divided is into simple, complex, and sugar alcohols. As the names imply, complex carbohydrates contain more sugar units, while simple carbohydrates contain either 1 or 2 sugars. In the next sections, you will learn more about the different forms of carbohydrates.
Subsections:
2.11 Simple Carbohydrates
2.12 Alternative Sweeteners
2.13 Oligosaccharides
2.14 Polysaccharides
No References
2.11 Simple Carbohydrates
As shown in the figure below, simple carbohydrates can be further divided into monosaccharides and disaccharides. Mono- means one, thus monosaccharides contain one sugar. Di- means two, thus disaccharides contain 2 sugar units.
Monosaccharides
The 3 monosaccharides are: glucose, fructose and galactose. Notice that all are 6-carbon sugars (hexoses). However, fructose has a five member ring, while glucose and galactose have 6 member rings. Also notice that the only structural difference between glucose and galactose is the position of the alcohol (OH) group that is shown in red.
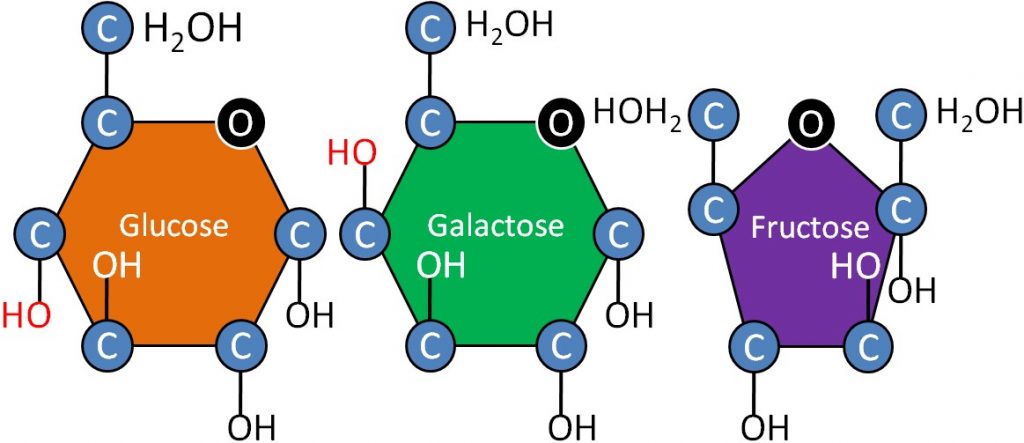
Glucose – Product of photosynthesis, major source of energy in our bodies
Fructose – Commonly found in fruits and used commercially in many beverages
Galactose – Not normally found in nature alone, normally found in the disaccharide lactose
| Web Link
Not familiar with ring structures, see how glucose forms a ring |
Disaccharides
Disaccharides are produced from 2 monosaccharides. The commonly occurring disaccharides are:
Maltose (glucose + glucose, aka malt sugar) – seldom found in foods, present in alcoholic beverages and barley
Sucrose (glucose + fructose, aka table sugar) – only made by plants.
Lactose (galactose + glucose, aka milk sugar) – primary milk sugar
The different disaccharides and the monosaccharides components are illustrated below.
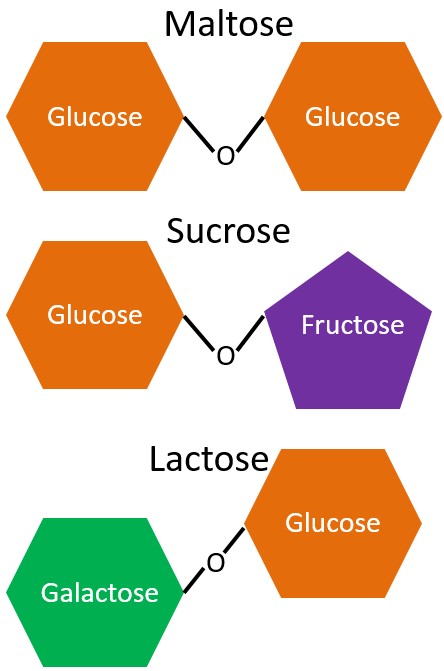
Each of these disaccharides contains glucose and all the reactions are dehydration reactions. Also notice the difference in the bond structures. Maltose and sucrose have alpha-bonds, which are depicted as v-shaped above. You might hear the term glycosidic used in some places to describe bonds between sugars. A glycoside is a sugar, so glycosidic is referring to a sugar bond. Lactose, on the other hand, contains a beta-bond. We need a special enzyme, lactase, to break this bond, and the absence of lactase activity leads to lactose intolerance.
High-Fructose Corn Syrup
Food manufacturers are always searching for cheaper ways to produce their food. One method that has been popular is the use of high-fructose corn syrup as an alternative to sucrose. High-fructose corn syrup contains either 42 or 55% fructose, which is similar to sucrose1. Nevertheless, because an increase in high-fructose corn syrup consumption (see figure below) has coincided with the increase in obesity in the U.S., there is a lot of controversy surrounding its use.
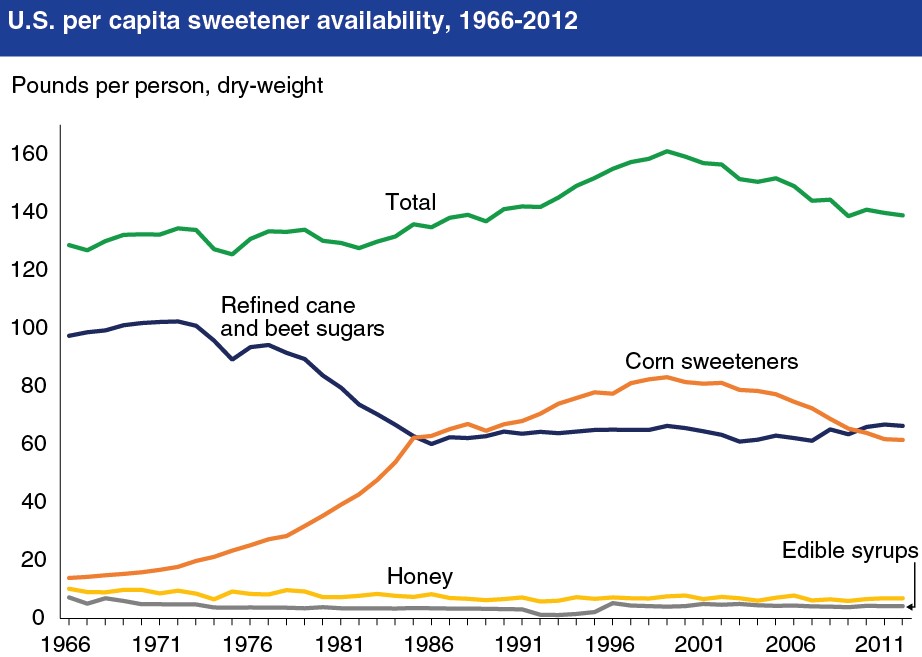
Opponents claim that high-fructose corn syrup is contributing to the rise in obesity rates. As a result, some manufactures have started releasing products made with natural sugar. You can read about this trend in the following New York Times article in the link below. Also, manufacturers tried to rebrand high-fructose corn syrup as corn sugar to get around the negative perception of the name. But the FDA rejected the Corn Refiners Association request to change the name officially to corn sugar as described in the second link. The last link is a video made by the American Chemical Society that gives some background on how HFCS is produced and how it compares to sucrose.
| Web Links
Sugar is back on labels, this time as a selling point No new name for high-fructose corn syrup (Video): Sugar vs. High Fructose Corn Syrup – What’s the Difference? (2:41) |
References & Links
- http://www.fda.gov/food/ingredientspackaginglabeling/foodadditivesingredients/ucm324856.htm
2. http://www.foodnavigator-usa.com/Markets/The-changing-American-diet-consumption-of-corn-based-sweeteners-drops
Links
Not familiar with Ring structures, see how glucose forms a ring – http://en.wikipedia.org/wiki/File:Glucose_Fisher_to_Haworth.gif
Sugar is back on labels, this time as a selling point – http://www.nytimes.com/2009/03/21/dining/21sugar.html?_r=1&ref=nutrition
No new name for high-fructose corn syrup – http://well.blogs.nytimes.com/2012/05/31/no-new-name-for-high-fructose-corn-syrup/?_r=0
Video
Sugar vs. High Fructose Corn Syrup – What’s the Difference? – https://www.youtube.com/watch?v=fXMvregmU1g
2.12 Sugar Alcohols (Polyols, Sugar Replacers)
Sugar(s) can provide a lot of calories and contribute to tooth decay. Thus there are many other compounds that are used as alternatives to sugar that have been developed or discovered. We will first consider sugar alcohols and then the alternative sweeteners in subsequent sections.
Below you can see the structure of three common sugar alcohols: xylitol, sorbitol, and mannitol.
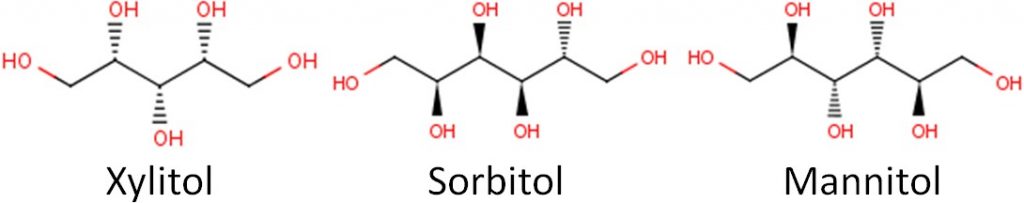
Remember that alcohol subgroups are (OH), and you can see many of them in these structures.
Sugar alcohols are also known as “sugar replacers”, because some in the public might get confused by the name sugar alcohol. Some might think a sugar alcohol is a sweet alcoholic beverage. Another name for them is nutritive sweeteners, which indicates that they do provide calories. Sugar alcohols are nearly as sweet as sucrose but only provide approximately half the calories as shown below. The name polyols also seems to be increasingly used to describe these compounds.
Table 2.121 Relative sweetness of monosaccharides, disaccharides, and sugar alcohols4,5
| Sweetener | Relative Sweetness | Energy (kcal/g) |
| Lactose | 0.2 | 4* |
| Maltose | 0.4 | 4 |
| Glucose | 0.7 | 4 |
| Sucrose | 1.0 | 4 |
| Fructose | 1.2-1.8 | 4 |
| Erythritol | 0.7 | 0.4 |
| Isomalt | 0.5 | 2.0 |
| Lactitol | 0.4 | 2.0 |
*Differs based on a person’s lactase activity
Sugars are fermented by bacteria on the surfaces of teeth. This results in a decreased pH (higher acidity) that leads to tooth decay and, potentially, cavity formation. The major advantage of sugar alcohols over sugars is that sugar alcohols are not fermented by bacteria on the tooth surface. There is a nice picture of this process in the link below as well as a video explaining the process of tooth decay.
| Web Links |
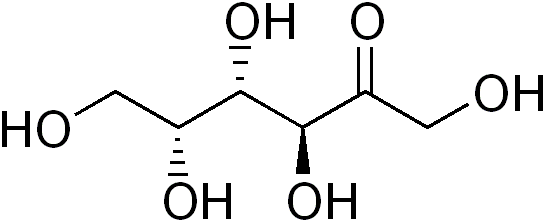
While not a sugar alcohol, tagatose is very similar to sugar alcohols. Tagatose is an isomer of fructose, that provides a small amount of energy (1.5 kcal/g). 80% of tagatose reaches the large intestine, where it is fermented by bacteria, meaning it has a prebiotic-type effect4. Notice the similarity in structure of tagatose to sugar alcohols, the only difference being a ketone (=O) instead of an alcohol (OH) group.
References & Links
- https://pubchem.ncbi.nlm.nih.gov/compound/xylitol#section=Top
- https://pubchem.ncbi.nlm.nih.gov/compound/D-Sorbitol#section=Top
- https://pubchem.ncbi.nlm.nih.gov/compound/D-mannitol#section=Top
- Wardlaw GM, Hampl J. (2006) Perspectives in nutrition. New York, NY: McGraw-Hill.
- Whitney E, Rolfes SR. (2008) Understanding nutrition. Belmont, CA: Thomson Wadsworth.
- http://en.wikipedia.org/wiki/File:Tagatose.png
Link
Sugar and Dental Caries – http://www.asu.edu/courses/css335/caries.htm
Video
Tooth Decay – http://www.youtube.com/watch?v=_oIlv59bTL4
2.13 Alternative Sweeteners
Alternative sweeteners are simply alternatives to sucrose and other mono- and disaccharides that provide sweetness. Many have been developed to provide zero-calorie or low calorie sweetening for foods and drinks.
Because many of these provide little to no calories, these sweeteners are also referred to as non-nutritive sweeteners (FDA is using high-intensity sweeteners to describe these products3). Aside from tagatose (described in sugar alcohol section), all of the sweeteners on the list below meet this criteria. Aspartame does provide calories, but because it is far sweeter than sugar, the small amount used does not contribute meaningful calories to a person’s diet. Until the FDA allowed the use of stevia, this collection of sweeteners were commonly referred to as artificial sweeteners because they were synthetically or artificially produced. However, with stevia, the descriptor artificial can no longer be used to describe these sweeteners. More recently, Luo Han Guo Fruit extracts have also been allowed to be used as another high-intensity sweetener that is not synthesized or artificially produced. The table in the link below summarizes the characteristics of the FDA approved high-intensity sweeteners.
| Web Link |
Saccharin
Saccharin is the oldest of the artificial sweeteners. You do not want to use it in cooking or baking because it develops a bitter taste4.

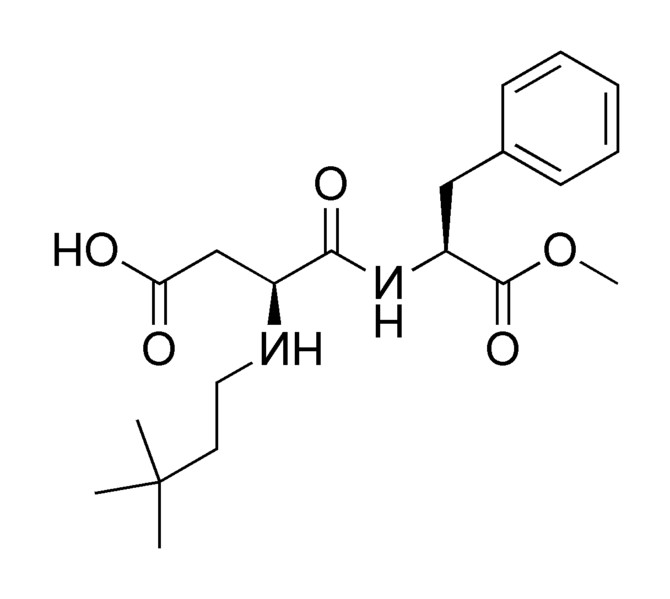
Aspartame
Aspartame is made up of 2 amino acids (phenylalanine and aspartate) and a methyl (CH3) group. The compound is broken down during digestion into the individual amino acids. This is why it provides 4 kcal/g, just like protein4. Because it can be broken down to phenylalanine, products that contain aspartame contain the following message: “Phenylketonurics: Contains phenylalanine.” Phenylketonuria (PKU) will be covered in greater detail in section 2.25. When heated, aspartame breaks down and loses its sweet flavor1.

Neotame
Neotame is like aspartame version 2.0. Neotame is structurally identical to aspartame except that it contains an additional side group (bottom of figure below, which is flipped backwards to make it easier to compare their structures). While this looks like a minor difference, it has profound effects on the properties of neotame. Neotame is much sweeter than aspartame and is heat-stable. It can still be broken down to phenylalanine, but such small amounts are used that it is not a concern for those with PKU1,4.
Advantame
The newest, sweetest alternative sweetener approved by the FDA in 2014 is advantame. It is heat-stable and does not have a trade name yet3. Notice it also has a similar structure to aspartame and neotame. Like Neotame it can broken down to phenylalanine, but such small amounts are used that it is not a concern for those with PKU. However, it has a much higher acceptable daily intake than Neotame4, meaning there is less concern about adverse effects from consuming too much.

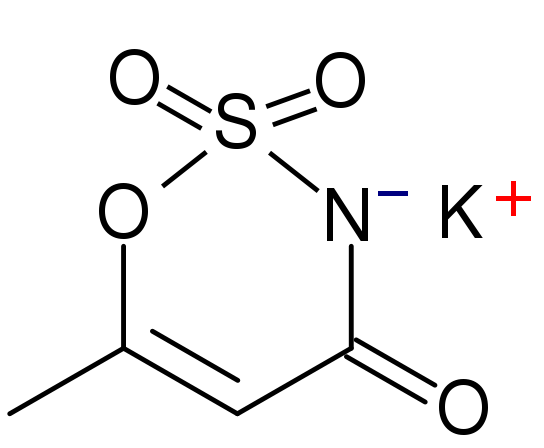
Acesulfame-Potassium (K)
Acesulfame-potassium (K) is not digested or absorbed, therefore it provides no energy or potassium to the body1. It is a heat-stable alternative sweetener.
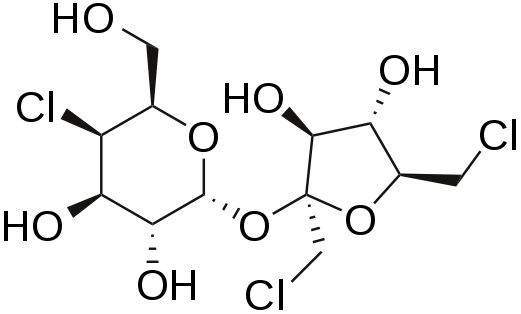
Sucralose
Sucralose is structurally identical to sucrose except that 3 of the alcohol groups (OH) are replaced by chlorine molecules (Cl). This small change causes sucralose to not be digested and as such is excreted in feces1,4. It is a heat-stable alternative sweetener.
Stevia
Stevia is derived from a South American shrub, with the leaves being the sweet part. The components responsible for this sweet taste are a group of compounds known as steviol glycosides. The structure of steviol is shown below.
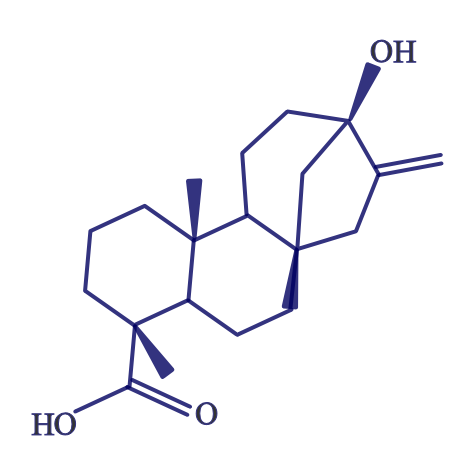
The term glycoside means that there are sugar molecules bonded to steviol. The two predominant steviol glycosides are stevioside and rebaudioside A. The structure of these two steviol glycosides are very similar13. The structure of stevioside is shown below as an example.
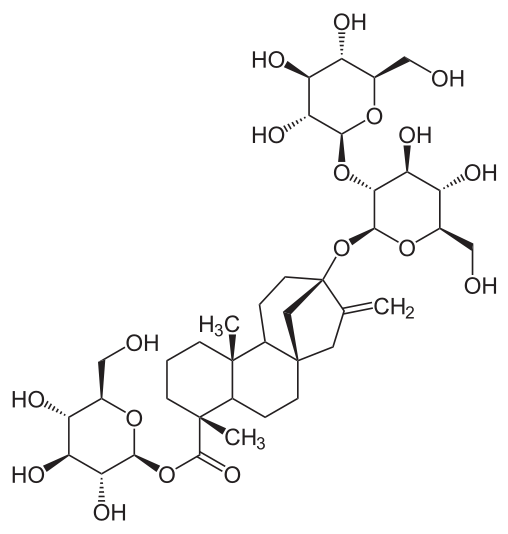
The common name for a sweetener containing primarily rebaudioside A is rebiana13. Stevia sweeteners had been marketed as a natural alternative sweeteners, something that has been stopped by lawsuits as described in the following link.
| Web Link |
Stevia is a heat-stable alternative sweetener.
Luo Han Guo Fruit Extracts
Luo Han Guo (aka Siraitia grosvenrii Swingle, monk) fruit extracts are a newer, natural heat-stable alternative sweetener option derived from a native Chinese fruit. These extracts are sweet because of the mogrosides that they contain3. The structure of a mogroside is shown below.
References & Links
- Whitney E, Rolfes SR. (2008) Understanding nutrition. Belmont, CA: Thomson Wadsworth.
- http://www.fda.gov/AboutFDA/Transparency/Basics/ucm214865.htm
- http://www.fda.gov/food/ingredientspackaginglabeling/foodadditivesingredients/ucm397725.htm
- Byrd-Bredbenner C, Moe G, Beshgetoor D, Berning J. (2009) Wardlaw’s perspectives in nutrition. New York, NY: McGraw-Hill.
- https://en.wikipedia.org/wiki/Saccharin#/media/File:Saccharin.svg
- http://en.wikipedia.org/wiki/Aspartame
- http://en.wikipedia.org/wiki/File:Neotame.png
- http://en.wikipedia.org/wiki/File:Advantame.svg
- http://en.wikipedia.org/wiki/File:AcesulfameK.svg
- http://en.wikipedia.org/wiki/File:Sucralose2.svg
- http://en.wikipedia.org/wiki/File:Steviol.svg
- Carakostas MC, Curry LL, Boileau AC, Brusick DJ. (2008) Overview: The history, technical function and safety of rebaudioside A, a naturally occurring steviol glycoside, for use in food and beverages. Food and Chemical Toxicology 46 Suppl 7: S1.
- http://en.wikipedia.org/wiki/File:Steviosid.svg
- http://en.wikipedia.org/wiki/File:Mogroside_II_E.gif
Links
FDA High-Intensity sweeteners – http://www.fda.gov/food/ingredientspackaginglabeling/foodadditivesingredients/ucm397725.htm
What is natural and who decides? – http://www.nutraingredients-usa.com/Markets/Pure-Via-to-settle-class-action-suit-over-natural-claims
2.14 Oligosaccharides
Within complex carbohydrates, there are oligosaccharides and polysaccharides. Oligosaccharides (oligo means few) are composed of 3-10 sugar units and polysaccharides contain greater than 10 sugar units.
Raffinose and stachyose are the most common oligosaccharides. They are found in legumes, onions, broccoli, cabbage, and whole wheat1. The link below shows the raffinose and stachyose content of some plant foods.
| Web Link |
The structures of the two oligosaccharides are shown below.
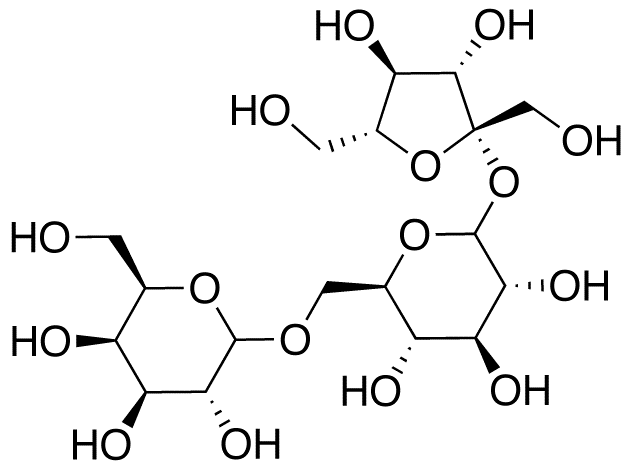
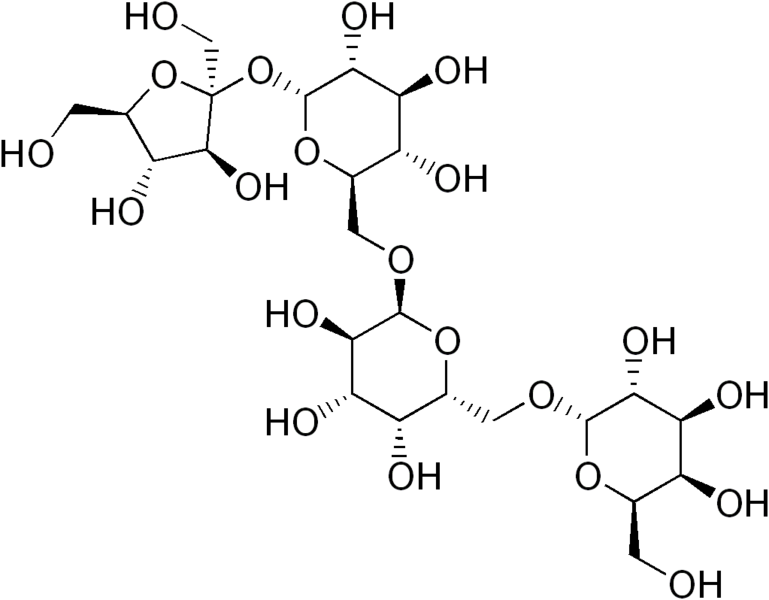
Our digestive system lacks the enzymes necessary to digest these alpha 1-6 glycosidic bonds found in oligosaccharides. As a result, the oligosaccharides are not digested and reach the colon where they are fermented by the bacteria there. Gas is produced as a byproduct of this bacteria fermentation that can lead to flatulence. To combat this problem, Beano® is a popular product that contains an enzyme (alpha-galactosidase) to break down oligosaccharides, thereby preventing them from being used to produce gas.
References & Links
- Byrd-Bredbenner C, Moe G, Beshgetoor D, Berning J. (2009) Wardlaw’s perspectives in nutrition. New York, NY: McGraw-Hill.
- http://en.wikipedia.org/wiki/File:Raffinose.png
- http://en.wikipedia.org/wiki/File:Stachyose.png
Videos
Raffinose and stachyose content of foods – http://books.google.com/books?id=LTGFV2NOySYC&pg=PA374&lpg=PA374&dq=raffinose+and+stachyose+content+of+vegetables&source=bl&ots=X4Dr7jWmwL&sig=CJFvhAIysSZCP2SOy_MqhfoVYQQ&hl=en&ei=TSRITdTfLNH0gAfB2MX_BQ&sa=X&oi=book_result&ct=result&resnum=6&ved=0CD0Q6AEwBQ#v=onepage&q=raffinose%20and%20stachyose%20content%20of%20vegetables&f=false
Beano’s University of Gas – http://beano.com.cn/university-of-gas#
2.15 Polysaccharides
Poly means “many” and thus polysaccharides are made up of many monosaccharides (>10). There are 3 main classes of polysaccharides: starch, glycogen, and most fibers. The following sections will describe the structural similarities and differences between the 3 classes of polysaccharides that are divided in the figure below.
Subsections:
2.151 Starch
2.152 Glycogen
2.153 Fiber
2.151 Starch
Starch is the storage form of glucose in plants. There are two forms of starch: amylose and amylopectin. Structurally they differ in that amylose is a linear polysaccharide, whereas amylopectin is branched. The linear portion of both amylose and amylopectin contains alpha 1-4 glycosidic bonds, while the branches of amylopectin are made up of alpha 1-6 glycosidic bonds.


Amylopectin is more common than amylose (4:1 ratio on average) in starch1,2. Some starchy foods include grains, root crops, tubers, and legumes.
References & Links
- Stipanuk MH. (2006) Biochemical, physiological, & molecular aspects of human nutrition. St. Louis, MO: Saunders Elsevier.
- Byrd-Bredbenner C, Moe G, Beshgetoor D, Berning J. (2009) Wardlaw’s perspectives in nutrition. New York, NY: McGraw-Hill.
2.152 Glycogen
Glycogen is similar to starch in that it is a storage form of glucose. Glycogen, however, is the carbohydrate storage form in animals, rather than plants. It is even more highly branched than amylopectin, as shown below.

Like amylopectin, the branch points of glycogen are alpha 1-6 glycosidic bonds, while the linear bonds are alpha 1-4 bonds, as shown below.
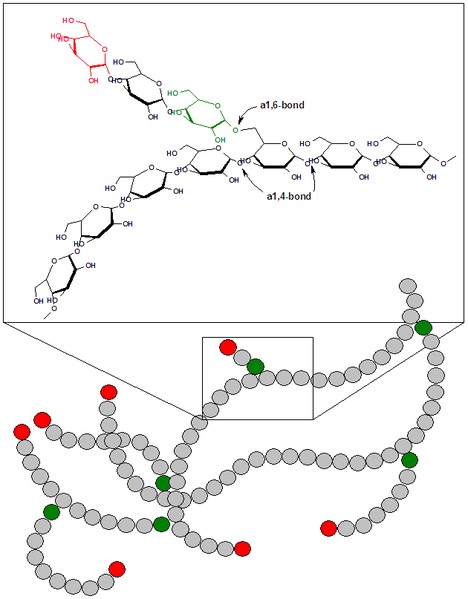
The advantage of glycogen’s highly branched structure is that the multiple ends (shown in red above) are where enzymes start to cleave off glucose molecules. As a result, with many ends available, it can provide glucose much more quickly to the body than it could if it was a linear molecule like amylose with only two ends. We consume almost no glycogen, because it is rapidly broken down by enzymes in animals after slaughter2.
References & Links
- http://en.wikipedia.org/wiki/File:Glycogen.png
- Whitney E, Rolfes SR. (2008) Understanding nutrition. Belmont, CA: Thomson Wadsworth.
2.153 Fiber
The simplest definition of fiber is indigestible matter. Indigestible means that it survives digestion in the small intestine and reaches the large intestine.
There are 3 major fiber classifications1:
Dietary Fiber – nondigestible carbohydrates and lignin that are intrinsic and intact in plants
Functional Fiber – isolated, nondigestible carbohydrates that have beneficial physiological effects in humans
Total Fiber – dietary fiber + functional fiber
The differences between dietary and functional fiber are compared in the table below:
Table 2.1531 Differences between dietary fiber and functional fiber
| Dietary Fiber | Functional Fiber |
| Intact in plants | Isolated, extracted, or synthesized |
| Carbohydrates + lignins | Only carbohydrates |
| Only from plants | From plants or animals |
| No proven benefit | Must prove benefit |
Dietary fiber is always intact in plants, whereas functional fiber can be isolated, extracted or synthesized. Functional fiber is only carbohydrates, while dietary fiber also includes lignins. Functional fiber can be from plants or animals, while dietary fiber is only from plants. Functional fiber must be proven to have a physiological benefit, while dietary fiber does not.
Polysaccharide fiber differs from other polysaccharides in that it contains beta-glycosidic bonds (as opposed to alpha-glycosidic bonds). To illustrate these differences, consider the structural differences between amylose and cellulose (type of fiber). Both are linear chains of glucose, the only difference is that amylose has alpha-glycosidic bonds, while cellulose has beta-glycosidic bonds as shown below.
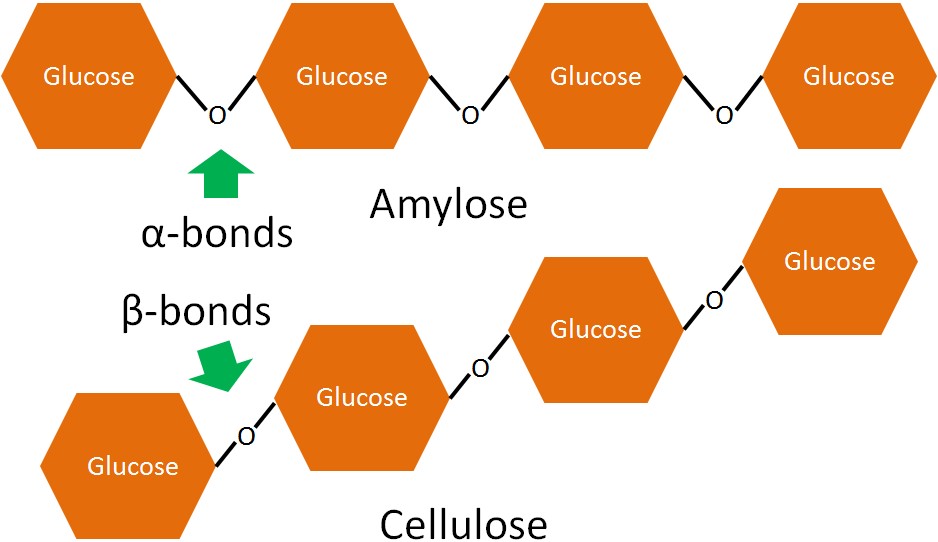
The beta-bonds in fiber cannot be broken down by the digestive enzymes in the small intestine so they continue into the large intestine.
Fiber can be classified by its physical properties. In the past, fibers were commonly referred to as soluble and insoluble. This classification distinguished whether the fiber was soluble in water. However, this classification is being phased out in the nutrition community. Instead, most fibers that would have been classified as insoluble fiber are now referred to as nonfermentable and/or nonviscous and soluble fiber as fermentable, and/or viscous because these better describe the fiber’s characteristics2. Fermentable refers to whether the bacteria in the colon can ferment or degrade the fiber into short chain fatty acids and gas. Viscous refers to the capacity of certain fibers to form a thick gel-like consistency. The following table lists some of the common types of fiber and provides a brief description about each.
Table 2.1532 Common types of nonfermentable, nonviscous (insoluble) fiber
| Fiber | Description |
| Cellulose | Main component of plant cell walls |
| Hemicellulose | Surround cellulose in plant cell walls |
| Lignin | Noncarbohydrate found within “woody” plant cell walls |
Table 2.1533 Common types of fermentable, viscous (soluble) fiber
| Fiber | Description |
| Hemicellulose | Surround cellulose in plant cell walls |
| Pectin | Found in cell walls and intracellular tissues of fruits and berries |
| Beta-glucans | Found in cereal brans |
| Gums | Viscous, usually isolated from seeds |
The following table gives the percentage of total dietary fiber in 5 foods.
Table 2.1534 Total dietary fiber (as percent of sample weight)3
| Food | Total Dietary Fiber |
| Cereal, all bran | 30.1 |
| Blueberries, fresh | 2.7 |
| Broccoli, fresh, cooked | 3.5 |
| Pork and beans, canned | 4.4 |
| Almonds, with skin | 8.8 |
The table below shows the amount of nonfermentable, nonviscous fiber in these same five foods.
Table 2.1535 Nonviscous fiber (as percent of sample weight)3
| Food | Hemicellulose | Cellulose | Pectin | Lignin | Total |
| Cereal, all bran | 15.3 | 7.5 | 0.9 | 4.3 | 28.0 |
| Blueberries, fresh | 0.7 | 0.4 | 0.4 | 0.9 | 2.4 |
| Broccoli, fresh, cooked | 0.9 | 1.2 | 0.7 | 0.3 | 3.1 |
| Pork and beans, canned | 0.9 | 1.6 | 0.3 | 0.2 | 3.0 |
| Almonds, with skin | 1.8 | 3.3 | 1.6 | 1.9 | 8.6 |
The table below shows the amount of fermentable, viscous fiber in these same five foods.
Table 2.1536 Viscous Fiber (as percent of sample weight)3
| Food | Hemicellulose | Pectin | Total |
| Cereal, all bran | 2.0 | 0.1 | 2.1 |
| Blueberries, fresh | 0.1 | 0.2 | 0.3 |
| Broccoli, fresh, cooked | 0.2 | 0.2 | 0.4 |
| Pork and beans, canned | 1.1 | 0.3 | 1.4 |
| Almonds, with skin | 0.2 | tr | 0.2 |
tr = trace amounts
Foods that are good sources of non fermentable, non viscous fiber include whole wheat, whole grain cereals, broccoli, and other vegetables. This type of fiber is believed to decrease the risk of constipation and colon cancer, because it increases stool bulk and reduces transit time4. This reduced transit time theoretically means shorter exposure to consumed carcinogens in the intestine, and thus lower cancer risk.
Fermentable, viscous fiber can be found in oats, rice, psyllium seeds, soy, and some fruits. This type of fiber is believed to decrease blood cholesterol and sugar levels, thus also lowering the risk of heart disease and diabetes, respectively4. Its viscous nature slows the absorption of glucose preventing blood glucose from spiking after consuming carbohydrates. It lowers blood cholesterol levels primarily by binding bile acids, which are made from cholesterol, and causing them to be excreted. As such, more cholesterol is used to synthesize new bile acids.
References & Links
- DRI Book – [Anonymous]. (2005) Dietary reference intakes for energy, carbohydrate, fiber, fat, fatty acids, cholesterol, protein, and amino acids. Washington, D.C.: The National Academies Press. https://www.nap.edu/read/10490/chapter/9
- Dietary Reference Intakes: Proposed Definition of Dietary Fiber Food and Nutrition Board. 2001 https://www.nap.edu/read/10161/chapter/3
- Marlett JA. (1992) Content and composition of dietary fiber in 117 frequently consumed foods. J Am Diet Assoc 92: 175-186.
- Byrd-Bredbenner C, Moe G, Beshgetoor D, Berning J. (2009) Wardlaw’s perspectives in nutrition. New York, NY: McGraw-Hill.
2.2 Protein
Protein is another major macronutrient that, like carbohydrates, are made up of small repeating units. But instead of sugars, protein is made up of amino acids. In the following sections, you will learn more about how protein is synthesized and why it is important in the body.
Subsections:
2.21 Amino Acids
2.22 Protein Synthesis
2.23 Protein Structure
2.24 Protein Functions
2.25 Types of Amino Acids
2.26 Amino Acid Structures
2.27 Protein Quality
2.28 Protein-Energy Malnutrition
2.21 Amino Acids
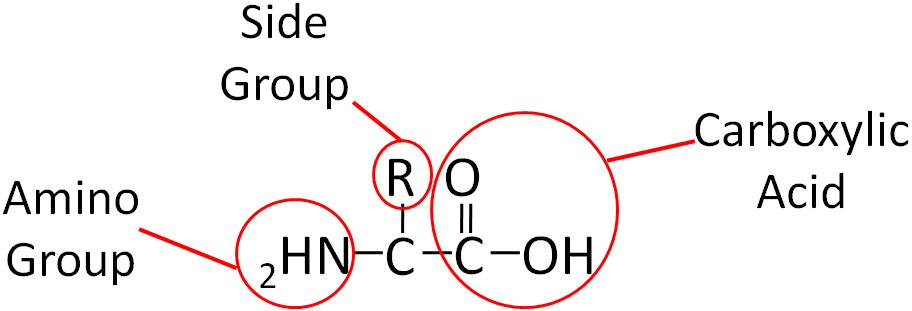
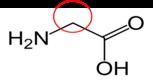
Similar to carbohydrates, proteins contain carbon (C), hydrogen (H), and oxygen (O). However, unlike carbohydrates (and lipids) proteins also contain nitrogen (N). Proteins are made up of smaller units called amino acids. This name, amino acid, signifies that each contains an amino (NH2) and carboxylic acid (COOH) groups. The only structural difference in the 20 amino acids is the side group represented by the R below.
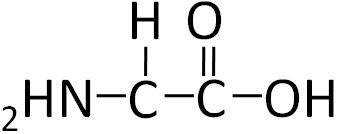
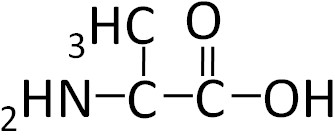
To illustrate the differences in the side group we will consider glycine and alanine, the two simplest amino acids. For glycine the R group is hydrogen (H), while in alanine the R group is a methyl (CH3). The structures of these two amino acids are shown below.
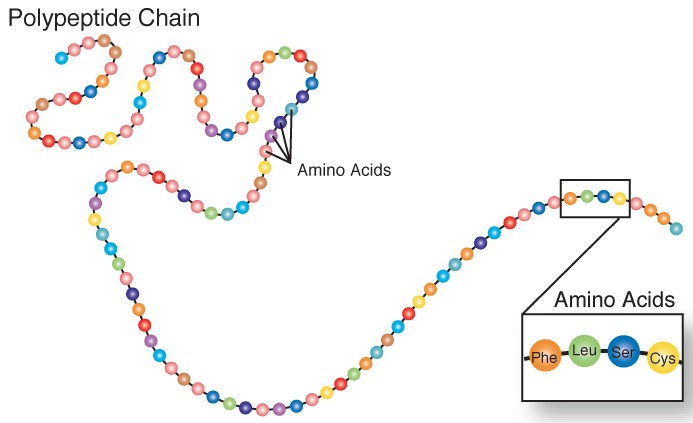
Individual amino acids are joined together using a peptide bond (green) and is shown in the figure below.
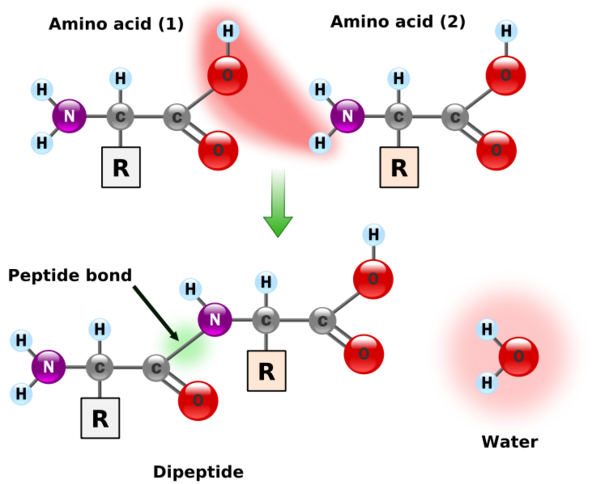
Amino acids can also come together to form tripeptides (three amino acids), oligopeptides (3-10 amino acids), and polypeptides (10 or more amino acids). A polypeptide is a chain of amino acids as shown below.
References & Links
- http://en.wikipedia.org/wiki/File:Peptidformationball.svg
- http://www.genome.gov/Glossary/index.cfm?id=149
2.22 Protein Synthesis
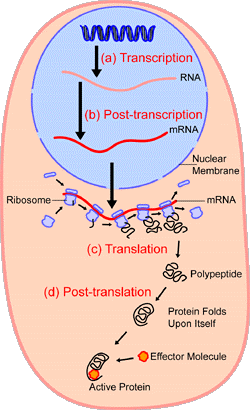
The process of protein synthesis is not as simple as stringing together amino acids to form a polypeptide. As shown below, this is a fairly involved process. DNA contains the genetic code that is used as a template to create mRNA in a process known as transcription. The mRNA then moves out of the nucleus into the cytoplasm where it serves as the template for translation, where tRNAs bring in individual amino acids that are bonded together to form a polypeptide.
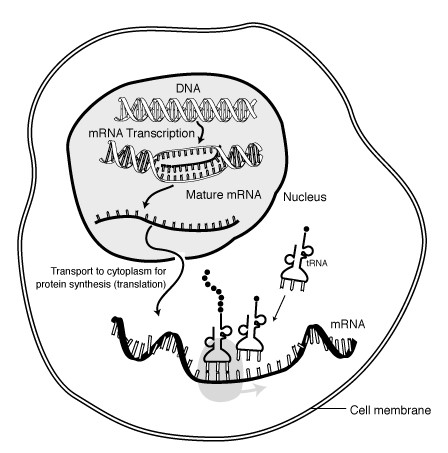
Proteins, known as ribosomes, assist with translation. After translation, the polypeptide can be folded or gain structure as shown below and will be discussed in the next subsection (Protein Structure).
These videos do an excellent job of showing and explaining how protein synthesis occurs.
| Web Links |
References & Links
- http://www.genome.gov/Pages/Hyperion/DIR/VIP/Glossary/Illustration/mrna.cfm?key=messenger%20RNA
2. http://en.wikipedia.org/wiki/File:Proteinsynthesis.png
Videos
Transcription – http://www.youtube.com/watch?v=5MfSYnItYvg
Translation – http://www.youtube.com/watch?v=8dsTvBaUMvw
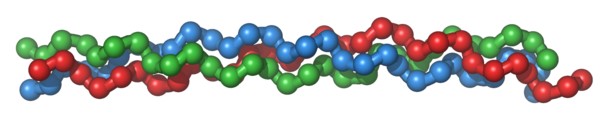
2.23 Protein Structure
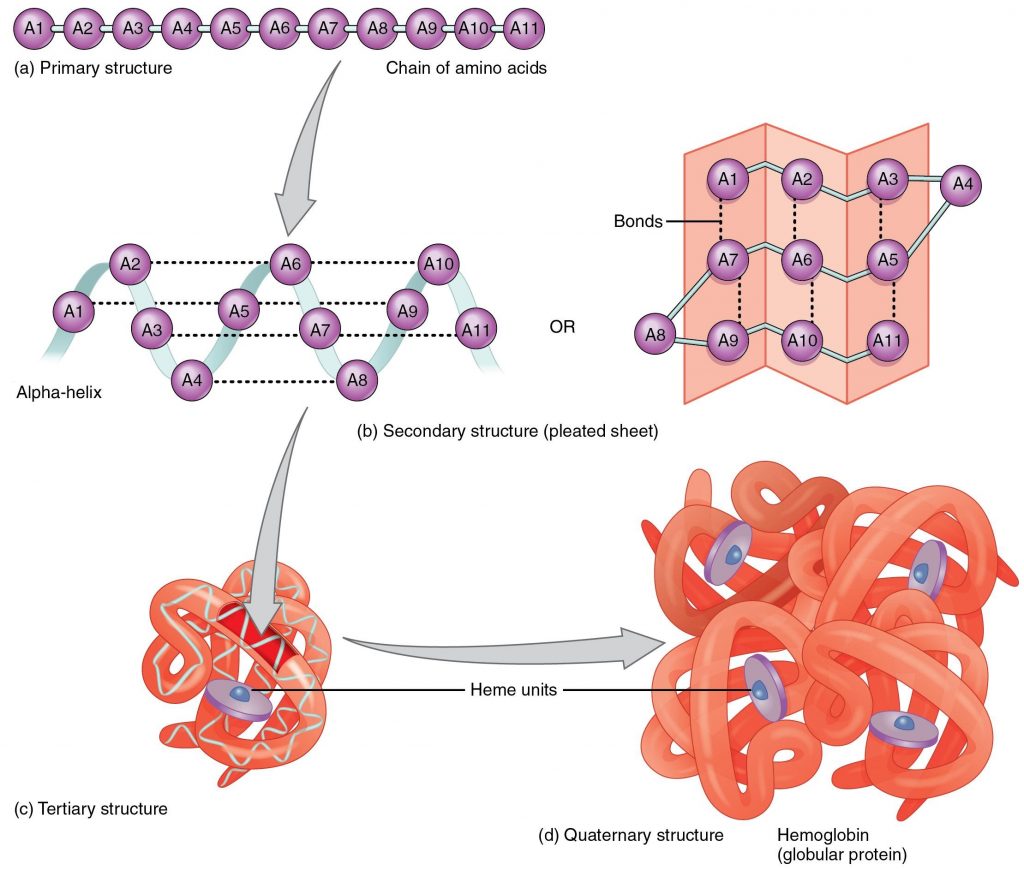
There are four levels of protein structure. Primary structure is the linear polypeptide chain. Secondary structure occurs when hydrogen bonding between amino acids in the same polypeptide chain causes the formation of structures such as beta-pleated sheets and alpha-helices. Tertiary structure occurs as a result of an attraction between different amino acids of the polypeptide chain and interactions between the different secondary structures. Finally, certain proteins contain quaternary structure where multiple polypeptide chains are bonded together to form a larger molecule. Hemoglobin is an example of a protein with quaternary structure. The figure below illustrates the different levels of protein structure.
This video does a nice job of illustrating and explaining the different protein structures.
| Web Link |
References & Links
- “225 Peptide Bond-01” by OpenStax College – Anatomy & Physiology, Connexions Web site. http://cnx.org/content/col11496/1.6/, Jun 19, 2013.. Licensed under CC BY 3.0 via Commons – https://commons.wikimedia.org/wiki/File:225_Peptide_Bond-01.jpg#/media/File:225_Peptide_Bond-01.jpg
Video
Protein Structure – http://www.youtube.com/watch?v=lijQ3a8yUYQ
2.24 Protein Functions
There are various functions of proteins in the body that are described below.
Structural
Proteins, such as collagen, serve as the scaffolding of the body, and thus are important for the structure of tissues.
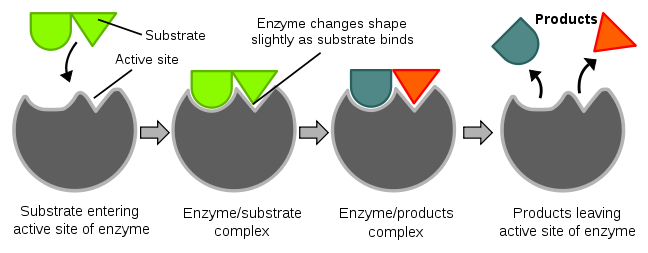
Enzymes
We will discuss a number of enzymes throughout this class, and the vast majority are proteins. An enzyme catalyzes (enhances the rate) of a chemical reaction. The key part of an enzyme is its “active site”. The active site is where a compound to be acted on, known as a substrate, enters. Enzymes are specific for their substrates; they do not catalyze reactions on any random compounds floating by. You might have heard the “lock and key” analogy used for enzymes and substrates, respectively. After the substrate enters the active site and binds, the enzyme slightly changes shape (conformation). The enzyme then catalyzes a reaction that, in the example below, splits the substrate into two parts. The products of this reaction are released and the enzyme returns to its native or original shape. It is then ready to catalyze another reaction. The figure and video below nicely illustrate the function of an enzyme.
| Web Link |
Enzymes’ names commonly end in -ase, and many are named for their substrate. For example the enzyme amylase cleaves bonds found in amylose and amylopectin.
Hormones
Many hormones are proteins. A hormone is a compound that is produced in one tissue, released into circulation, then has an effect on a different organ. Most hormones are produced from several organs, collectively known as endocrine organs. Insulin is an an example of a hormone that is a protein.
| Web Link |
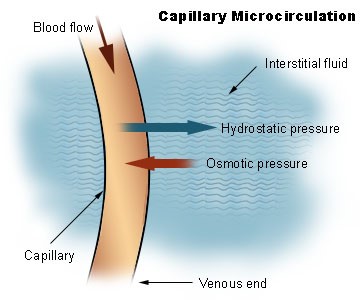
Fluid Balance
Proteins help to maintain the balance between fluids in the plasma and the interstitial fluid. Interstitial fluid is the fluid that surrounds cells. Interstitial fluid and plasma (fluid part of blood) are the two components of extracellular fluid, or the fluid outside of cells. The following figure illustrates the exchange of fluid between interstitial fluid and plasma.
Acid-Base Balance
Proteins serve as buffers, meaning that they help to prevent the pH of the body from getting too high or too low.
Transport
Transport proteins move molecules through circulation or across cell membranes. One example is hemoglobin that transports oxygen through the body. We will see a number of other examples as we move through class.
Immune Function
Antibodies are proteins that recognize antigens (foreign substances that generate antibody or inflammatory response) and bind to and inactivate them. Antibodies are important in our ability to ward off disease.
Other Functions
Proteins can also serve as neurotransmitters and can be used for energy by forming glucose through gluconeogenesis.
References & Links
- http://en.wikipedia.org/wiki/File:Collagentriplehelix.png
- http://en.wikipedia.org/wiki/File:Induced_fit_diagram.svg
- http://en.wikipedia.org/wiki/File:Illu_capillary_microcirculation.jpg
Videos
Enzymes – http://www.youtube.com/watch?v=cbZsXjgPDLQ
Hormones – http://www.youtube.com/watch?v=kIPYVV4aThM
2.25 Types of Amino Acids
There are 20 amino acids our body uses to synthesize proteins. These amino acids can be classified as essential, non-essential, or conditionally essential. The table below shows how the 20 amino acids are classified.
Table 2.251 Essential, conditionally essential, and nonessential amino acids1
| Essential | Conditionally Essential | Non-essential |
| Histidine | Arginine | Alanine |
| Isoleucine | Cysteine | Asparagine |
| Leucine | Glutamine | Aspartic Acid or Aspartate |
| Lysine | Glycine | Glutamic Acid or Glutamate |
| Methionine | Proline | Serine |
| Phenylalanine | Tyrosine | |
| Threonine | ||
| Tryptophan | ||
| Valine |
The body cannot synthesize nine amino acids. Thus, it is essential that these are consumed in the diet. As a result these amino acids are known as essential, or indispensable, amino acids. As an example of how amino acids were determined to be essential, Dr. William C. Rose at the University of Illinois discovered that threonine was essential by feeding different diets to graduate students at the university as described in the following link.
| Web Link |
Non-essential, or dispensable, amino acids can be made in our body, so we do not need to consume them. Conditionally essential amino acids become essential for individuals in certain situations. An example of a condition when an amino acid becomes essential is the disease phenylketonuria (PKU). Individuals with PKU have a mutation in the enzyme phenylalanine hydroxylase, which normally adds an alcohol group (OH) to the amino acid phenylalanine to form tyrosine as shown below.
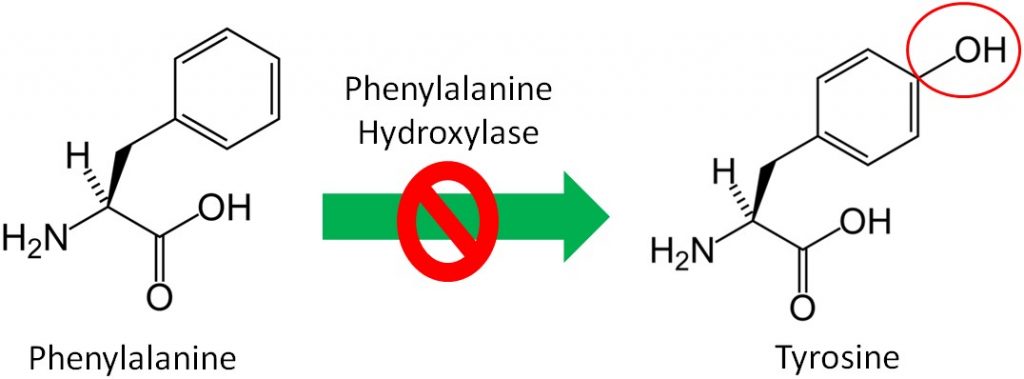
Since tyrosine cannot be synthesized by people with PKU, it becomes essential for them. Thus, tyrosine is a conditionally essential amino acid. Individuals with PKU have to eat a very low protein diet and avoid the alternative sweetener aspartame, because it can be broken down to phenylalanine. If individuals with PKU consume too much phenylalanine, phenylalanine and its metabolites, can build up and cause brain damage and severe mental retardation. The drug Kuvan was approved for use with PKU patients in 2007 who have low phenylalanine hydroxylase activity levels. You can learn more about this drug using the link below.
| Web Link |
References & Links
- Anonymous. Dietary Reference Intakes for Energy, Carbohydrate, Fiber, Fat, Fatty Acids, Cholesterol, Protein, and Amino Acids (Macronutrients). Protein and Amino Acids. Institute of Medicine, Food and Nutrition Board. 2005 http://books.nap.edu/openbook.php?record_id=10490&page=589
- https://en.wikipedia.org/wiki/Phenylalanine#/media/File:L-Phenylalanin_-_L-Phenylalanine.svg
- https://en.wikipedia.org/wiki/Tyrosine#/media/File:L-Tyrosin_-_L-Tyrosine.svg
Links
Discovery of Threonine by William C. Rose – http://www.jbc.org/content/277/37/e25.full
Kuvan – http://www.kuvan.com/
2.26 Amino Acid Structures
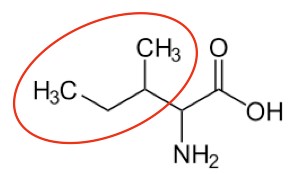
It is a good idea to have a general idea of the structure of the different amino acids and to be able to recognize them as amino acids. You are not expected to memorize these structures. Often I say the name of amino acids and not all students understand that I am talking about an amino acid. Each amino acid differs only by its side group, which is circled in red in each figure below. Also, the more familiar you become with chemical structures, the more prepared you will be for later classes.
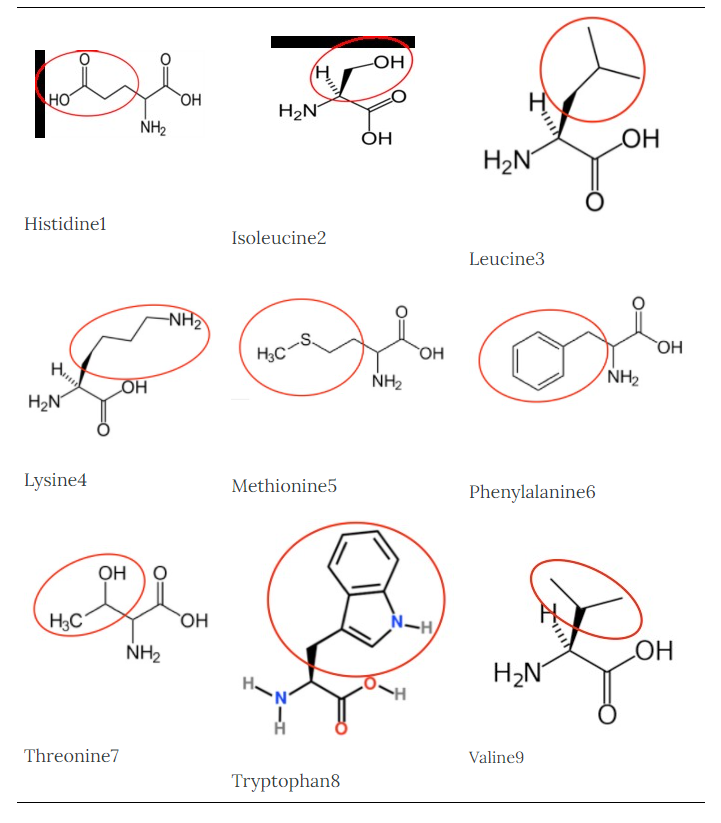
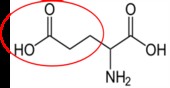
Histidine1 |
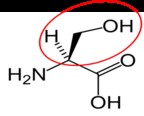
Isoleucine2 |
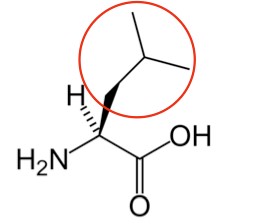
Leucine3 |
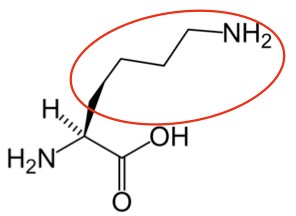
Lysine4 |
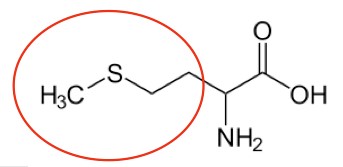
Methionine5 |
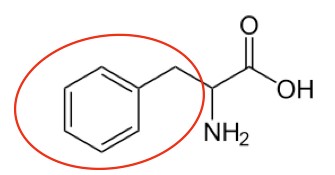
Phenylalanine6 |
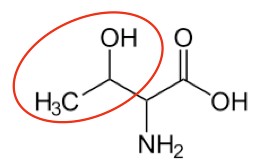
Threonine7 |
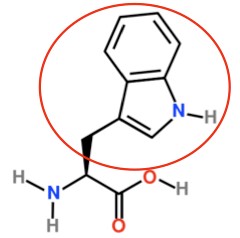
Tryptophan8 |
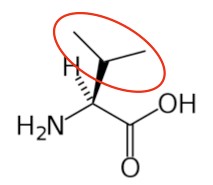 Valine9 |
Figure 2.261 Essential amino acids
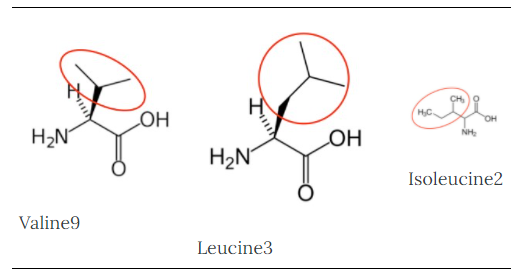
You may hear someone talk about the branch chain amino acids, which are all essential amino acids, but they are singled out in the figure below.
|
Valine9 |
Leucine3 |
Isoleucine2 |
Figure 2.262 Branched chain amino acids
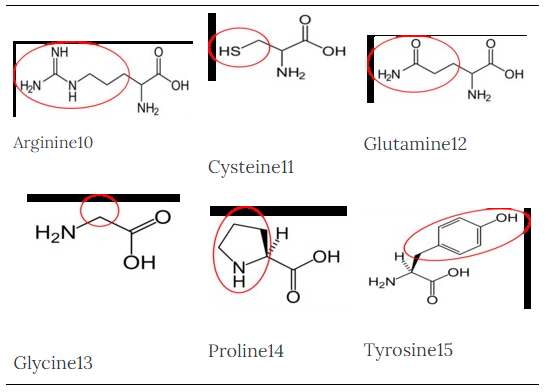
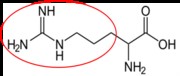 Arginine10 |
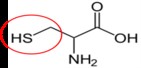
Cysteine11 |
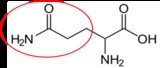
Glutamine12 |
Glycine13 |
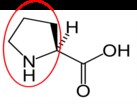
Proline14 |

Tyrosine15 |
Figure 2.263 Conditionally essential amino acids
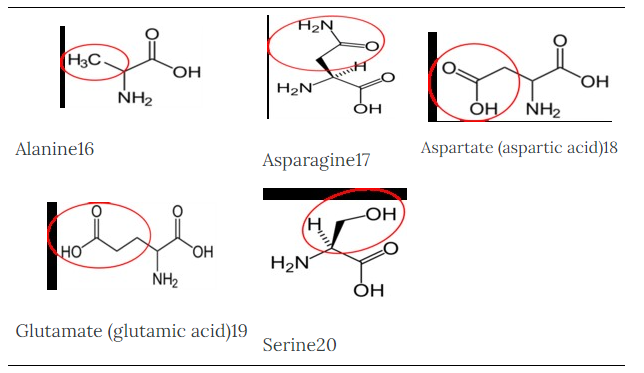
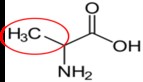
Alanine16 |
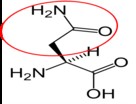
Asparagine17 |
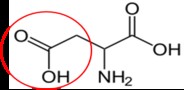 Aspartate (aspartic acid)18 |
|
Glutamate (glutamic acid)19 |
Serine20 |
Figure 2.264 Nonessential amino acids
References & Links
- https://en.wikipedia.org/wiki/Histidine#/media/File:Histidin_-_Histidine.svg
- https://en.wikipedia.org/wiki/Isoleucine#/media/File:L-Isoleucin_-_L-Isoleucine.svg
- https://en.wikipedia.org/wiki/Leucine#/media/File:Leucine_Nonionic.svg
- https://en.wikipedia.org/wiki/Lysine#/media/File:L-lysine-monocation-2D-skeletal.png
- https://en.wikipedia.org/wiki/Methionine#/media/File:Methionin_-_Methionine.svg
- https://en.wikipedia.org/wiki/Phenylalanine#/media/File:L-Phenylalanin_-_L-Phenylalanine.svg
- https://en.wikipedia.org/wiki/Threonine#/media/File:Threonineasdf.png
- https://en.wikipedia.org/wiki/Tryptophan#/media/File:L-Tryptophan_-_L-Tryptophan.svg
- https://en.wikipedia.org/wiki/Valine#/media/File:ValinenotatpH7.4.png
- https://en.wikipedia.org/wiki/Arginine#/media/File:Arginin_-_Arginine.svg
- https://en.wikipedia.org/wiki/Cysteine#/media/File:L-Cystein_-_L-Cysteine.svg
- https://en.wikipedia.org/wiki/Glutamine#/media/File:L-Glutamin_-_L-Glutamine.svg
- https://en.wikipedia.org/wiki/Glycine#/media/File:Glycin_-_Glycine.svg
- https://en.wikipedia.org/wiki/Proline#/media/File:Prolin_-_Proline.svg
- https://en.wikipedia.org/wiki/Tyrosine#/media/File:L-Tyrosin_-_L-Tyrosine.svg
- https://en.wikipedia.org/wiki/Alanine#/media/File:L-Alanin_-_L-Alanine.svg
- https://en.wikipedia.org/wiki/Asparagine#/media/File:L-Asparagin_-_L-Asparagine.svg
- https://en.wikipedia.org/wiki/Aspartic_acid#/media/File:Aspartic_Acidph.png
- https://en.wikipedia.org/wiki/Glutamic_acid#/media/File:Glutamic_Non-ionic.png
- https://en.wikipedia.org/wiki/Serine#/media/File:L-Serin_-_L-Serine.svg
2.27 Protein Quality
Proteins can be classified as either complete or incomplete. Complete proteins provide adequate amounts of all nine essential amino acids. Animal proteins such as meat, fish, milk, and eggs are good examples of complete proteins. Incomplete proteins do not contain adequate amounts of one or more of the essential amino acids. For example, if a protein doesn’t provide enough of the essential amino acid leucine it would be considered incomplete. Leucine would be referred to as the limiting amino acid, because there is not enough of it for the protein to be complete. Most plant foods are incomplete proteins, with a few exceptions such as soy. The table below shows the limiting amino acids in some plant foods.
Table 2.271 Limiting amino acids in some common plant foods1
| Food | Limiting Amino Acid(s) |
| Bean and Most Legumes | Methionine, Tryptophan |
| Tree Nuts and Seeds | Methionine, Lysine |
| Grains | Lysine |
| Vegetables | Methionine, Lysine |
Complementary Proteins
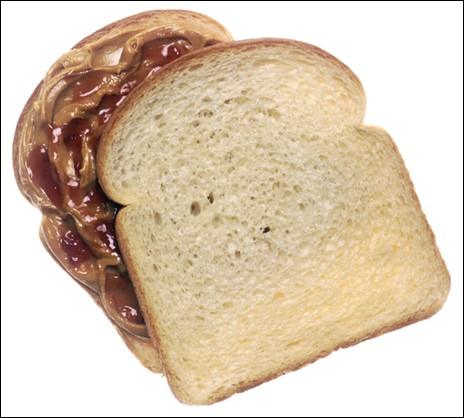
Even though most plant foods do not contain complete proteins, it does not mean that they should be sworn off as protein sources. It is possible to pair foods containing incomplete proteins with different limiting amino acids to provide adequate amounts of the essential amino acids. These two proteins are called complementary proteins, because they supply the amino acid(s) missing in the other protein. A simple analogy would be that of a 4 piece puzzle. If one person has 2 pieces of a puzzle, and another person has 2 remaining pieces, neither of them have a complete puzzle. But when they are combined, the two individuals create a complete puzzle.

Two examples of complementary proteins are shown below.
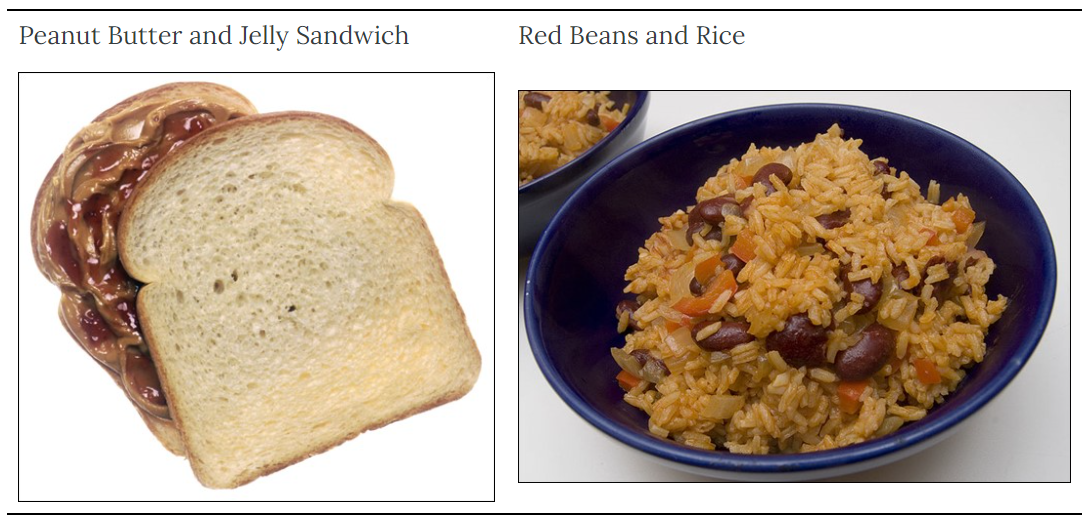
| Peanut Butter and Jelly Sandwich | Red Beans and Rice |
 |
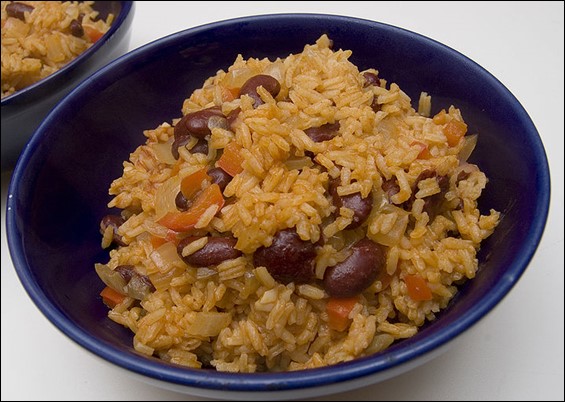 |
Figure 2.272 Two complementary protein examples2,3
It should be noted that complementary proteins do not need to be consumed at the same time or meal. It is currently recommended that essential amino acids be met on a daily basis, meaning that if a grain is consumed at one meal, a legume could be consumed at a later meal, and the proteins would still complement one another4.
Measures of Protein Quality
How do you know the quality of the protein in the foods you consume? The protein quality of most foods has been determined by one of the methods below.
Biological Value (BV) – (grams of nitrogen retained / grams of nitrogen absorbed) x 100
Protein Efficiency Ratio (PER) – (grams of weight gained / grams of protein consumed)
This method is commonly performed in growing rats.
Chemical or Amino Acid Score (AAS) – (Test food limiting essential amino acid (mg/g protein) / needs of same essential amino acid (mg/g protein))
Protein Digestibility Corrected Amino Acid Score (PDCAAS) – (Amino Acid Score x Digestibility)
This is the most widely used method and was preferred by the Food and Agriculture Organization and World Health Organization (WHO) until recently5,6.
The following table shows the protein quality measures for some common foods.
Table 2.272 Measures of protein quality5
| Protein | PER | Digestibility | AAS (%) | PDCAAS |
| Egg | 3.8 | 98 | 121 | 100* |
| Milk | 3.1 | 95 | 127 | 100* |
| Beef | 2.9 | 98 | 94 | 92 |
| Soy | 2.1 | 95 | 96 | 91 |
| Wheat | 1.5 | 91 | 47 | 42 |
*PDCAAS scores are truncated (cut off) at 100. These egg and milk scores are actually 118 and 121 respectively.
The Food and Agricultural Organization (FAO) recently recommended that PDCAAS be replaced with a new measure of protein quality, the Digestible Indispensable Amino Acid Score (DIAAS). “DIAAS is defined as: DIAAS % = 100 x [(mg of digestible dietary indispensable amino acid in 1 g of the dietary protein) / (mg of the same dietary indispensable amino acid in 1g of the reference protein)].” Ileal digestibility should be utilized to determine the digestibility in DIAAS; ideally in humans, but if not possible in growing pigs or rats6.
The main differences between DIAAS and PDCAAS are that DIAAS:
- Takes into account individual amino acids digestibility rather than protein digestibility.
- Focuses on ileal instead of fecal (total) digestibility.
- Has 3 different reference patterns (different age groups, 0-6 months, 6 months- 3 years, 3-10 years old) instead of a single pattern
- Are not truncated7
How do I find out the protein quality of what I’m eating and identify complementary proteins?
Nutrition Data is a useful resource for determining protein quality and identifying complementary proteins. To use the site, go to www.nutritiondata.com, type in the name of the food you would like to know about in the search bar and hit ‘Enter’. When you have selected your food from the list of possibilities, you will be given information about this food. Included in this information is the Protein Quality section. This will give you an amino acid score and a figure that illustrates which amino acid(s) is limiting. If your food is an incomplete protein, you can click “Find foods with a complementary profile”. This will take you to a list of dietary choices that will provide complementary proteins for your food. You can read more about this option in the link below.
| Web Link |
References & Links
- Wardlaw GM, Hampl J. (2006) Perspectives in nutrition. New York, NY: McGraw-Hill.
- https://commons.wikimedia.org/wiki/File:Peanut_butter_and_jelly_sandwich.jpg
- http://en.wikipedia.org/wiki/File:Red_beans_and_rice.jpg
- Young VR, Pellett PL. (1994) Plant proteins in relation to human protein and amino acid nutrition. Am J Clin Nutr. May; 59 (5 Suppl): 1203S-1212S.
- Schaafsma G. (2000) The protein digestibility-corrected amino acid score. J Nutr 130(7): 1865S-1867S.
- http://www.fao.org/ag/humannutrition/35978-02317b979a686a57aa4593304ffc17f06.pdf
- Rutherford SM, Fanning AC, Miller BJ, Moughan PJ. Protein Digestibility-Corrected Amino Acid Scores and Digestible Indispensable Amino Acid Scores Differentially Describe Protein Quality in Growing Male Rats. J Nutr. 145(2): 372-379.
Links
NutritionData – http://www.nutritiondata.com/
NutritionData: Protein Quality – http://nutritiondata.self.com/help/analysis-help#protein-quality
2.28 Protein-Energy Malnutrition
Protein deficiency rarely occurs alone. Instead it is often coupled with insufficient energy intake. As a result, the condition is called protein-energy malnutrition (PEM). This condition is not common in the U.S., but is more prevalent in less developed countries. Kwashiorkor and marasmus are the two forms of protein energy malnutrition. They differ in the severity of energy deficiency as shown in the figure below.
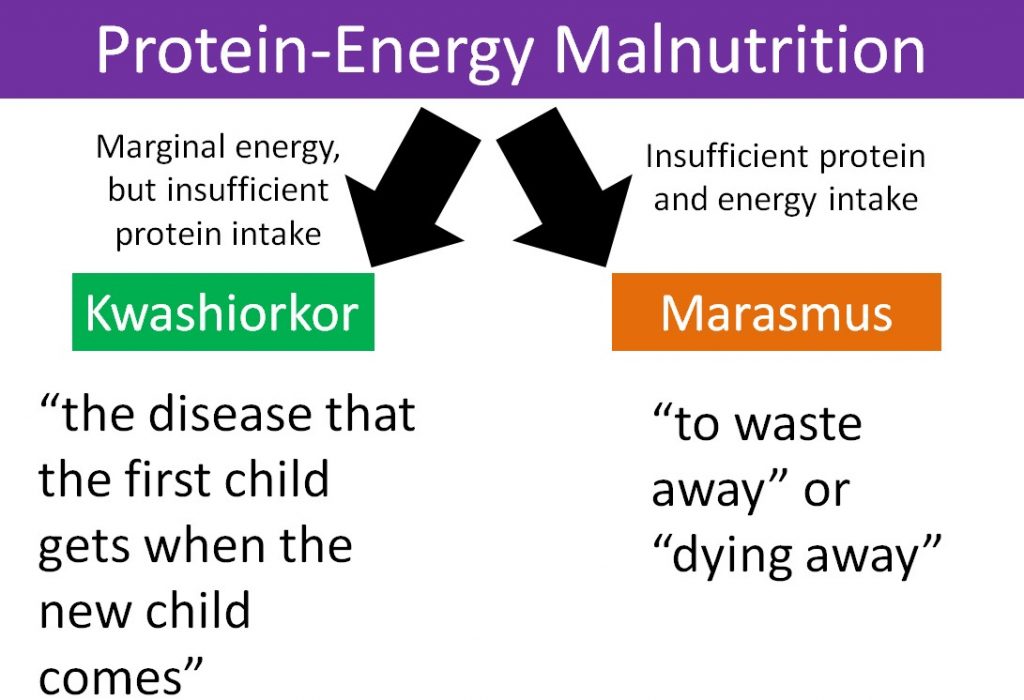
Kwashiorkor is a Ghanaian word that means “the disease that the first child gets when the new child comes1.” The characteristic symptom of kwashiorkor is a swollen abdomen. Energy intake could be adequate, but protein consumption is too low.

The video below does a nice job showing the symptoms of the condition.
| Web Link |
Marasmus means “to waste away” or “dying away”, and thus occurs in individuals who have severely limited energy intakes.

The video below shows individuals suffering from this condition.
| Web Link |
References & Links
- Byrd-Bredbenner C, Moe G, Beshgetoor D, Berning J. (2009) Wardlaw’s perspectives in nutrition. New York, NY: McGraw-Hill.
- http://en.wikipedia.org/wiki/File:Starved_girl.jpg
- http://en.wikipedia.org/wiki/File:Starved_child.jpg
Videos
Kwashiorkor – http://www.youtube.com/watch?v=eTU3iPWAWXg
Marasmus – https://www.youtube.com/watch?v=LDCi3eda4WM
2.3 Lipids
Lipids, commonly referred to as fats, have a poor reputation among some people, in that “fat free” is often synonymous with healthy. We do need to consume certain fats and we should try to incorporate some fats into our diets for their health benefits. However, consumption of certain fats is also associated with greater risk of developing chronic disease(s). In this section we will dive deeper into fats and why they do not need to be feared altogether.
Subsections:
2.31 How does fat differ from lipids?
2.32 Fatty Acids
2.33 Fatty Acid Naming & Food Sources
2.34 Essential Fatty Acids
2.35 Triglycerides
2.36 Phospholipids
2.37 Sterols
2.31 How Does Fat Differ From Lipids?
The answer you receive from this question will depend on who you ask, so it is important to have an understanding of lipids and fats from a chemical and nutritional perspective.
To a chemist, lipids consist of:
Triglycerides
Fatty Acids
Phospholipids
Sterols
These compounds are grouped together because of their structural and physical property similarities. For instance, all lipids have hydrophobic (water-fearing) properties. Chemists further separate lipids into fats and oils based on their physical properties at room temperature:
Fats are solid at room temperature
Oils are liquid at room temperature
From a nutritional perspective, the definition of lipids is the same. The definition of a fat differs, however, because nutrition-oriented people define fats based on their caloric contribution rather than whether they are solid at room temperature. Thus, from a nutrition perspective:
Fats are triglycerides, fatty acids, and phospholipids that provide 9 kcal/g.
The other difference is that from a caloric perspective, an oil is a fat. For example, let’s consider olive oil. Clearly, it is an oil according to a chemist definition, but from a caloric standpoint it is a fat because it provides 9 kcal/g.
The following sections will discuss the different lipid classes introduced above in detail.
2.32 Fatty Acids
Fatty acids are lipids themselves, and they are also components of triglycerides and phospholipids. Like carbohydrates, fatty acids are made up of carbon (C), hydrogen (H), and oxygen (O).
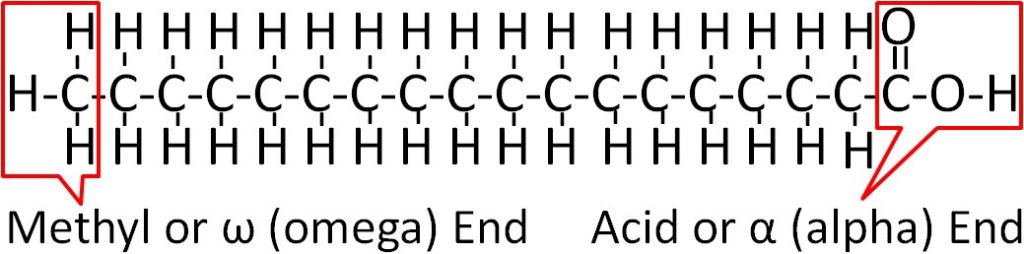
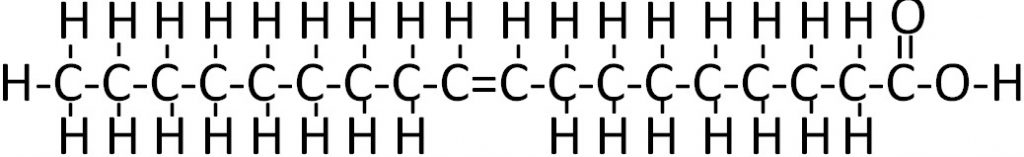
On one end of a fatty acid is a methyl group (CH3) that is known as the methyl or omega end. On the opposite end of a fatty acid is a carboxylic acid (COOH). This end is known as the acid or alpha end. The figure below shows the structure of fatty acids.
There are a number of fatty acids in nature that we consume that differ from one another in three ways:
- Carbon chain length (i.e. 6 carbons, 18 carbons)
- Saturation/unsaturation
- Double bond configuration (cis, trans)
1. Carbon Chain Length
Fatty acids differ in their carbon chain length (number of carbons in the fatty acid). Most fatty acids contain somewhere between 4-24 carbons, with even numbers (i.e. 8, 18) of carbons occurring more frequently than odd numbers (i.e. 9, 19). Fatty acids are classified as short-chain fatty acids, medium-chain fatty acids, and long-chain fatty acids based on their carbon chain length using the criteria shown in the table below.
Table 2.321 Fatty acid classification
| Classification | # of carbons |
| Short-Chain Fatty Acid | < 6 |
| Medium-Chain Fatty Acid | 6-12 |
| Long-Chain Fatty Acid | ≥12 |
Carbon chain length also impacts the physical properties of the fatty acid. As the number of carbons in a fatty acid chain increases, so does the melting point as illustrated in the figure below.
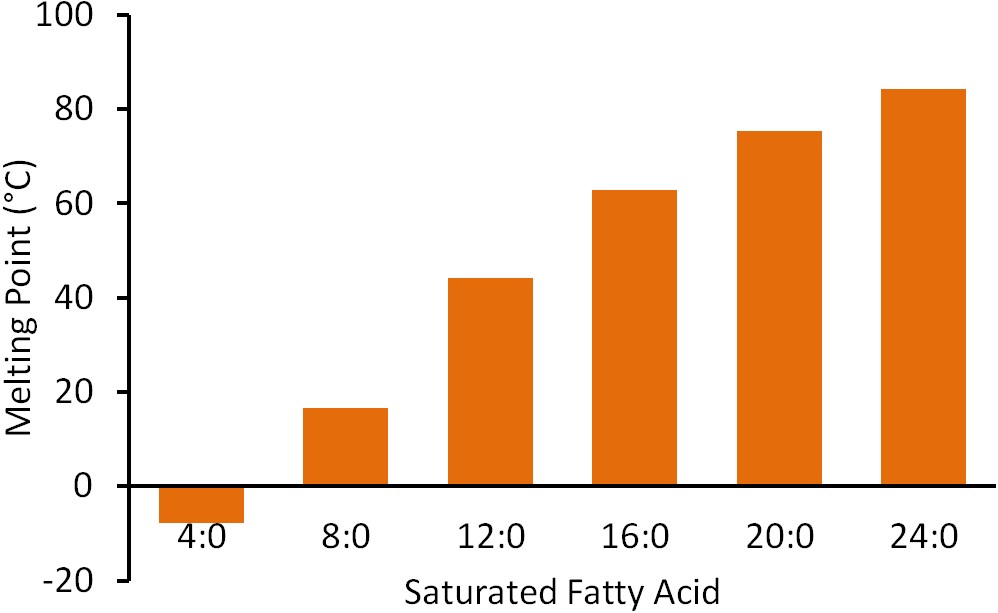
Thus, shorter chain fatty acids are more likely to be liquid, while longer chain fatty acids are more likely to be solid at room temperature (20-25ᐤC, 68-77ᐤF).
2. Saturation/Unsaturation
A saturated fatty acid is one that contains the maximum number of hydrogens possible, and no carbon-carbon double bonds. Carbon normally has four bonds to it. Thus, a saturated fatty acid has hydrogens at every position except carbon-carbon single bonds and carbon-oxygen bonds on the acid end. Two examples of the same 18 carbon saturated fatty acid (stearic acid/stearate) are shown in Figures 2.321 and 2.323. Figure 2.323 is the simplified view of the this fatty acid.

Unsaturation means the fatty acid doesn’t contain the maximum number of hydrogens on each of its carbons. Instead, unsaturated fatty acids contain a carbon-carbon double bond and only 1 hydrogen off each carbon. The simplest example of unsaturation is a monounsaturated fatty acid. Mono means one, so these are fatty acids with one degree of unsaturation, or one double bond (shown below).

Any fatty acid that has two or more double bonds is considered a polyunsaturated fatty acid. As you may remember from the polysaccharide section, poly means many. A simple example of a polyunsaturated fatty acid is linoleic acid (shown below).

3. Double Bond Configuration (Shape)
Double bonds in unsaturated fatty acids are in one of two structural orientations: cis or trans. In a trans orientation, the hydrogens on the carbons involved in the double bond are opposite of one another. In the cis orientation the hydrogens are on the same side of the bond. Steric hindrance in the cis orientation causes the chain to take on a more bent shape.
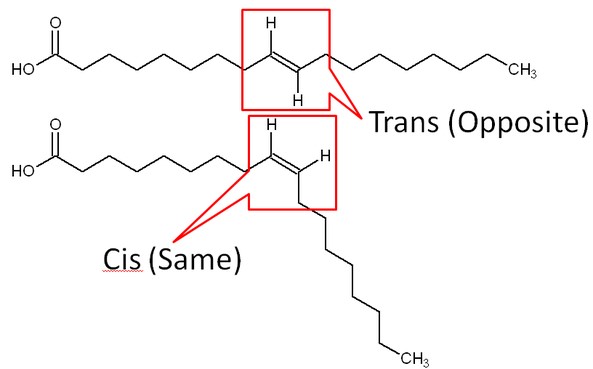
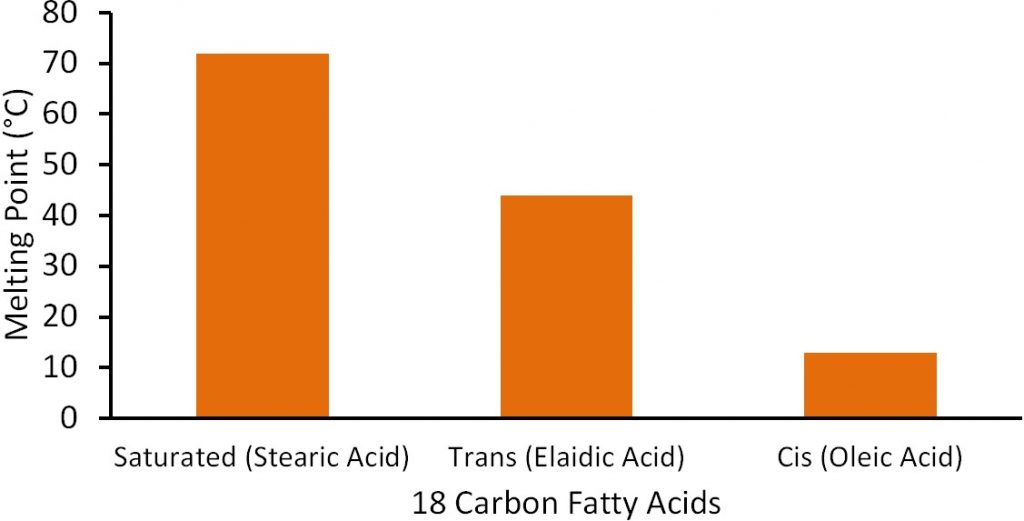
Most natural unsaturated fatty acids are in the cis conformation. As can be seen in Figure 2.327, the cis fatty acids have a more of kinked shape, which means they do not pack together as well as the saturated or trans fatty acids. As a result, the melting point is much lower for cis fatty acids compared to trans and saturated fatty acids. To illustrate this difference, the figure below shows the difference in the melting points of saturated, trans-, and cis-monounsaturated 18 carbon fatty acids.
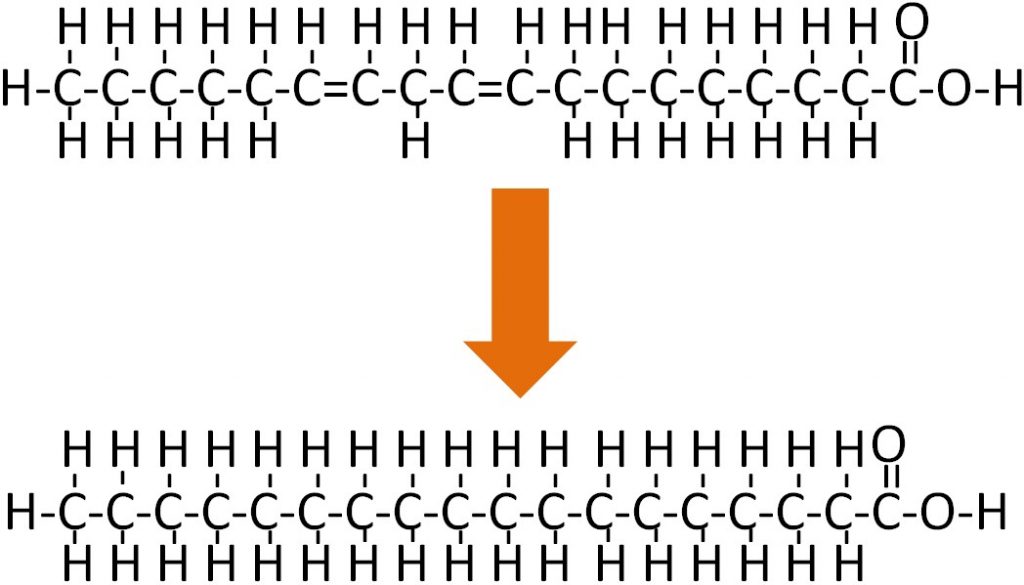
There are some naturally occurring trans fatty acids, such as conjugated linoleic acid (CLA), in dairy products. However, for the most part, trans fatty acids in our diets are not natural; instead, they have been produced synthetically. The primary source of trans fatty acids in our food supply is partially hydrogenated vegetable oil. The ‘hydrogenated’ means that the oil has gone through the process of hydrogenation. Hydrogenation, like the name implies, is the addition of hydrogen. If an unsaturated fatty acid is completely hydrogenated it would be converted to a saturated fatty acid as shown below.
However, this isn’t/wasn’t always desirable, thus partially hydrogenated vegetable oil became widely used. To visualize the difference in the amount of hydrogenation consider the difference between tub margarine and stick margarine.
Stick margarine is more fully hydrogenated leading it to have a much harder texture. This is one of the two reasons to hydrogenate, to get a more solid texture. The second reason is that it makes it more shelf-stable, because the double bond(s) of unsaturated fatty acids are susceptible to oxidation, which causes them to become rancid.
Partial hydrogenation causes the conversion of cis to trans fatty acids along with the formation of some saturated fatty acids. Originally, it was thought that trans fatty acids would be a better alternative to saturated fat (think margarine vs. butter). However, it turns out that trans fat is actually worse than saturated fat in altering biomarkers associated with cardiovascular disease. Trans fat increases LDL and decreases HDL levels, while saturated fat increased LDL without altering HDL levels. But this does not mean that butter is a better choice than margarine as described in the first link. The FDA revoked Generally Recognized as Safe (GRAS) status of partially hydrogenated vegetable oil as described in the second link, and is requiring its use to be phased out by 2018. After that point, permission will need to be requested to use them in foods.
| Web Links |
References & Links
- Beare-Rogers J, Dieffenbacher A, Holm JV. (2001) Lexicon of lipid nutrition. Pure Appl Chem 73(4): 685-744.
- http://en.wikipedia.org/wiki/File:Stearic_acid.svg
- http://en.wikipedia.org/wiki/File:Lauric_acid.png
- https://en.wikipedia.org/wiki/Oleic_acid#/media/File:Oleic-acid-based-on-xtal-1997-2D-skeletal.png
- http://en.wikipedia.org/wiki/File:Linoleic_acid.png
Links
Butter vs. Margarine: Which is better for my heart? – http://www.mayoclinic.org/butter-vs-margarine/expert-answers/FAQ-20058152
FDA to Limit Trans Fats in Foods – http://www.nbcnews.com/health/health-news/fda-limit-trans-fats-food-n376266
2.33 Fatty Acid Naming & Food Sources
There are three naming systems used for fatty acids:
- Delta nomenclature
- Omega nomenclature
- Common names
The omega nomenclature and common names are used more in the field of nutrition than the delta nomenclature when describing specific fatty acids.
2. Delta Nomenclature
For delta nomenclature you need to know 3 things:
- Number of carbons in the fatty acid
- Number of double bonds
- Number of carbons from the carboxylic acid (alpha) end to the first carbon in the double bond(s)
Let’s consider the example in the figure below.
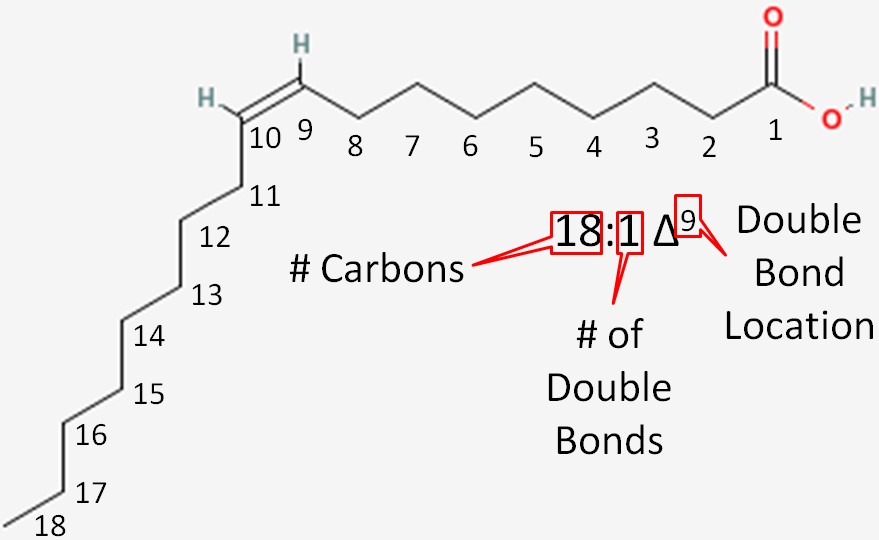
- Number of carbons in the fatty acid = 18
- Number of double bonds = 1
- Number of carbons from the carboxylic acid end to the first carbon in the double bond = 9
This is then written as shown in Figure 2.331.
2. Omega Nomenclature
The omega nomenclature is almost exactly the same as the delta nomenclature, the only differences being:
- Carbons are counted from the methyl (omega) end instead of the carboxylic acid end
- The omega symbol is used instead of the delta symbol
For omega nomenclature you need to know 3 things:
- Number of carbons in the fatty acid
- Number of double bonds
- Number of carbons from the methyl end (aka Omega end) to the first carbon in the double bond closest to the methyl end
We will again consider the same fatty acid.
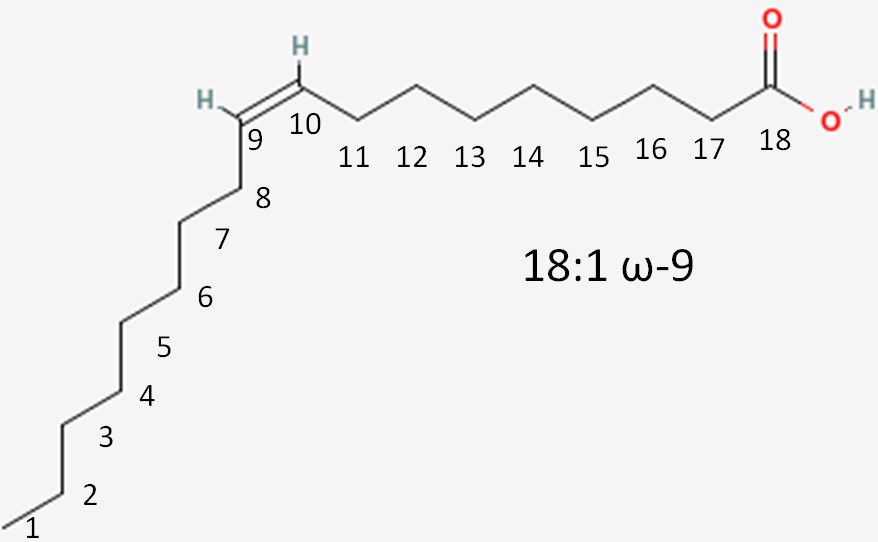
- Number of carbons in the fatty acid = 18
- Number of double bonds = 1
- Number of carbons from the methyl (aka omega) end to the first carbon in the double bond closest to the methyl end = 9
If it is a saturated fatty acid, then the omega nomenclature is not added to the end of the name. If it is an 18 carbon saturated fatty acid, then it would be named 18:0.
This is written as shown in figure 2.332. Instead of an omega prefix, the prefix n- (i.e. n-3) is also commonly used.
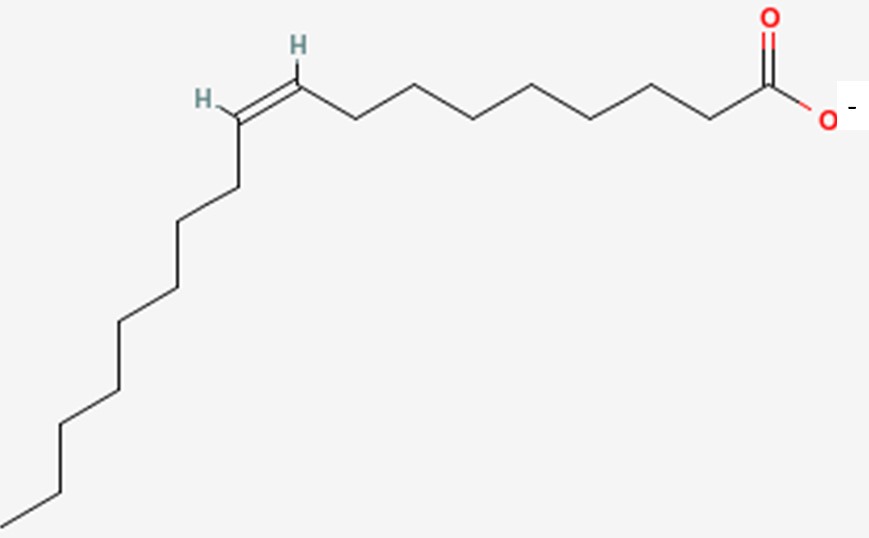
3. Common Names
The common names of fatty acids are something that, for the most part, have to be learned/memorized. The common name of the fatty acid we have been naming in this section is oleic acid.
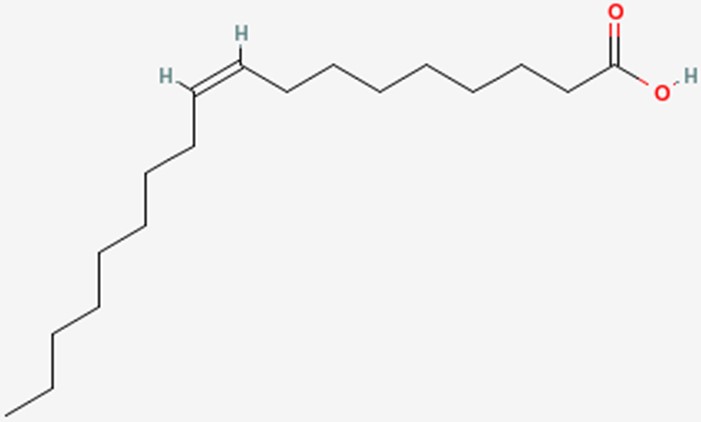
However, it can also be called oleate. The only difference is that, instead of a carboxylic acid on the end of the fatty acid, it has been ionized to form a salt (shown below). This is what the -ate ending indicates and the two names are used interchangeably.
The table below gives the common names and food sources of some common fatty acids.
Table 2.331 Common names of fatty acids2
| Omega Name | Common Name |
| 4:0 | Butyric Acid |
| 12:0 | Lauric Acid |
| 14:0 | Myristic Acid |
| 16:0 | Palmitic acid |
| 18:0 | Stearic Acid |
| 20:0 | Arachidic Acid |
| 24:0 | Lignoceric Acid |
| 18:1 (n-9) | Oleic Acid |
| 18:2 (n-6) | Linoleic Acid |
| 18:3 (n-3) | Alpha-linolenic Acid |
| 20:4 (n-6) | Arachidonic Acid |
| 20:5 (n-3) | Eicosapentanoic Acid |
| 22:6 (n-3) | Docosahexanoic Acid |
The NutritionData link below can help you identify foods that are high in a specific fatty acid.
| Web Link |
Food Sources of Fatty Acids
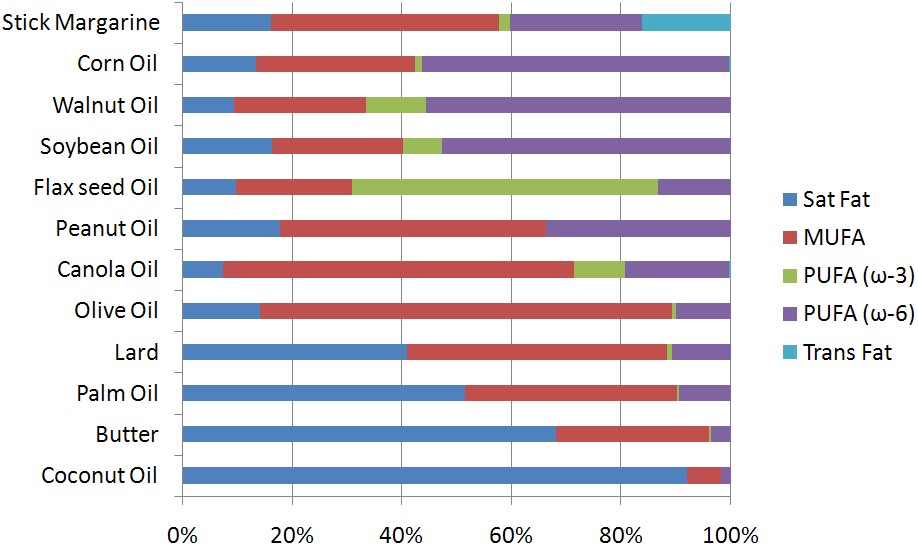
After going through this wide array of fatty acids, you may be wondering where they are found in nature. The figure below shows the fatty acid composition of certain oils and oil-based foods. As you can see, most foods contain a mixture of fatty acids. Stick margarine is the only product in the figure that contains an appreciable amount of trans fatty acids. Corn, walnut, and soybean are rich sources of n-6 polyunsaturated fatty acids, while flax seed is fairly unique among plants in that it is a good source of n-3 polyunsaturated fatty acids. Canola and olive oil are rich sources of monounsaturated fatty acids. Lard, palm oil, butter and coconut oil all contain a significant amount of saturated fatty acids.
References & Links
- http://en.wikipedia.org/wiki/File:Myristoleic_acid.png
- Gropper SS, Smith JL, Groff JL. (2008) Advanced nutrition and human metabolism. Belmont, CA: Wadsworth Publishing.
- www.nutritiondata.com
Links
Nutrition Data: Fatty Acids – http://nutritiondata.self.com/topics/fatty-acids
2.34 Essential Fatty Acids & Eicosanoids
The two essential fatty acids are:
- linoleic acid (omega-6)
- alpha-linolenic (omega-3)
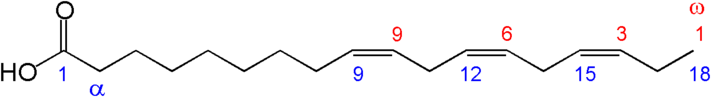
These fatty acids are essential because we can not synthesize them. This is because we do not have an enzyme capable of adding a double bond (desaturating) beyond the omega-9 carbon counting from the alpha end (the omega-6 and 3 positions). The structures of the two essential fatty acids are shown below.

However, we do possess enzymes that can take the essential fatty acids, elongate them (add two carbons to them), and then further desaturate them (add double bonds) to other omega-6 and omega-3 fatty acids. Thus, there are 2 families of fatty acids that the majority of polyunsaturated fatty acids fit into as shown below.
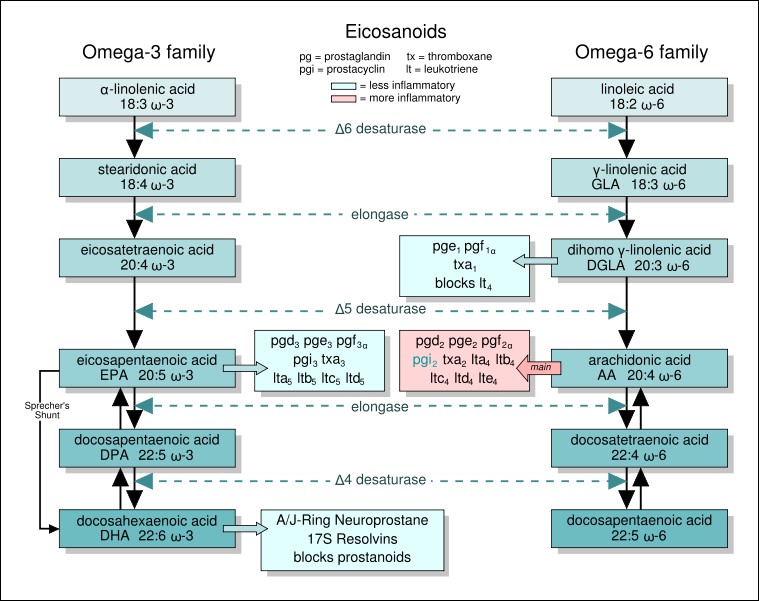
The same enzymes are used for both omega-6 and omega-3 fatty acids. However, we cannot convert omega-3 fatty acids to omega-6 fatty acids or omega-6 fatty acids to omega-3 fatty acids. Among these families, the omega-3 fatty acid, eicosapentaenoic acid (EPA), and the omega-6 fatty acids, dihomo gamma-linolenic acid and arachidonic acid (AA), are used to form compounds known as eicosanoids. These 20 carbon fatty acid derivatives are biologically active in the body (like hormones, but they act locally in the tissue they are produced). There are four classes of eicosanoids:
Prostaglandins (PG)
Prostacyclins (PC)
Thromboxanes (TX)
Leukotrienes (LT)
Some examples of eicosanoid structures are shown in the figure below:
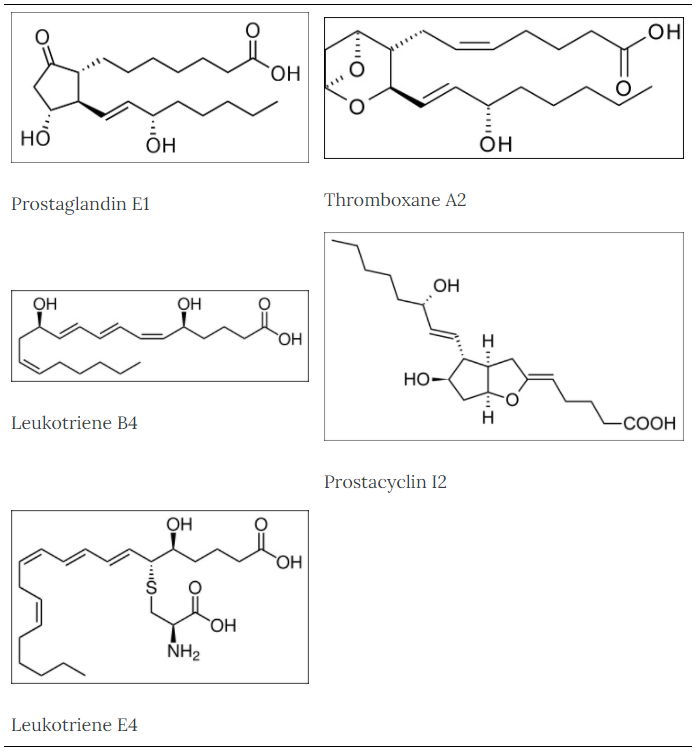
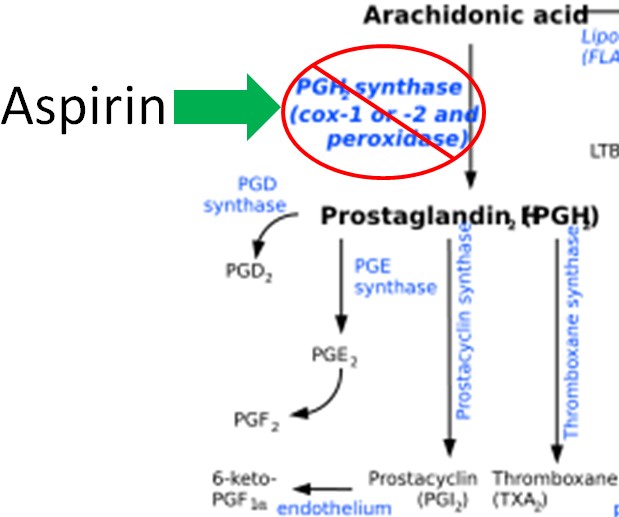
Figure 2.344 Eicosanoid structures4-8The difference in the effects and outcomes of omega-6 and omega-3 fatty acid intake is primarily a result of the eicosanoids produced from them. Omega-6 fatty acid derived eicosanoids are more inflammatory than omega-3 fatty acid derived eicosanoids. As a result, omega-3 fatty acids are considered anti-inflammatory because replacing the more inflammatory omega-6 fatty acid derived eicosanoids with omega-3 fatty acid derived eicosanoids will decrease inflammation. As an example of the action of eicosanoids, aspirin works by inhibiting the enzymes cyclooxygenase (Cox)-1 and Cox-2. These enzymes convert arachidonic acid into inflammatory prostaglandins as shown below.
You have probably heard that you should get more omega-3s in your diet, and in general polyunsaturated fatty acids are considered healthy. However, since omega-3 fatty acids are competing for the same enzymes as omega-6 fatty acids, and because the omega-6 fatty acids are more inflammatory, consuming too many omega-6s is probably more detrimental than helpful. As a result, many people talk about the omega-3:omega-6 fatty acid ratio in people’s’ diets. For most Americans, the ratio is believed to be too high, at almost 10-20 times more omega-6 fatty acids than omega-3 fatty acids10. The table below shows good food sources of some selected omega-3 and omega-6 fatty acids.Table 2.341 Good food sources of selected omega-3 and omega-6 fatty acidsEven though Figure 2.343 illustrates the conversion of alpha-linolenic acid to EPA and DHA, this conversion is actually quite limited; 0.2-8% of ALA is converted to EPA and 0-4% of ALA is converted to DHA11. Thus, dietary consumption is the most effective way to get the longer chain fatty acids (EPA and DHA) in our bodies. It is less clear whether ALA consumption is as beneficial as EPA and DHA, but a recent study found it to be equally effective in decreasing blood triglyceride concentrations. In that study, DHA had the added positive benefit of increasing HDL12. These are all positive outcomes that are expected to reduce the risk of developing cardiovascular disease. However, there is evidence accumulating that there is not much cardiovascular benefit from taking fish oil supplements as described in the article below.Essential Fatty Acid Deficiency Essential fatty acid deficiency is rare and unlikely to occur, but the symptoms are:Growth retardationReproductive problemsSkin lesionsNeurological and visual problemsReferences & Links
- http://en.wikipedia.org/wiki/File:LAnumbering.png
- http://en.wikipedia.org/wiki/File:ALAnumbering.png
- http://en.wikipedia.org/wiki/File:EFA_to_Eicosanoids.svg
- http://en.wikipedia.org/wiki/File:Prostaglandin_E1.svg
- http://en.wikipedia.org/wiki/File:Thromboxane_A2.png
- http://en.wikipedia.org/wiki/File:Leukotriene_B4.svg
- http://en.wikipedia.org/wiki/File:Prostaglandin_I2.png
- http://en.wikipedia.org/wiki/File:Leukotriene_E4.svg
- http://en.wikipedia.org/wiki/File:Eicosanoid_synthesis.svg
- Simopoulos AP. (2008) The importance of the omega-6/omega-3 fatty acid ratio in cardiovascular disease and other chronic diseases. Exp Biol Med 233(6): 674.
- Arterburn LM, Hall EB, Oken, H. (2006) Distribution, interconversion, and dose response of n-3 fatty acids in humans. Am J Clin Nutr 83(suppl) 1467.
12. Egert S, Kannenberg F, Somoza V, Erbersdobler H, Wahrburg U. (2009) Dietary alpha-linolenic acid, EPA, and DHA have differential effects on LDL fatty acid composition but similar effects on serum lipid profiles in normolipidemic humans. J Nutr 139(5): 861.
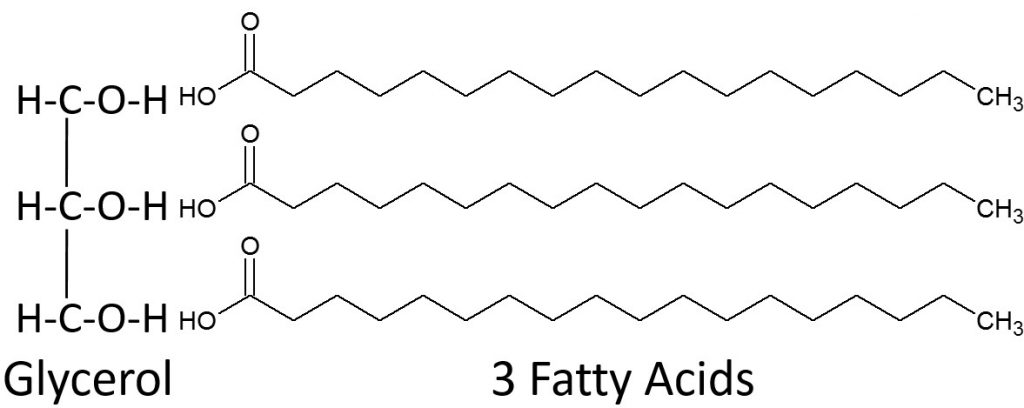
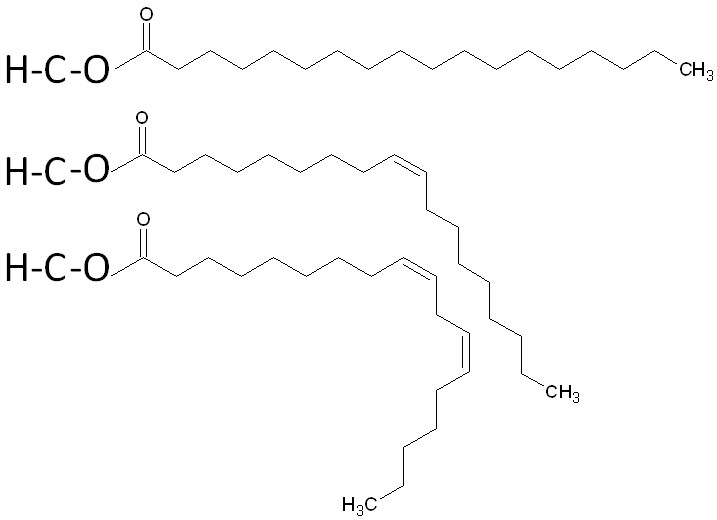
LinksFish Oil Claims Not Supported by Research – http://well.blogs.nytimes.com/2015/03/30/fish-oil-claims-not-supported-by-research/2.35 TriglyceridesTriglycerides are the most common lipid in our bodies and in the foods we consume. Fatty acids are not typically found free in nature, instead they are found in triglycerides. Breaking down the name triglyceride tells a lot about their structure. “Tri” refers to the three fatty acids, “glyceride” refers to the glycerol backbone that the three fatty acids are bonded to. Thus, a monoglyceride contains one fatty acid, a diglyceride contains two fatty acids. Triglycerides perform the following functions in our bodies:Provide energyPrimary form of energy storage in the bodyInsulate and protectAid in the absorption and transport of fat-soluble vitamins.A triglyceride is formed by three fatty acids being bonded to glycerol as shown below.
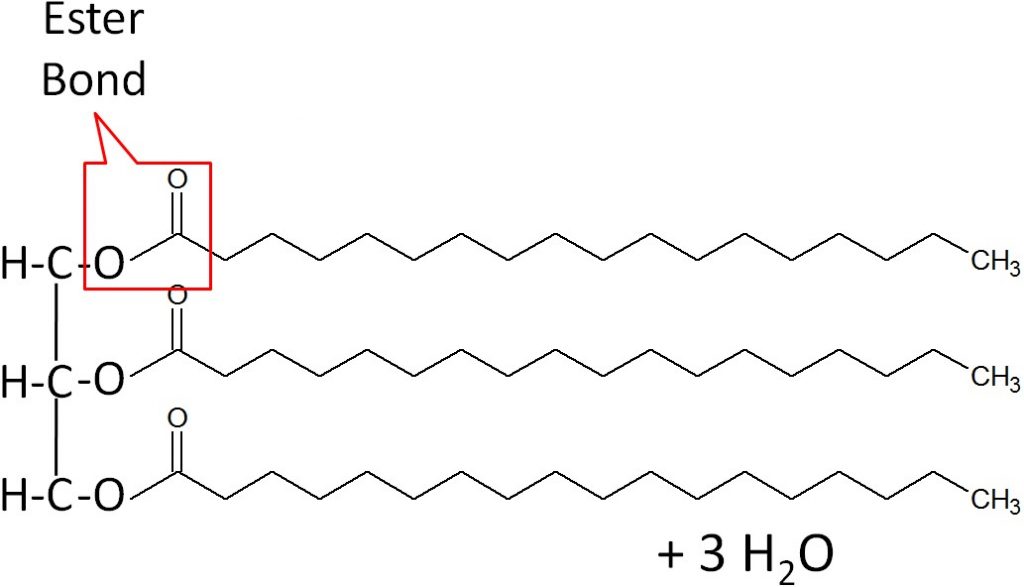
When a fatty acid is added to the glycerol backbone, this process is called esterification. This process is so named, because it forms an ester bond between each fatty acid and the glycerol. Three molecules of water are also formed during this process as shown below.
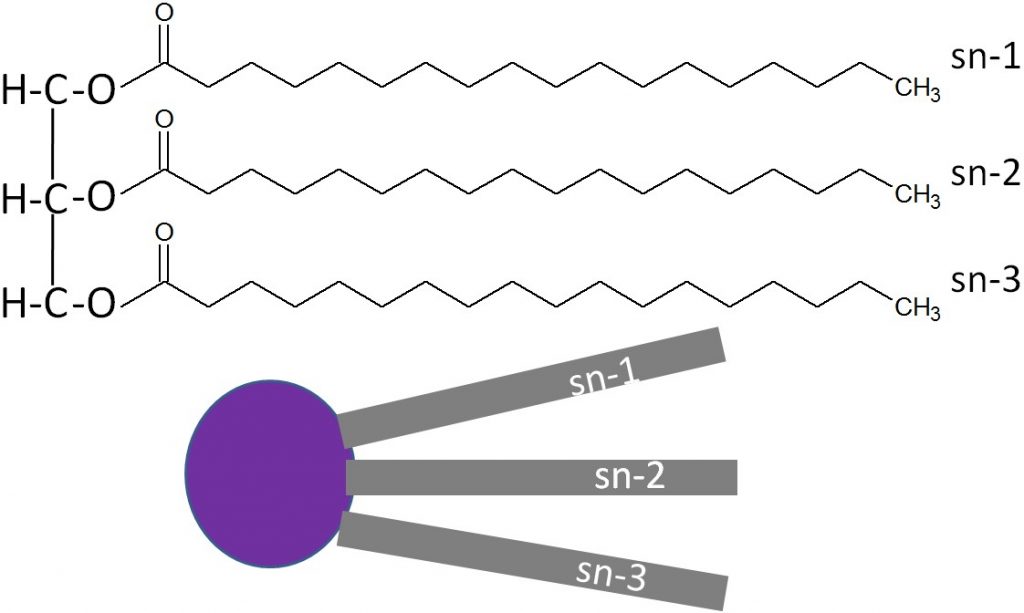
A stereospecific numbering (sn) system is used to number the three fatty acids in a triglyceride sn-1, sn-2, and sn-3 respectively. A triglyceride can also be simply represented as a polar (hydrophilic) head, with 3 nonpolar (hydrophobic) tails, as shown below.
The three fatty acids in a triglyceride can be the same or can each be a different fatty acid. A triglyceride containing different fatty acids is known as a mixed triglyceride. An example of a mixed triglyceride is shown below.
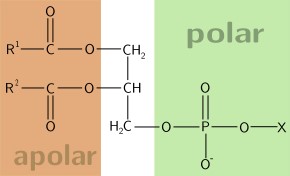
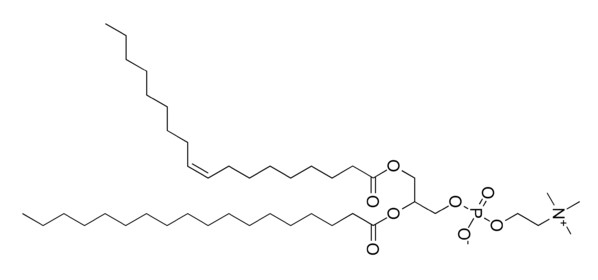
No References2.36 PhospholipidsPhospholipids are similar in structure to triglycerides, with the only difference being a phosphate group and nitrogen-containing compound in the place of a fatty acid.
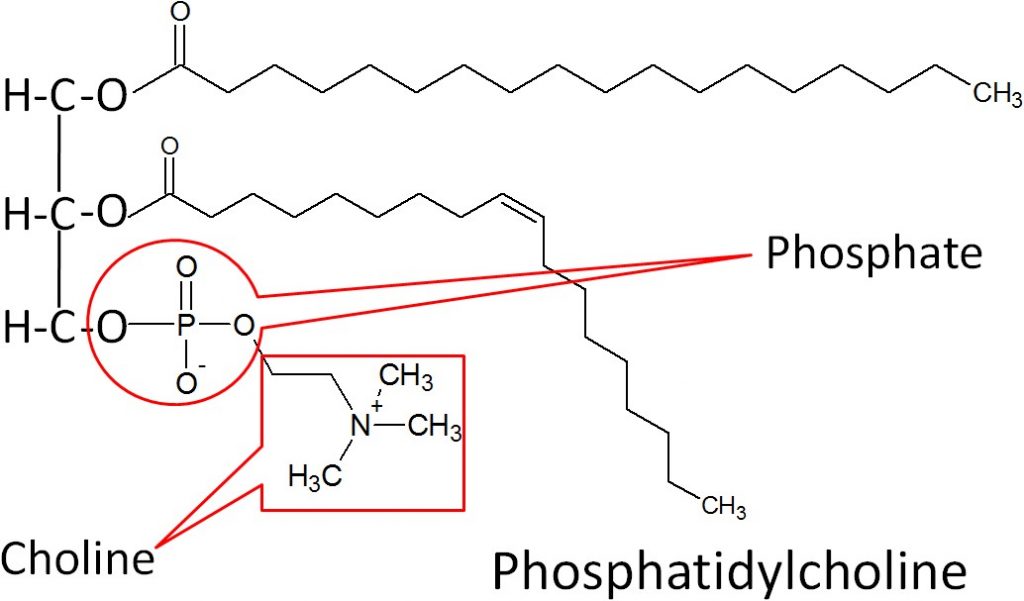
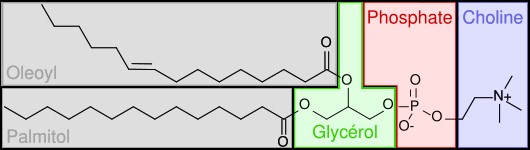
The best known phospholipid is phosphatidylcholine (aka lecithin). As you can see in the structure below, it contains a choline off of the phosphate group.
However, you will not normally find phospholipids arranged like a triglyceride, with the 3 tails opposite of the glycerol head. This is because the phosphate/nitrogen tail of the phospholipid is polar. Thus, the structure will look like the 2 figures below.
Similar to triglycerides, phospholipids are also represented as a hydrophilic head with two hydrophobic tails as shown below.

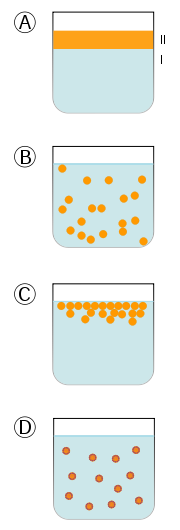
Phospholipid FunctionsBecause its structure allows it to be at the interface of water-lipid environments, there are two main functions of phospholipids:
- Key Component of the Cell’s Lipid Bilayer
- Emulsification
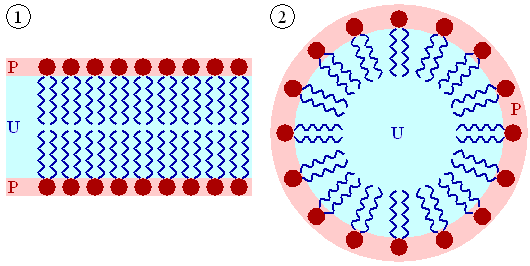
Number 1 in the figure below is a cell’s lipid bilayer, while 2 is a micelle that is formed by phospholipids to assist in emulsification.
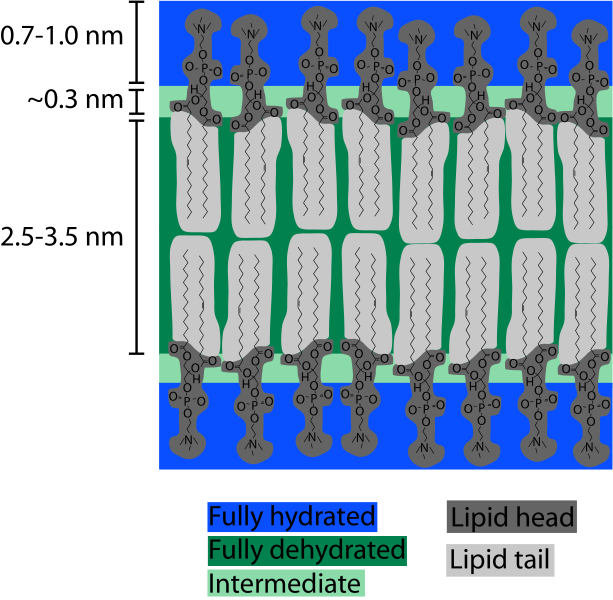
1. Key Component of Cells’ Lipid BilayersPhospholipids are an important component of the lipid bilayers of cells. A cross section of a lipid bilayer is shown below. The hydrophilic heads are on the outside and inside of the cell; the hydrophobic tails are in the interior of the cell membrane.
2. EmulsificationAs emulsifiers, phospholipids help hydrophobic substances mix in a watery environment. It does this by forming a micelle as shown below. The hydrophobic substance is trapped on the interior of the micelle away from the aqueous environment.
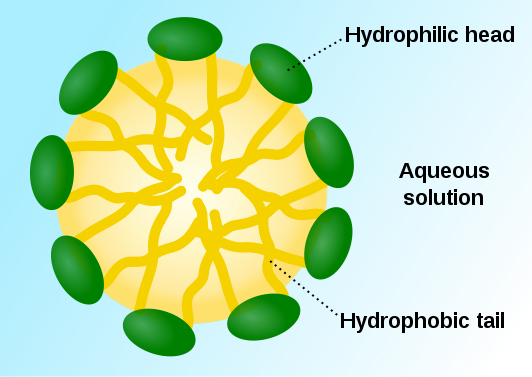
As a result, it can take a hydrophobic liquid (oil) and allow it to mix with hydrophilic liquid (water).
Foods rich in phosphatidylcholine include: egg yolks, liver, soybeans, wheat germ, and peanuts8. Egg yolks serve as an emulsifier in a variety of recipes. Your body makes all the phospholipids that it needs, so they do not need to be consumed (not essential).References & Links
- http://en.wikipedia.org/wiki/File:Phospholipid.svg
- http://commons.wikimedia.org/wiki/File:Popc_details.svg
- http://en.wikipedia.org/wiki/File:Phosphatidylcholine.png
- http://en.wikipedia.org/wiki/File:Lipid_bilayer_and_micelle.png
- http://en.wikipedia.org/wiki/File:Bilayer_hydration_profile.svg
- https://en.wikipedia.org/wiki/Micelle#/media/File:Micelle_scheme-en.svg
- http://en.wikipedia.org/wiki/File:Emulsions.svg
- Byrd-Bredbenner C, Moe G, Beshgetoor D, Berning J. (2009) Wardlaw’s perspectives in nutrition. New York, NY: McGraw-Hill.
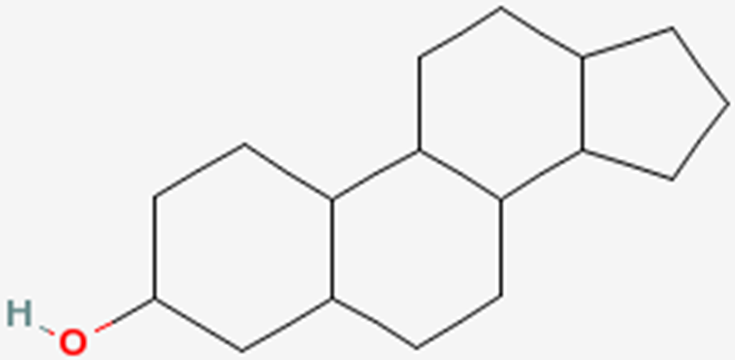
2.37 SterolsThe last category of lipids are the sterols. Their structure is quite different from the other lipids because sterols are made up of a number of carbon rings. The generic structure of a sterol is shown below.
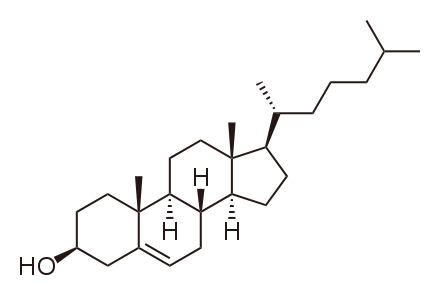
The primary sterol that we consume is cholesterol. The structure of cholesterol is shown below.
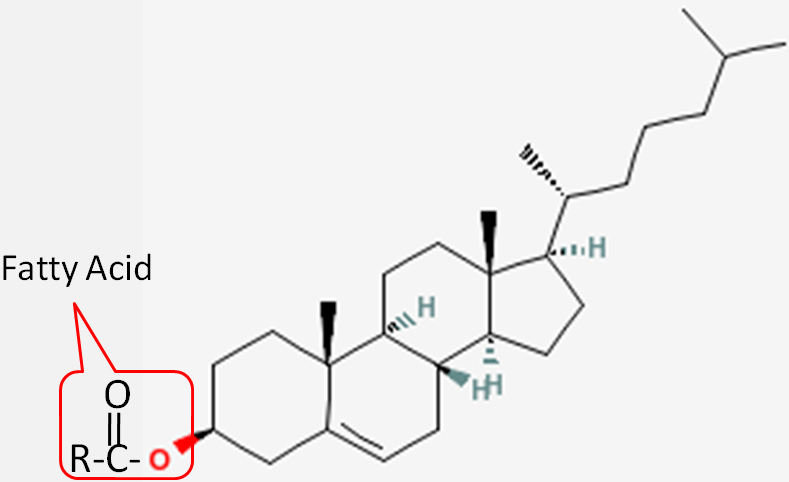
Cholesterol is frequently found in foods as a cholesterol ester, meaning that there is a fatty acid attached to it. The structure of a cholesterol ester is shown below.
All sterols have a similar structure to cholesterol. Cholesterol is only found in foods of animal origin. If consumers were more knowledgeable, intentionally misleading practices, such as labeling a banana “cholesterol free”, would not be as widespread as they currently are today.Function Although cholesterol has acquired the status of a nutrition “villain”, it is a vital component of cell membranes and is used to produce vitamin D, hormones, and bile acids. You can see the similarity between the structures of vitamin D and estradiol, one of the forms of estrogen shown below.
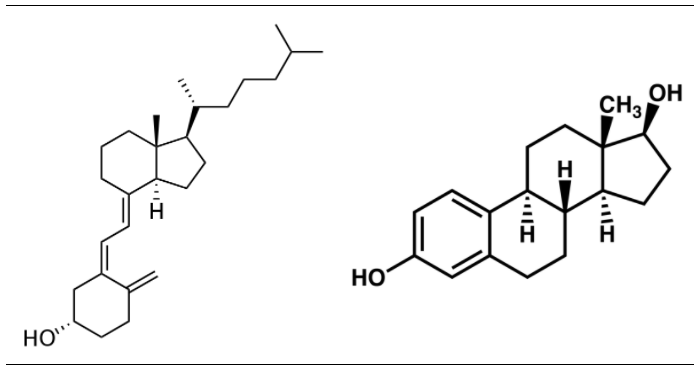
 |
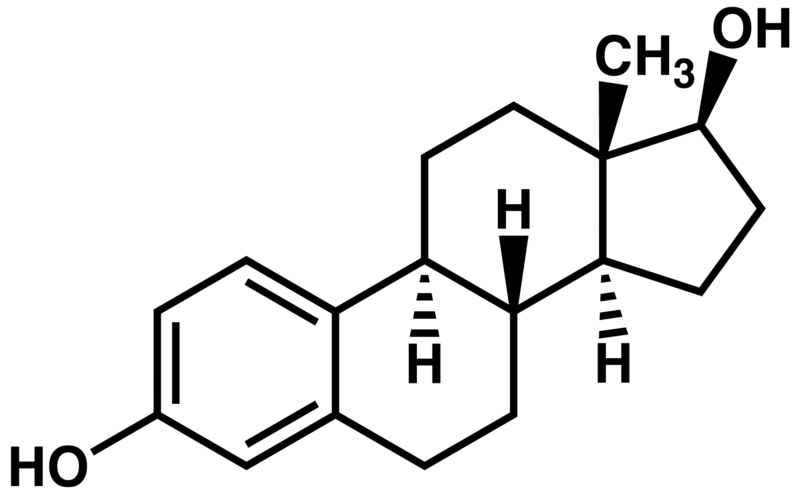 |
Figure 2.373 Structures of vitamin D3 and estradiol (a form of estrogen)2,3
We do not need to consume any cholesterol from our diets (not essential) because our bodies have the ability to synthesize the required amounts. The figure below gives you an idea of the cholesterol content of a variety of foods.
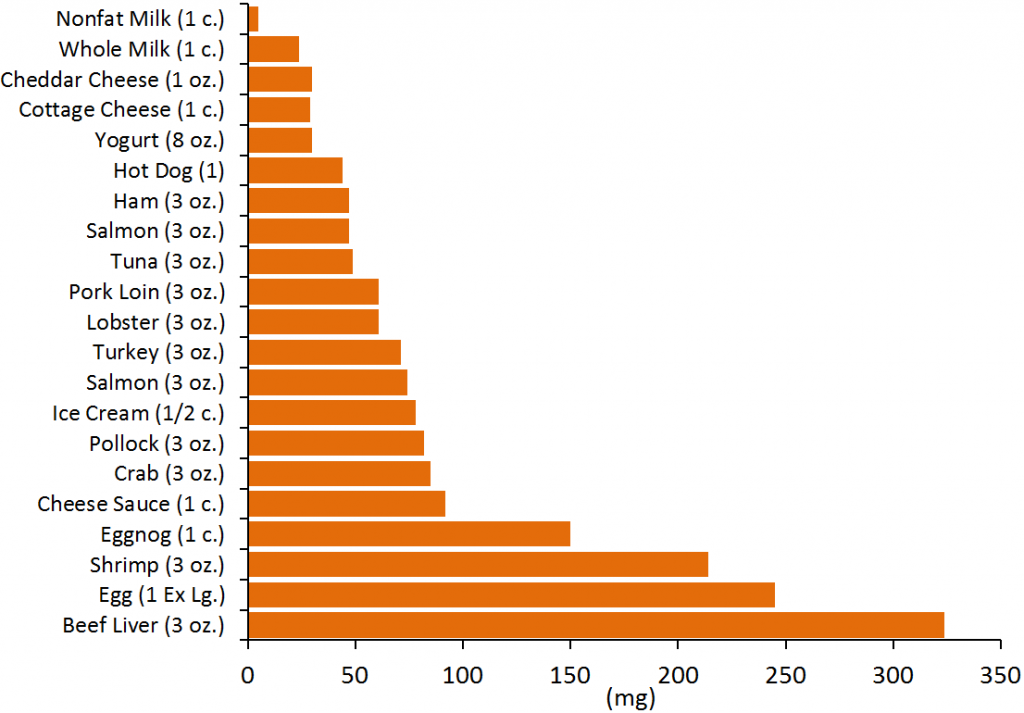
There is neither bad nor good cholesterol, despite these descriptions being commonly used for LDL and HDL, respectively. Cholesterol is cholesterol. HDL and LDL contain cholesterol but are actually lipoproteins that will be described later in chapter 4.References & Links
- http://en.wikipedia.org/wiki/File:Cholesterol.svg
- http://en.wikipedia.org/wiki/File:Cholecalciferol.svg
- http://en.wikipedia.org/wiki/File:Estradiol2.png
4. http://ndb.nal.usda.gov/
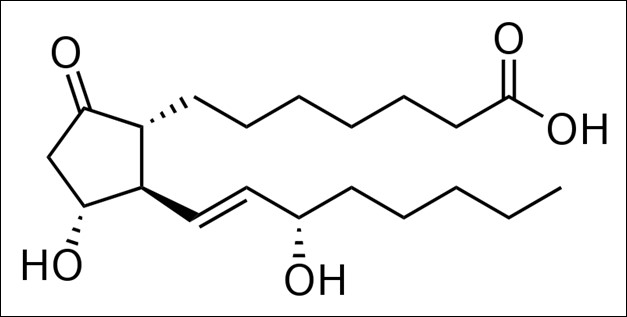
Prostaglandin E1 |
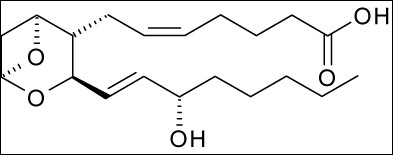
Thromboxane A2 |
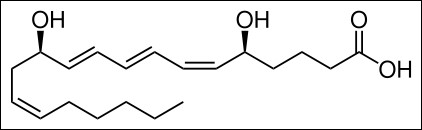
Leukotriene B4 |
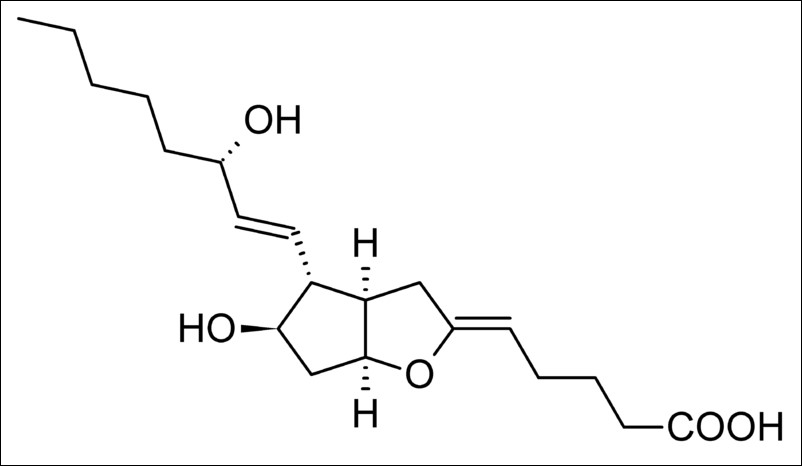
Prostacyclin I2 |
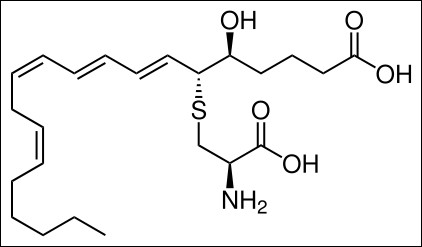
Leukotriene E4 |
|
| Fatty Acid | Good Food Sources |
| Linoleic Acid (LA, n-6) | Safflower Oil, Corn Oil, Sunflower Oil |
| Arachidonic Acid (AA, n-6) | Eggs, Meat |
| Alpha-Linolenic Acid (ALA, n-3) | Walnuts, Flaxseed (linseed), Canola (rapeseed), and Soybean Oils |
| Eicosapentaenoic Acid (EPA, n-3) | Fatty Fish & Fish Oils |
| Docosahexanoic Acid (DHA, n-3) | Fatty Fish & Fish Oils |
| Web Link | |
