Main Body
Electrolyte Micronutrients
In this chapter, electrolytes will be explained before learning more about the 4 electrolyte micronutrients. Then, hypertension will be discussed, along with the impact of these micronutrients on the condition.
Subsections:
13.1 Electrolytes
13.2 Sodium
13.3 Chloride
13.4 Potassium
13.5 Magnesium
13.6 Hypertension, Salt-Sensitivity & the DASH Diet
13.1 Electrolytes
Electrolytes are compounds that separate into ions (molecules with a charge) in water. Electrolytes can be separated into 2 classes:
Cations: ions that have a positive charge
Anions: ions that have a negative charge
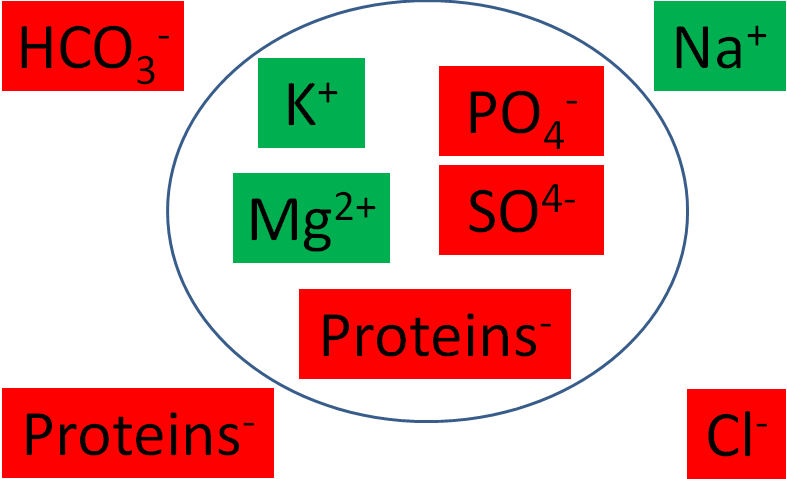
The following table summarizes the major intracellular and extracellular electrolytes by giving their milliequivalents (mEq)/L. Milliequivalents are a measure of charge. Thus, a higher value means that the cation or anion is accounting for more charge.
Table 13.11 Major intracellular and extracellular electrolytes (mEq/L)1,2
Intracellular Extracellular
| Cations | Anions | Cations | Anions |
| Potassium (K+) 150 | Phosphate (PO4-) 104 | Sodium (Na+) 142 | Chloride (Cl-) 103 |
| Magnesium (Mg2+) 40 | Proteins 57 | Bicarbonate (HCO3-) 27 | |
| Sulfate (SO42-) 20 | Proteins 16 |
The following figure graphically shows the major intracellular and extracellular cations (green) and anions (red).
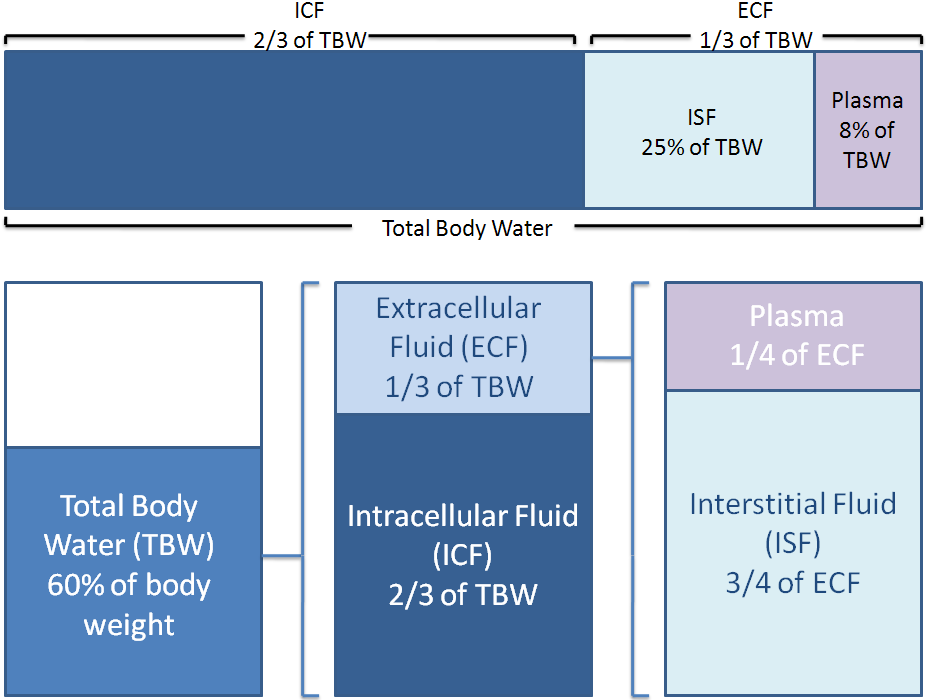
Electrolytes and proteins are important in fluid balance. Your body is 60% water by weight. Two-thirds of this water is intracellular, or within cells. One-third of the water is extracellular, or outside of cells. One-fourth of the extracellular fluid is plasma, while the other 3/4 is interstitial (between cells) fluid. Thus, when considering total body water, around 66% is intracellular fluid, 25% is interstitial fluid, and 8% is plasma3,4.
Fluid distribution between the different compartments are shown below.
References & Links
- Byrd-Bredbenner C, Moe G, Beshgetoor D, Berning J. (2009) Wardlaw’s perspectives in nutrition. New York, NY: McGraw-Hill.
- Whitney E, Rolfes SR. (2011) Understanding nutrition. Belmont, CA: Wadsworth Cengage Learning.
- Gropper SS, Smith JL, Groff JL. (2008) Advanced nutrition and human metabolism. Belmont, CA: Wadsworth Publishing.
- Adapted from http://www.netterimages.com/image/21248.htm
13.2 Sodium
Salt (NaCl) contributes almost all the sodium that we consume. 75-85% of the salt we consume is from processed foods, 10% is naturally in foods, and added salt contributes 10-15% of total salt intake1.
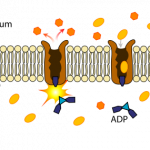
95-100% of consumed sodium is absorbed2. Sodium is taken up into the enterocyte through multiple mechanisms before being pumped out of the enterocyte by sodium-potassium (Na+/K+) ATPase. Sodium-potassium ATPase is an active carrier transporter that pumps 3 sodium ions out of the cell and 2 potassium ions into the cell, as shown below.
Sodium is the major cation in extracellular fluid.
Sodium has 3 main functions1:
- Fluid balance
- Aids in monosaccharide and amino acid absorption
- Muscle contraction and nerve transmission (not discussed further below)
Fluid balance
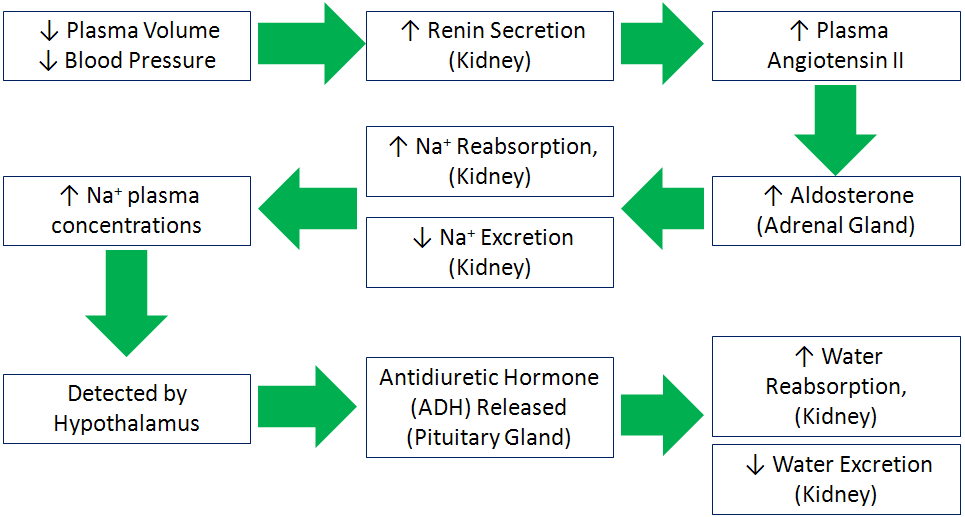
The body regulates sodium and fluid levels through a series of processes as shown below. A decrease in plasma volume and blood pressure signals the kidney to release the enzyme renin. Renin activates angiotensin that is converted to angiotensin II. Angiotensin II signals the adrenal glands to secrete the hormone aldosterone. Aldosterone increases sodium reabsorption in the kidney, thus decreasing sodium excretion. These actions cause plasma sodium concentrations to increase, which is detected by the hypothalamus. The hypothalamus stimulates the pituitary gland to release antidiuretic hormone (ADH) that causes the kidneys to reabsorb water, decreasing water excretion. The net result is an increase in blood volume and blood pressure1.
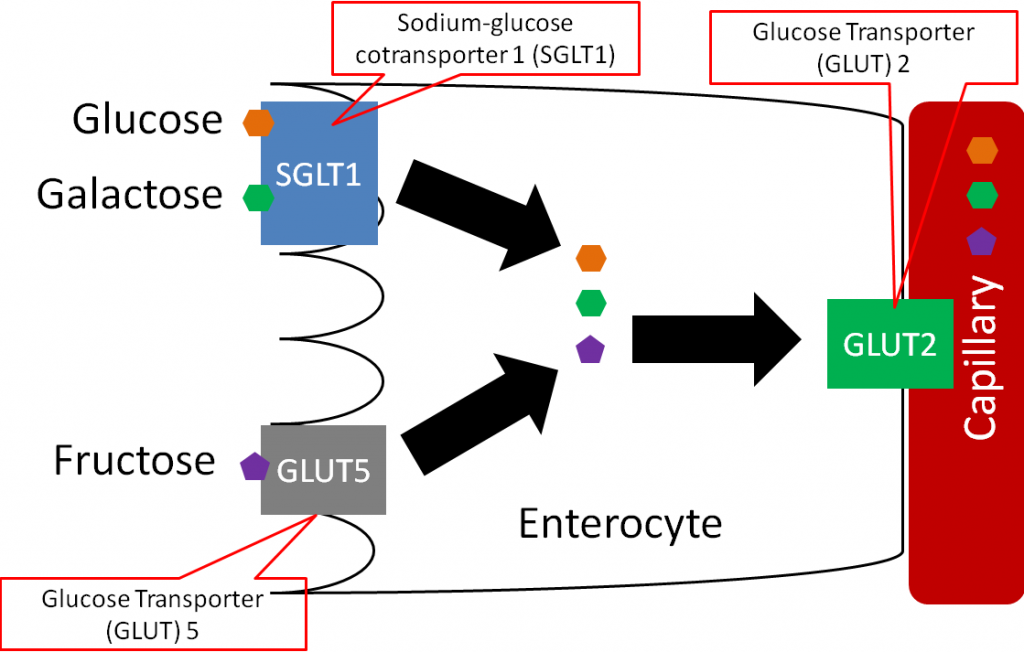
- Aids in monosaccharide and amino acid absorption
Glucose and galactose are taken up into the enterocyte by sodium-glucose cotransporter 1 (SGLT1), which requires sodium to be transported along with glucose or galactose.
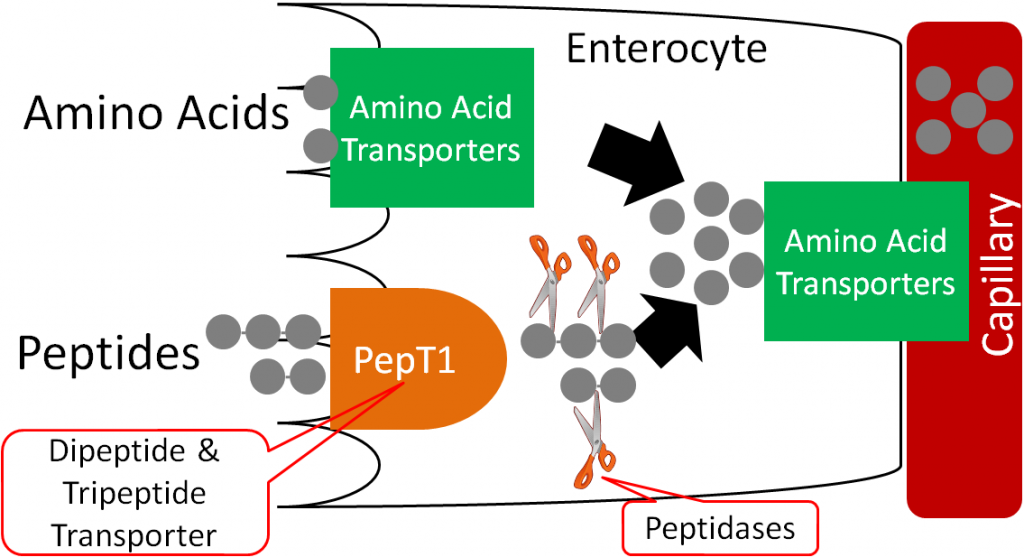
Amino acids are taken up and transported into circulation through a variety of amino acid transporters. Some of these transporters are sodium-dependent (require sodium to transport amino acids).
Sodium deficiency is rare, and is normally due to excessive sweating. Sweat loss must reach 2-3% of body weight before sodium losses are a concern1,2. This situation can occur in marathon runners and ultra-marathon runners who sweat for many hours straight (without proper liquid intake). Low blood sodium levels (hyponatremia) can result in1:
Headache
Nausea
Vomiting
Fatigue
Muscle Cramps
Sodium is not toxic, but higher sodium intake increases the risk of developing high blood pressure. High sodium intake also increases calcium excretion, but studies haven’t found an increased risk of osteoporosis. High sodium intake may also increase the risk of developing kidney stones (by increasing calcium excretion), because calcium oxalate is the most common form of kidney stone1.
References & Links
- Byrd-Bredbenner C, Moe G, Beshgetoor D, Berning J. (2009) Wardlaw’s perspectives in nutrition. New York, NY: McGraw-Hill.
- Gropper SS, Smith JL, Groff JL. (2008) Advanced nutrition and human metabolism. Belmont, CA: Wadsworth Publishing.
- https://en.wikipedia.org/wiki/ATPase#/media/File:Scheme_sodium-potassium_pump-en.svg
13.3 Chloride
Sodium’s partner in salt, chloride, is the major extracellular anion. Almost all of the chloride we consume is from salt, and almost all chloride is absorbed. It is excreted in urine like sodium.
Chloride has the following functions1:
- Aids in nerve impulses
- Component of HCl
- Released by white blood cells to kill foreign substances
- Helps maintain acid-base balance
Chloride deficiency is rare, but can occur because of severe diarrhea or vomiting. Other symptoms of this deficiency include1,2:
Weakness
Diarrhea and vomiting
Lethargy
Chloride is not toxic, but since it is a part of salt, it is recommended that we restrict our intake to avoid potential increases in blood pressure.
References & Links
- Byrd-Bredbenner C, Moe G, Beshgetoor D, Berning J. (2009) Wardlaw’s perspectives in nutrition. New York, NY: McGraw-Hill.
- Gropper SS, Smith JL, Groff JL. (2008) Advanced nutrition and human metabolism. Belmont, CA: Wadsworth Publishing.
13.4 Potassium
Potassium is the major intracellular cation. Good sources of potassium include beans, potatoes (with skin), milk products, orange juice, tomato juice, and bananas1,2. Potassium, like sodium and chloride, is well absorbed. Greater than 85% of consumed potassium is absorbed. Potassium is primarily excreted in urine (~90%)3.
Potassium is important for:
- Fluid Balance
- Nerve transmission and muscle contraction
Increased potassium intake results in decreased calcium excretion. This is the opposite effect of increased sodium intake, which increases calcium excretion1.
Potassium deficiency is rare but can be fatal. Symptoms include:
Weakness
Fatigue
Constipation
Irregular heartbeat (can be fatal)
Deficiency can occur in individuals that are on diuretics, drugs that increase urine production, and individuals with eating disorders1.
Toxicity is also extremely rare, only occurring if there is a problem with kidney function. Symptoms of toxicity are irregular heartbeat and even cardiac arrest1.
References & Links
- Byrd-Bredbenner C, Moe G, Beshgetoor D, Berning J. (2009) Wardlaw’s perspectives in nutrition. New York, NY: McGraw-Hill.
- Whitney E, Rolfes SR. (2011) Understanding nutrition. Belmont, CA: Wadsworth Cengage Learning.
- Gropper SS, Smith JL, Groff JL. (2008) Advanced nutrition and human metabolism. Belmont, CA: Wadsworth Publishing.
13.5 Magnesium
Magnesium is an electrolyte, but that is not considered its major function in the body. Green leafy vegetables, beans, nuts, seeds, and whole grains are good sources of magnesium1,2. 40-60% of consumed magnesium is absorbed at normal levels of intake. Magnesium is excreted primarily in urine3.
55-60% of magnesium in the body is found in bone3. Some (30%) of this bone magnesium is believed to be exchangeable, or can be used to maintain blood concentrations, similar to how calcium in bones can be used to maintain blood concentrations.
Magnesium helps to stabilize ATP and nucleotides by binding to phosphate groups. Magnesium plays a role in over 300 enzymes in the body. Here is a list of some of the physiological processes that magnesium participates in3:
Glycolysis
TCA cycle
Fatty acid oxidation (beta-oxidation)
DNA and RNA transcription
Nucleotide synthesis
Muscle contraction
Magnesium deficiency is rare, but can be caused by prolonged diarrhea or vomiting. Symptoms include1:
Irregular heartbeat
Muscle spasms
Disorientation
Seizures
Nausea
Vomiting
Magnesium toxicity is also rare but can occur from excessive use of antacids or laxatives. Symptoms include3:
Diarrhea
Nausea
Flushing
Double vision
Slurred speech
Weakness
Paralysis
Magnesium supplements differ in percent of magnesium in the different forms, as shown below.
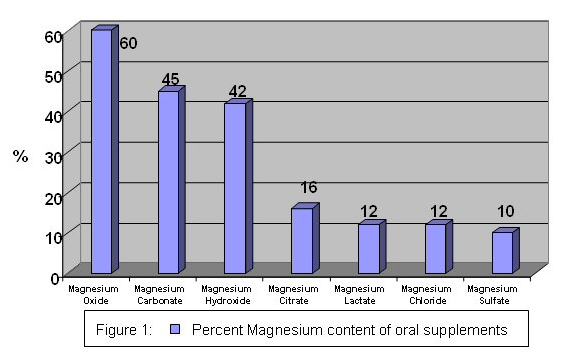
The bioavailability of magnesium oxide is significantly lower than magnesium chloride, magnesium lactate, and magnesium aspartate. The latter 3 are equally bioavailable4.
References & Links
- Byrd-Bredbenner C, Moe G, Beshgetoor D, Berning J. (2009) Wardlaw’s perspectives in nutrition. New York, NY: McGraw-Hill.
- McGuire M, Beerman KA. (2011) Nutritional sciences: From fundamentals to food. Belmont, CA: Wadsworth Cengage Learning.
- Gropper SS, Smith JL, Groff JL. (2008) Advanced nutrition and human metabolism. Belmont, CA: Wadsworth Publishing.
- http://www.health-choices-for-life.com/magnesium_supplements.html
13.6 Hypertension, Salt-Sensitivity & the DASH Diet
Approximately 27% of American adults have hypertension (high blood pressure), which increases their risk of developing cardiovascular disease1. Salt and/or sodium intake is believed to be a major causative factor in the development of hypertension. However, it is now known that not everyone is salt-sensitive. Salt-sensitive means that a person’s blood pressure increases with increased salt intake and decreases with decreased salt intake. Approximately 25% of normotensive (normal blood pressure) individuals and 50% of hypertensive individuals are salt-sensitive2. Most others are salt-insensitive, and in a small portion of individuals, low salt consumption actually increases blood pressure1. Unfortunately, there isn’t a clinical method to determine whether a person is salt-sensitive. There are some known characteristics that increase the likelihood of an individual being salt-sensitive. They are1:
Elderly
Female
African-American
Hypertensive
Diabetic
Chronic Kidney Disease
There is some evidence now suggesting that there may be negative effects in some people who restrict their sodium intakes to the levels recommended by some organizations. The second link describes a couple of studies that had conflicting outcomes as it relates to the importance of salt reduction in decreasing blood pressure and cardiovascular disease. The third link is to a study that found that higher potassium consumption, not lower sodium consumption, was associated with decreased blood pressure in adolescent teenage girls.
| Web Link
Report Questions Reducing Salt Intake Too Dramatically |
To combat hypertension, the Dietary Approaches to Stop Hypertension (DASH) diet was developed. This diet emphasizes:
fruits, vegetables, fat-free/low-fat milk and milk products, whole grain products, fish, poultry, nuts
It limits:
red meat, sweets, added sugars, sugar-containing beverages
As a result the diet is high in:
potassium, magnesium, calcium, protein, fiber
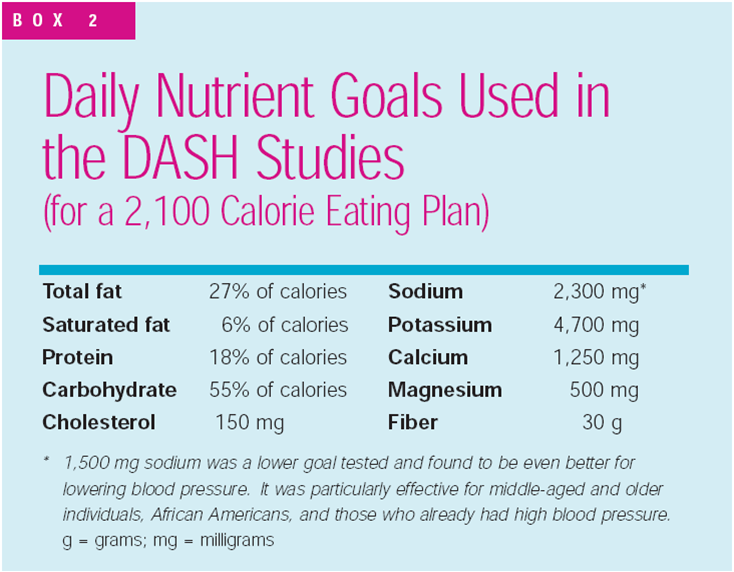
The daily goals for the DASH diet are shown below:
To get an idea of what types of foods and how much would be consumed in the diet, an eating plan is shown below.
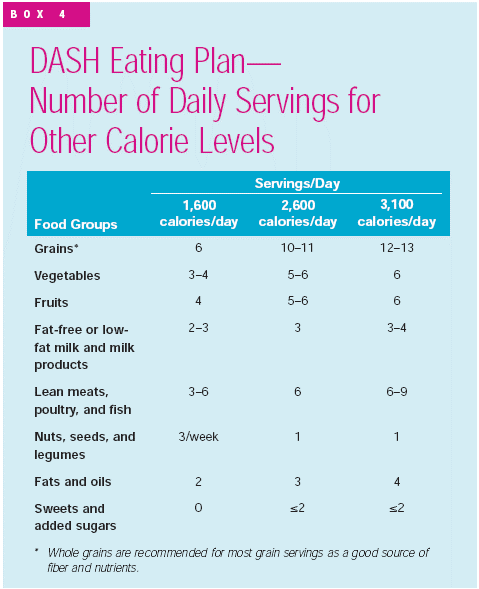
The DASH diet has been shown to be remarkably effective in decreasing blood pressure in those with hypertension. Nevertheless, most people with hypertension aren’t following the DASH diet. In fact, evidence from the National Health and Nutrition Examination Survey found that significantly fewer hypertensive individuals were following the DASH diet in 1999-2004 than during 1988-1994, as shown in the table below4.
Table 13.61 Percent of hypertensive subjects in NHANES trial meeting the DASH goals4
| Variable | NHANES 1988-1994
(n = 4336) |
NHANES 1999-2004
(n = 3821) |
Absolute Change (%) | p-value |
| DASH Accordance | 29.3 ± 1.5 | 21.7 ± 1.3 | -7.6 | <0.001 |
| Total Fat | 42.9 ± 1.8 | 35.9 ± 2.0 | -7.0 | 0.01 |
| Saturated Fat | 20.6 ± 1.2 | 20.4 ± 1.4 | -0.2 | 0.94 |
| Protein | 43.7 ± 2.0 | 47.7 ± 1.9 | 4.0 | 0.73 |
| Cholesterol | 26.4 ± 2.2 | 24.3 ± 1.6 | -2.1 | 0.44 |
| Fiber | 20.2 ± 1.5 | 12.3 ± 0.9 | -7.9 | <0.001 |
| Magnesium | 14.2 ± 1.3 | 6.4 ± 0.8 | -7.8 | <0.001 |
| Calcium | 19.0 ± 1.6 | 17.6 ± 2.0 | -1.4 | 0.58 |
| Potassium | 12.7 ± 0.9 | 11.7 ± 0.9 | -1.0 | 0.46 |
| Sodium | 17.8 ± 1.5 | 14.6 ± 1.3 | -3.2 | 0.21 |
The main components that contributed to the decrease in DASH diet accordance were total fat, fiber, and magnesium, as indicated by their high negative absolute changes.
References & Links
- McGuire M, Beerman KA. (2011) Nutritional sciences: From fundamentals to food. Belmont, CA: Wadsworth Cengage Learning.
- Whitney E, Rolfes SR. (2011) Understanding nutrition. Belmont, CA: Wadsworth Cengage Learning.
- http://www.nhlbi.nih.gov/health/public/heart/hbp/dash/new_dash.pdf
- Mellen P, Gao S, Vitolins M, Goff D. (2008) Deteriorating dietary habits among adults with hypertension: DASH dietary accordance, NHANES 1988-1994 and 1999-2004. Arch Intern Med 168(3): 308-314.
Links
Report Questions Reducing Salt Intake Too Dramatically – http://www.usatoday.com/story/news/nation/2013/05/14/salt-diet-sodium-intake/2156143/
Pour on the Salt? New Research Suggests More Is OK – http://www.nbcnews.com/health/heart-health/pour-salt-new-research-suggests-more-ok-n179941
For Teenagers, Potassium May Matter More Than Salt – http://well.blogs.nytimes.com/2015/04/27/for-teenagers-potassium-may-matter-more-than-salt/
