Main Body
The field of nutrition is dynamic. This means that our understanding and practices are constantly changing and being updated. Some of nutrition’s dynamic nature may be due to the fact that nutrition, as a discipline, is relatively young (many vitamins weren’t isolated until the 1930s) compared to many other scientific fields. New research is always being conducted and the findings are continuously being reported to the public. With so much information, discernment must be exercised. In order to interpret these new findings, you need to understand how the research was conducted and the nutrition research hierarchy. Everyone eats, so people are going to face nutrition choices and questions on a daily basis. This section will provide you with an integrated understanding of the different forms of nutrition research and how to evaluate them relative to one another.
1.1 The Basics
Nutrition can be defined as the science of the action of food, beverages, and their components in biological systems. A nutrient is a compound that provides a needed function in the body. Nutrients can be further classified based on the amount needed in the body.
Macronutrients: nutrients needed in larger amounts
Micronutrients: nutrients needed in smaller amounts (but still important)
The following table lists the different macronutrients and micronutrients.
Table 1.11 Macronutrients and Micronutrients
| Macronutrients | Micronutrients |
| Carbohydrates | Vitamins |
| Proteins | Minerals |
| Lipids | |
| Water |
Carbohydrates
The name carbohydrate means “hydrated carbon”, or carbon with water. Thus, it isn’t a surprise that carbohydrates are made up of carbon, hydrogen, and oxygen. Sucrose (table sugar) is an example of a commonly consumed carbohydrate. Some dietary examples of carbohydrates are whole-wheat bread, oatmeal, rice, sugary snacks/drinks, and pasta.

Proteins
Proteins are also made up of carbon, hydrogen, and oxygen, but they also contain nitrogen. Several dietary sources of proteins include nuts, beans/legumes, skim milk, egg whites, and meat.

Lipids
Lipids consist of fatty acids, triglycerides, phospholipids, and sterols (i.e. cholesterol). Lipids are also composed of carbon, hydrogen, and oxygen. Some dietary sources of lipids include oils, butter, and egg yolks.

Water
Water is made up of hydrogen and oxygen (H2O) and is the only macronutrient that doesn’t provide energy.
Vitamins
Compounds that are essential for normal physiologic processes in the body.
Minerals
Elements (think periodic table) that are essential for normal physiological processes in the body.
No References
1.11 Calories (Food Energy)
Food energy is measured in kilocalories (kcals), commonly referred to as calories by the general public. The general public “calorie” term is incorrect (most do not know or understand the difference between the kilocalorie and calorie terms), but it is important to understand how what the term calorie represents when it is used in this way. A kilocalorie is the amount of energy needed to raise 1 kilogram of water 1 degree Celsius. A food’s kilocalories are determined by putting the food into a bomb calorimeter and determining the energy output (energy = heat produced). The first link below is to an image of a bomb calorimeter and a link to a video showing how one is used.
| Web Links
Bomb Calorimeter (inactive link as of 05/18/2021) |
Among the nutrients, the amount of kilocalories per gram that each provide are shown below.
| Energy (kcal/g) | No Energy |
| Carbohydrates (4) | Vitamins |
| Proteins (4) | Minerals |
| Lipids (9) | Water |
As can be seen, only carbohydrates, proteins, and lipids provide energy. However, there is another energy source in the diet that is not a nutrient……alcohol. Just to re-emphasize, alcohol is NOT a nutrient! But it does provide energy.

The following table lists the energy sources in the diet from lowest calories per gram to the highest calories per gram. Knowing these numbers allows a person to calculate/estimate the amount of calories the food contains if you know the grams of the different energy sources.
Energy Sources (kcal/g)
Carbohydrates → 4
Protein → 4
Alcohol → 7
Lipids → 9
Links
Bomb Calorimeter – https://www.learner.org/courses/chemistry/text/text.html?dis=U&num=Ym5WdElUQS9PQ289&sec=YzJWaklUQS9OeW89 (inactive link as of 05/18/21)
Bomb Calorimetry – http://www.youtube.com/watch?v=ohyA9amFfsc
1.12 Phytochemicals, Zoochemicals & Functional Foods
Beyond macronutrients and micronutrients, there is a lot of interest in non-nutritive compounds found in foods that may be either beneficial or detrimental to health.
Phytochemicals

Phytochemicals are compounds in plants (phyto) that are believed to provide healthy benefits beyond the traditional nutrients. One example is lycopene in tomatoes, which is thought to potentially decrease the risk of some cancers (in particular prostate cancer). Diets rich in fruits and vegetables have been associated with decreased risk of chronic diseases. Many fruits and vegetables are rich in phytochemicals, leading some to hypothesize that phytochemicals are responsible for the decreased risk of chronic diseases. The role that phytochemicals play in health is still in the early stages of research, relative to other areas of nutrition such as micronutrients. The following 2 links contain good information on phytonutrients if you are interested in learning more about them.
| Web Link |
Zoochemicals
Zoochemicals are the animal equivalent of phytochemicals in plants. They are compounds in animals that are believed to provide health benefits beyond the traditional nutrients that food contains. Hopefully the name is pretty easy to remember because you can find animals at a zoo. Some compounds can be both phytochemicals and zoochemicals. An example of compounds that can be classified as both are the yellow carotenoids lutein and zeaxanthin. Kale, spinach, and corn contain phytochemicals and are good sources of lutein and zeaxanthin. Whereas egg yolks contain zoochemicals and are also a good source of these carotenoids.
Functional Foods
There are a number of definitions of functional foods. Functional foods are generally understood to be a food, or a food ingredient, that may provide a health benefit beyond the traditional nutrients (macronutrients and micronutrients) it contains. Functional foods are often a rich source of a phytochemical or zoochemical, or contain more of a certain nutrient than a normal food.
Links
Linus Pauling Institute: Phytochemicals – http://lpi.oregonstate.edu/infocenter/phytochemicals.html
1.13 The Scientific Method
The basis of what we know about nutrition is derived from research and the scientific method underlies how research is conducted. The following figure shows the steps in the scientific method.
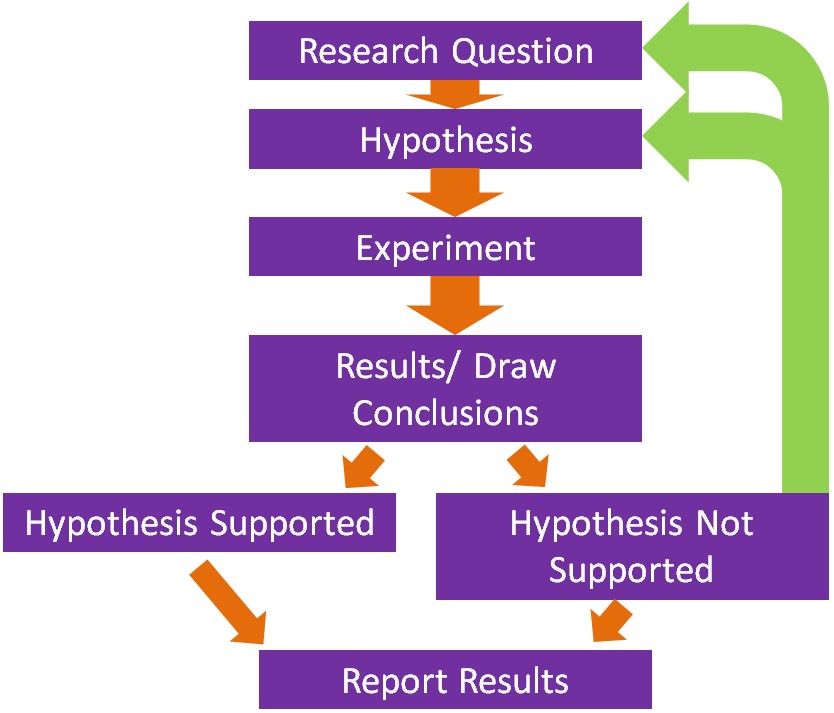
Steps in the Scientific Method
- The first step is to come up with a scientific or research question that you are interested in investigating.
- Based on your research question, a hypothesis or an educated guess is formulated.
- The next step is to design and conduct the experiment. A good design should take into account what has been done previously. Thus, a thorough review of methods and results published previously should be undertaken. This will help prevent making the same mistakes and save a lot of time conducting the research.
- Perform the experiment/research and collect results and draw conclusions.
- If the hypothesis is not supported, then a new hypothesis/research question should be created and a new experiment be conducted.
- Ultimately, researchers hope to publish their research in peer-reviewed journals.
No References
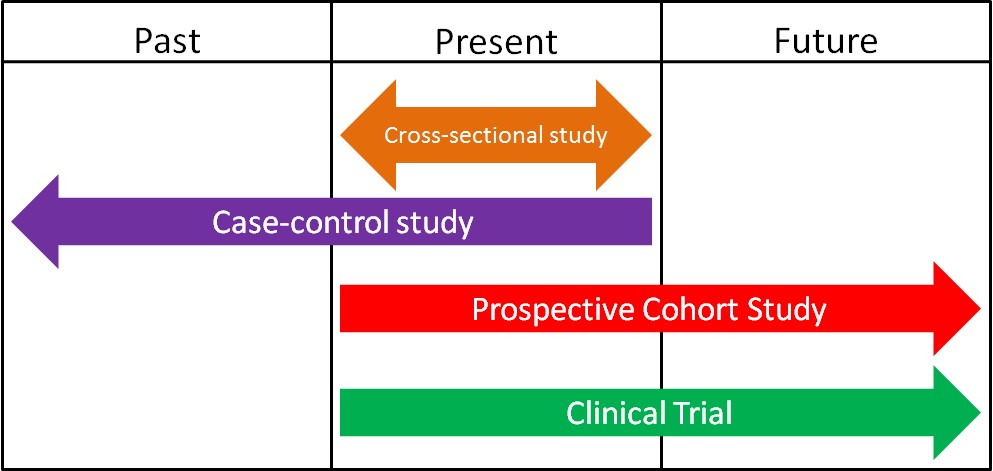
1.2 Epidemiology
Epidemiology is defined as the study of human populations. These studies often investigate the relationship between dietary consumption and disease development. There are three main types of epidemiological studies: cross-sectional, case-control, and prospective cohort studies.
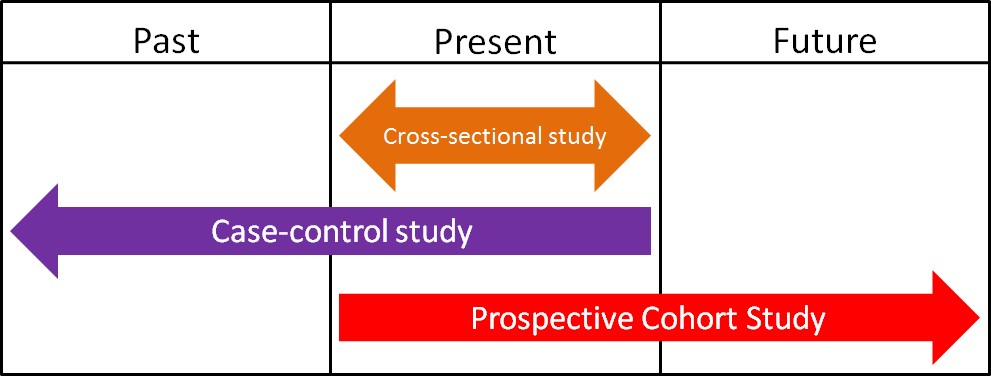
1. Cross-Sectional Studies
Cross-sectional studies compare different populations at the same point in time. It is as if you take a snapshot of the two different populations to compare them to one another. An example of a cross-sectional study led to a phenomenon known as the “French Paradox.” Cholesterol and saturated fat intake were associated with increased risk of coronary heart disease across a wide variety of countries. However, within the study they noticed a surprising result. European countries with very similar cholesterol-saturated fat intakes had hugely different death rates from coronary heart disease deaths, as shown below.
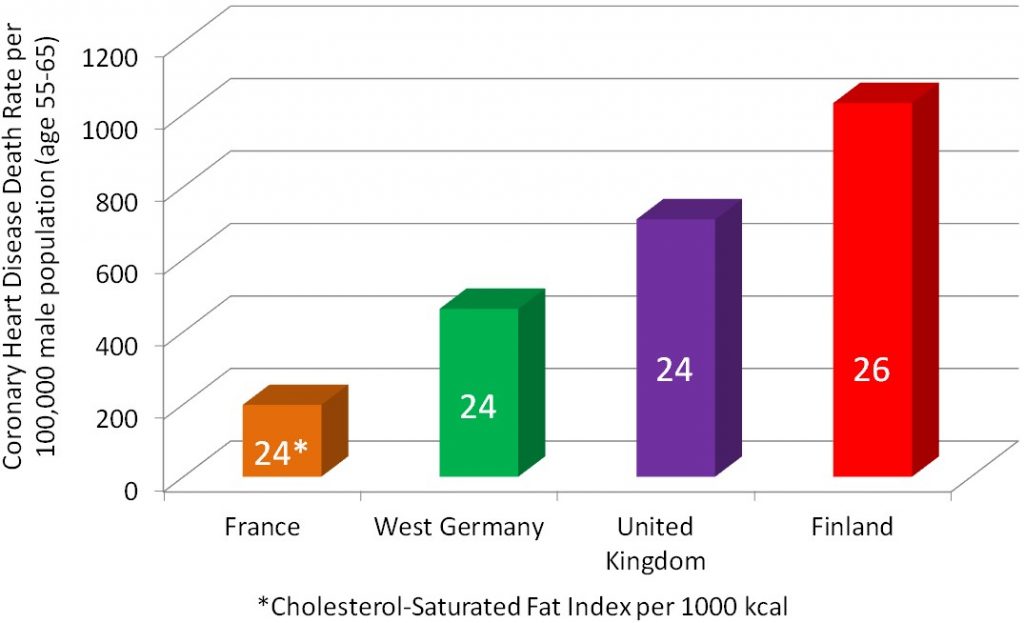
The French had a 5-fold lower risk of dying from coronary heart disease than the Finns, despite having similar cholesterol-saturated fat intakes[1].
2. Case-Control Studies
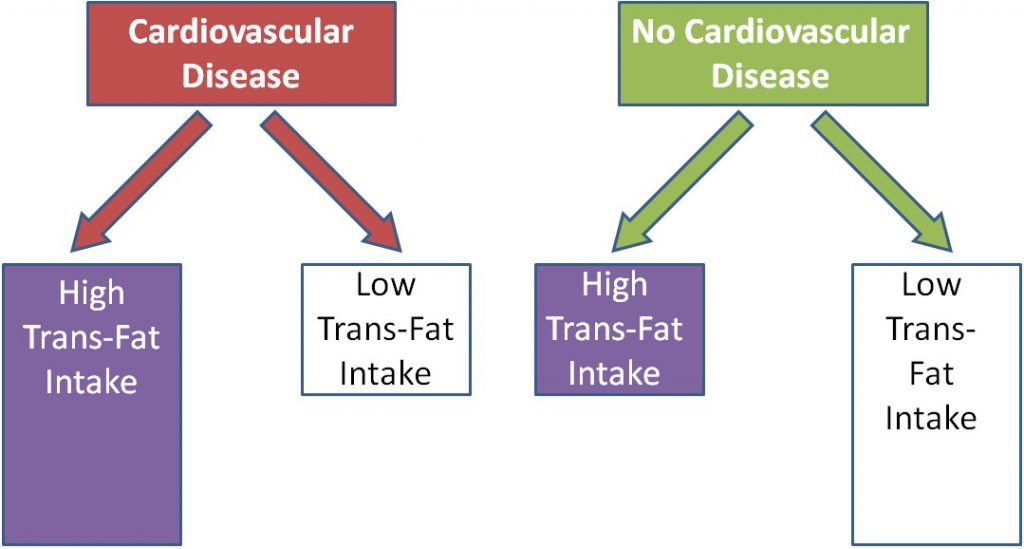
Case-control studies look at a group of cases (e.g. people with a disease) vs. controls (e.g. people without the disease). Most case-control studies are retrospective (looking back in time, or looking at the past). These studies try to determine if there were differences in the diets of the cases compared to controls in the past. Cases and controls are matched on characteristics such as age, sex, BMI, history of disease, and many others. This means researchers try to choose a control that has similar characteristics to the case. The researchers then compare the exposure levels between the cases and controls, as shown below. In this example a greater proportion of diseased (cases) individuals than disease-free individuals (controls) were exposed to something.
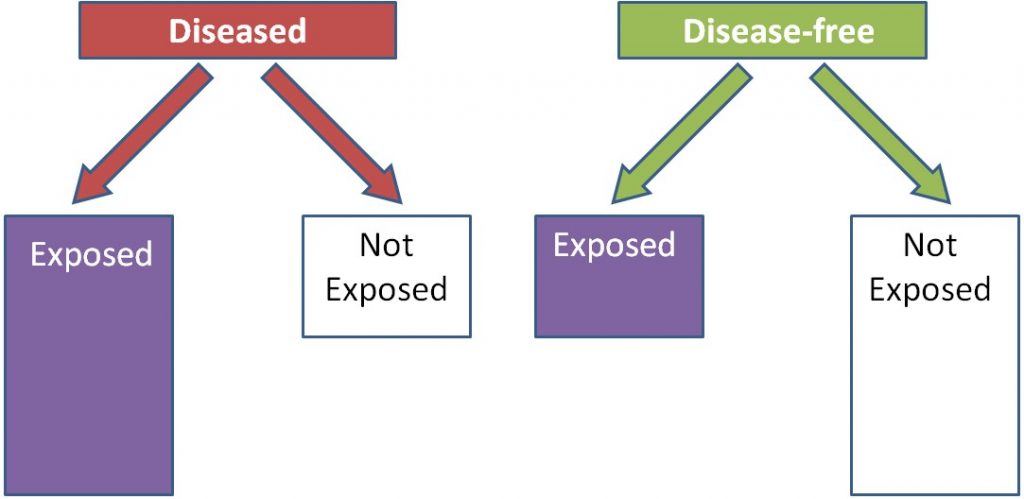
Using trans-fat intake as the exposure, and cardiovascular disease as the disease, the figure would be expected to look like this:
To determine people's intakes of foods and food components, food frequency questionnaires are commonly used. As the name suggests, a food frequency questionnaire is a series of questions that determines how frequently you consume a certain food. An example of a question on a food frequency questionnaire is shown below:
"Over the past 12 months, how often did you drink milk?"
Never
1 time/month less 1 time/day
2-3 times/month 2-3 times/day
1-2 times/week 4-5 times/day
3-4 times/week 6 or more times/day
5-6 times/week
An example of a food frequency questionnaire is shown in the link below.
| Web Link |
3. Prospective Cohort Studies
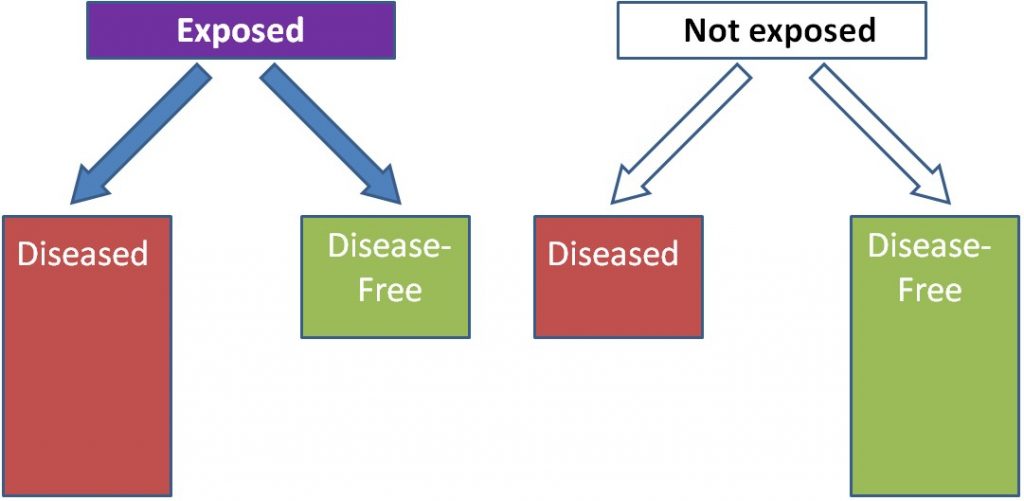
A cohort is "a group of subjects." Most cohort studies are prospective. Initial information is collected (usually by food frequency questionnaires) on the intake of a cohort of people at baseline, or the beginning. This cohort is then followed over time (normally many years) to quantify health outcomes of the individual within it. Cohort studies are normally considered to be more robust than case-control studies, because these studies do not start with diseased people and normally do not require people to remember their dietary habits in the distant past or before they developed a disease. An example of a prospective cohort study would be if you filled out a questionnaire on your current dietary habits and are then followed into the future to see if you develop osteoporosis. As shown below, instead of separating based on disease versus disease-free, individuals are separated based on exposure. In this example, those who are exposed are more likely to be diseased than those who were not exposed.
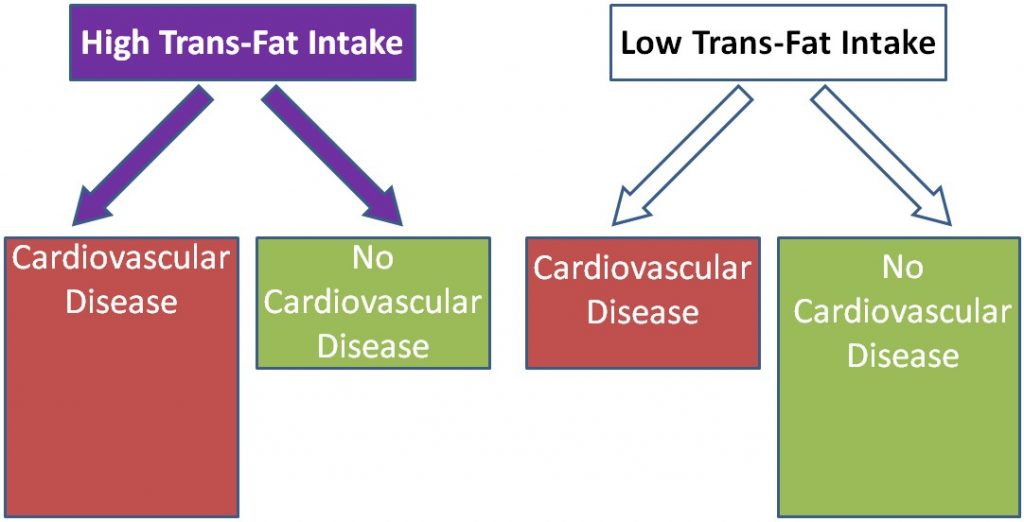
Using trans-fat intake again as the exposure and cardiovascular disease as the disease, the figure would be expected to look like this:
There are several well known examples of prospective cohorts’ studies:
Framingham Heart Study
The Framingham Heart Study started in 1948 and has been following the residents of Framingham, Massachusetts to identify risk factors for heart disease. This cohort has been very fruitful in finding a number of important factors associated with coronary heart disease. In 2002, a third generation of participants was enrolled to be followed. The following links show more about the Framingham Heart Study.
| Web Links
Framingham Heart Study History (inactive link as of 05/18/2021) Framingham Heart Study Research Milestones (inactive link as of 05/18/2021) |
Nurses Health Study
The Nurses’ Health Study started in 1976 and enrolled 122,000 female nurses. Every 4 years they received a food frequency questionnaire to assess their dietary habits.
| Web Link |
Health Professionals Follow-Up Study
The Health Professionals Follow-Up Study started in 1986 and enrolled 51,529 male health professionals (dentists, pharmacists, optometrists, osteopathic physicians, podiatrists, and veterinarians). Every 4 years they received a food frequency questionnaire to assess their dietary habits.
| Web Link |
The Health Professionals Follow-Up Study is a good example for how cohort studies can be important in nutrition research. We will consider one example in which the researchers administered food frequency questionnaires that contained 131 food and beverage items to determine whether their intake was associated with increased or decreased risk of developing prostate cancer. Of these items, intake of four foods (tomatoes, tomato sauce, pizza, and strawberries) were associated with decreased incidence of prostate cancer, as illustrated in the figure below[2].
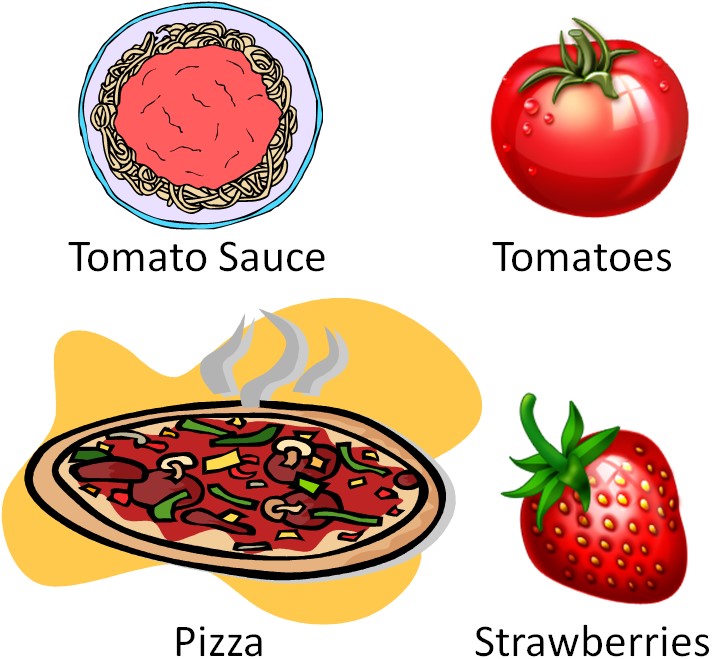
The three tomato-based foods are red due to the presence of the carotenoid lycopene. Strawberries don't contain lycopene (their red color is due to anthocyanins). This finding has led to interest in the potential of tomatoes/lycopene to decrease the risk of prostate cancer.
Links
NHANES Food Frequency Questionnaire - http://appliedresearch.cancer.gov/diet/usualintakes/ffq.html
Framingham Heart Study History - http://www.framinghamheartstudy.org/about-fhs/history.php (inactive link as of 05/18/2021)
Framingham Heart Study Research Milestones - http://www.framinghamheartstudy.org/about-fhs/research-milestones.php (inactive link as of 05/18/2021)
The Nurses Health Study - http://www.channing.harvard.edu/nhs/?page_id=70
Health Professionals Follow-Up Study - http://www.hsph.harvard.edu/hpfs/
1.3 In Vitro & Animal Studies
The simplest form of nutrition research is an in vitro study. In vitro means "within glass", so these methods are performed within flasks, dishes, plates, and test tubes, although most of these are no longer glass (mostly plastic now). These studies are performed outside of a living organism, so the results need to be interpreted with this fact in mind.
One common form of in vitro research is cell culture. This involves growing cells in flasks and dishes. In order for cells to grow they need a nutrient source. For cell culture the nutrient source is referred to as media. Media supplies nutrients to the cells in vitro similarly to how blood performs this function within the body. Most cells adhere to the bottom of the flask and are so small that a microscope is needed to see them.
Cells are only handled inside a biosafety cabinet (aka cell culture hood). The hood is sterile and protects the cells from the outside environment. The cells need to be protected because they do not have human skin as a barrier to keep microorganisms, etc., from contaminating them.
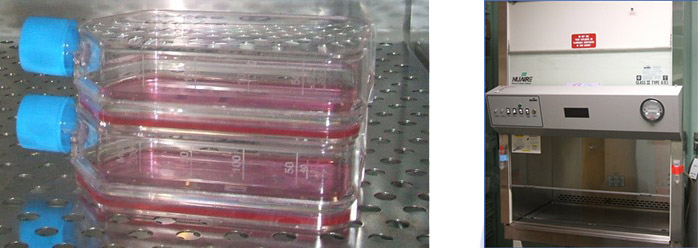
Cells are grown inside an incubator, which is a device that provides the optimal temperature, humidity, and carbon dioxide (CO2) concentrations for cells and microorganisms. By imitating the body's temperature and CO2 levels (37 degrees Celsius, 5% CO2), the incubator allows cells to grow even though they are outside the body.

Animal Studies
Animal studies are one form of in vivo research, which translates to "within the living". Rats and mice are the most common animals used in nutrition research.
Why do animal research?
Animals can be used in research that would be unethical to conduct in humans. Researchers can make sure that a certain regimen is safe before it is researched in humans. One advantage of animal dietary studies is that researchers can control exactly what the animals eat. In human studies, researchers can tell subjects what to eat and provide them with the food, but that does not necessarily mean that they are going to consume exactly what they are supposed to. Also people are not great at estimating, recording, or reporting how much or what they eat/ate. Animal studies are also, normally, far less expensive than human studies.
There are some important factors to keep in mind when interpreting animal research. First, an animal’s metabolism and physiology is different than humans. As a result, animals' absorption and bioavailability of compounds can differ from humans. Furthermore, animal models of disease (cancer, cardiovascular disease, etc.), although similar, are different from the human disease. So these factors have to be considered when interpreting results from this type of research. Nevertheless, animal studies have been, and continue to be, important for nutrition research.
No References
1.4 Human Intervention Studies/Clinical Trials
There are a variety of human intervention study designs in nutrition research, but the most common, especially in pharmaceutical/medical research, is the clinical trial. A clinical trial is a scientifically controlled study using consenting people to find the safety and effectiveness of different items/regimens. Clinical trials are the "gold standard" research method. Their findings carry the most weight when making decisions about a certain research area because they are the most rigorous scientific studies. Every pharmaceutical must go through a series of clinical trials before being approved for the market by the FDA (specifically the randomized, double-blind, placebo-controlled experiments). As shown in the figure below, human intervention studies/clinical trials are normally prospective. By the end of this section you should have an understanding of what randomized, double-blind, and placebo-controlled means.
Placebo and The Placebo Effect
A placebo is a fake pill or treatment that serves as a comparison to an active treatment. An examples of placebos are shown below.
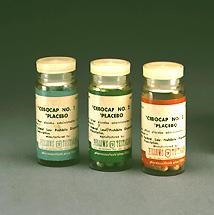
The use of a placebo is necessary in medical research because of a phenomenon known as the "placebo effect". The placebo effect results from a subject's belief in a treatment, even though there is actually no treatment being administered. An example would be an athlete who consumes a sports drink a
nd runs the 100 meter dash in 11.00 seconds. The athlete then, under the exact same conditions, drinks what he is told is "Super Duper Sports Drink" and runs the 100 meter dash in 10.50 seconds. But what the athlete didn't know was that Super Duper Sports Drink was the Sports Drink + Food Coloring. There was nothing different between the drinks, but the athlete believed that the "Super Duper Sports Drink" was going to help him run faster, so he did. This improvement is due to the placebo effect.
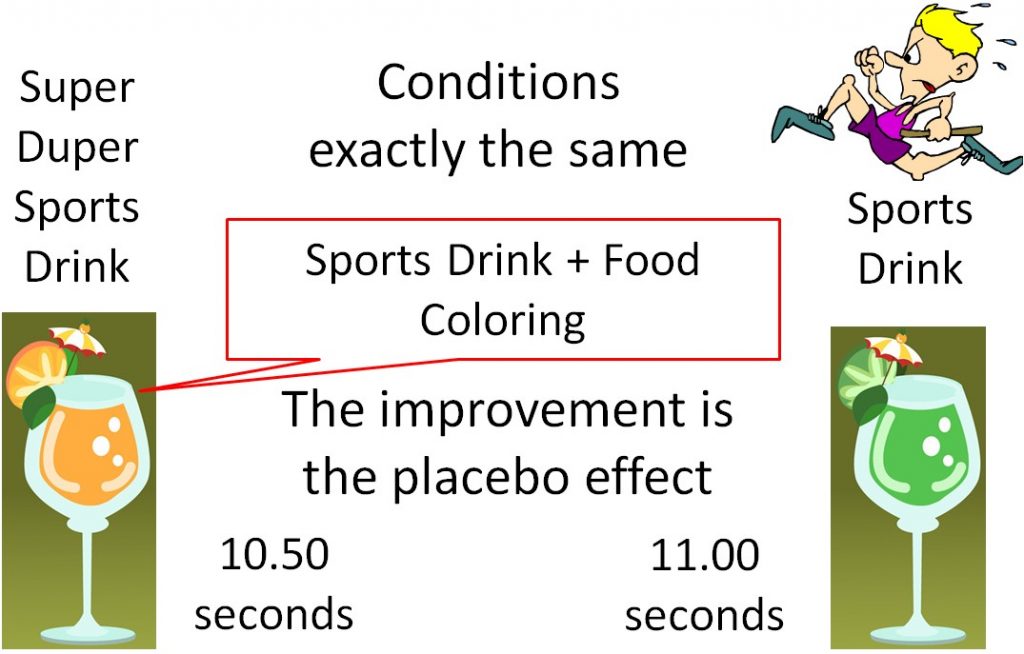
Ironically, a study similar to the example given above has been conducted and its results support that there is a “placebo effect.”
| Web Link |
Randomization
Randomization is the process of randomly assigning subjects to groups to decrease bias. Bias, according to the Merriam-Webster dictionary, is "a systematic error introduced into sampling or testing by selecting or encouraging one outcome or answer over others[3]". Bias can occur in assigning subjects to groups in a way that will influence the results. An example of bias in a study of an antidepressant drug is shown below. In this nonrandomized antidepressant drug example, researchers (who know what the subjects are receiving) put depressed subjects into the placebo group, while "less depressed" subjects are put into the antidepressant drug group. As a result, even if the drug isn't effective, the group assignment may make the drug appear effective, thus biasing the results as shown below.
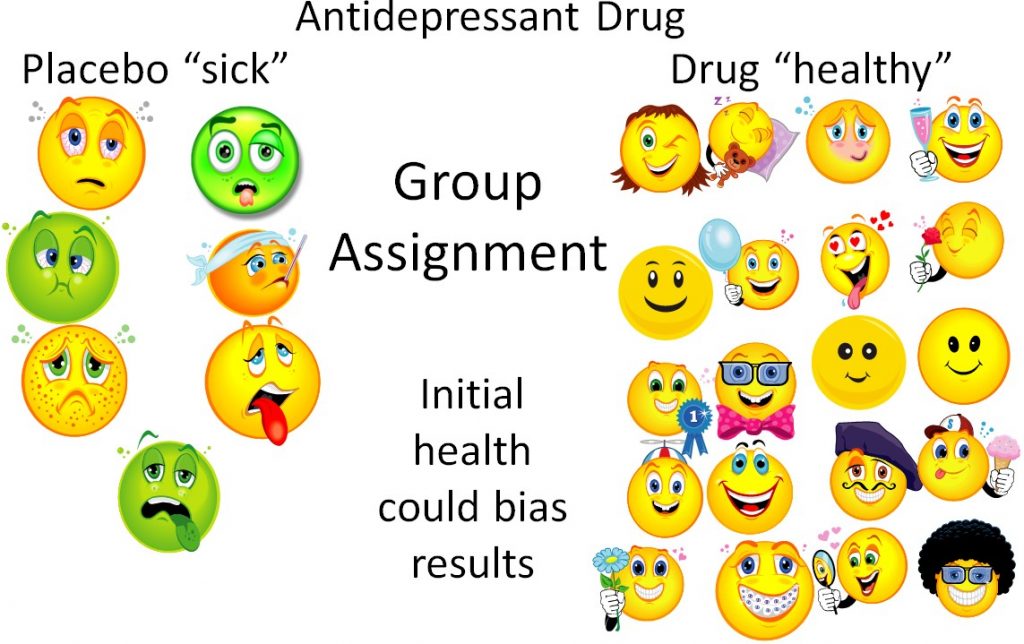
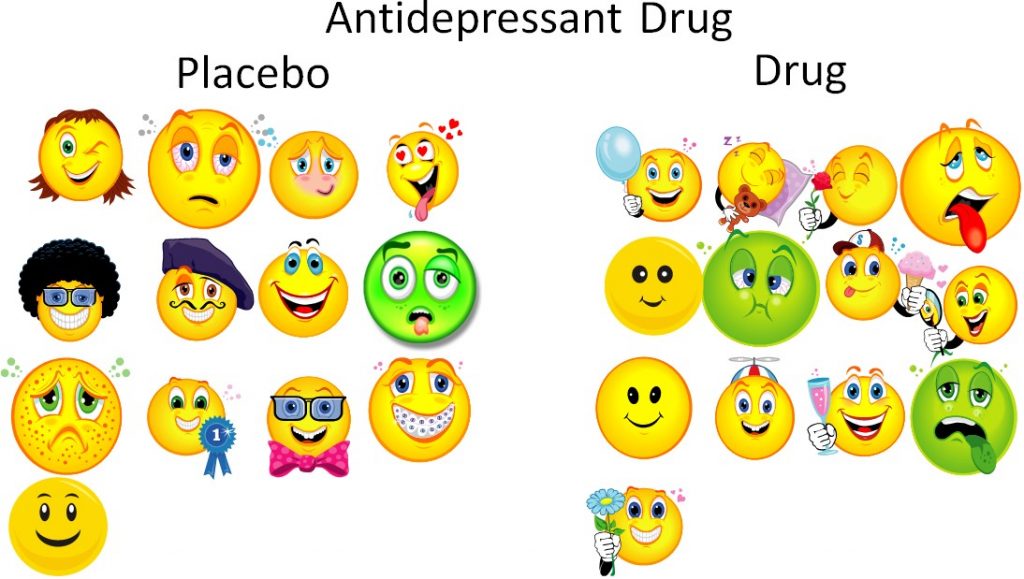
This is a bit of an extreme example, but even if the researchers are trying to prevent bias, sometimes bias can still occur. However, if the subjects are randomized, the sick and the healthy people will ideally be equally distributed between the groups. Thus, the trial will be unbiased and a true test of whether or not the drug is effective.
Blinding
Blinding is a technique to prevent bias in human intervention studies. A study without blinding is referred to as "open label" because both the subject and the researchers know what treatment the subject is receiving (i.e. placebo or drug). This can lead to bias, so these types of trials are used less frequently.
In a single-blind study, the researcher knows what treatment the subject is receiving, but the subject does not. If the subjects are randomized, these types of trials should produce robust results, but it is still possible that the researcher can bias the results.

Finally there is the double-blind study, where neither the researcher nor the subject know what treatment the subject is receiving. A separate board reviews the collected results and decides the fate of the trial. This is the "gold standard" because it prevents observer bias from occurring.

The following video does a nice job explaining and illustrating how double-blind randomized trials are performed.
| Web Link |
Link
A placebo can make you run faster - http://well.blogs.nytimes.com/2015/10/14/a-placebo-can-make-you-run-faster/
Video
How double-blind randomized controlled trials are done - http://www.dailymotion.com/video/x12igoz_double-blind-clinical-trials_news
1.5 Nutrition Research Statistics
One important aspect in being able to interpret research is to have a basic understanding of statistical significance. Statistical significance means that there is sufficient statistical evidence to suggest that the results are most likely not due to chance.
Statistical significance is represented by p-values in most research. The p-value is an estimate of whether the difference is a statistical accident or due to random chance. A p-value of less than 0.05 (commonly written p-value <0.05 or p <0.05) is used in most cases to indicate statistical significance. This value means that 5% of the time the statistical results are accidental or not true. Researchers accept this level of uncertainty.
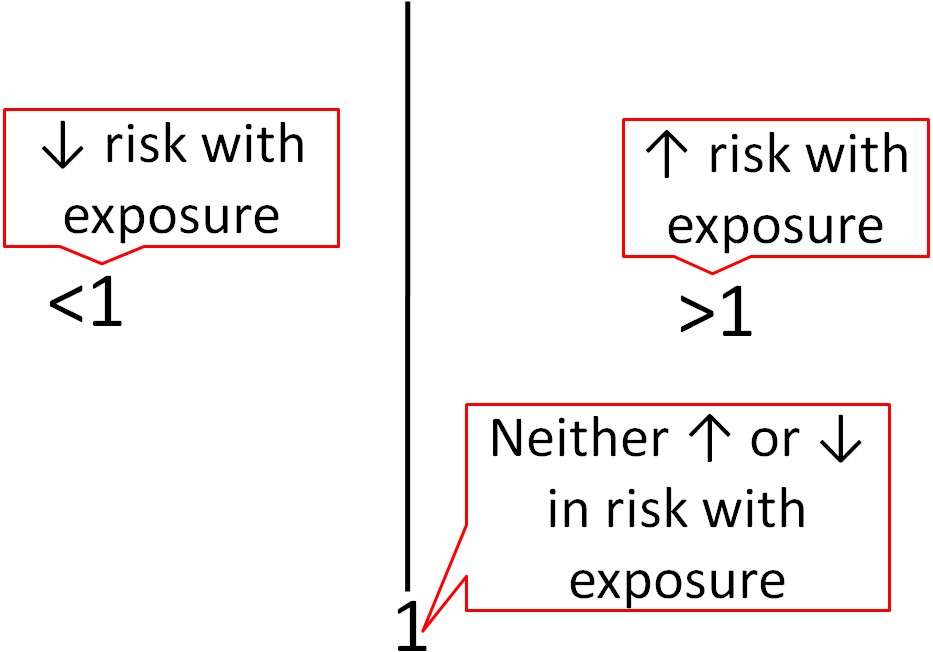
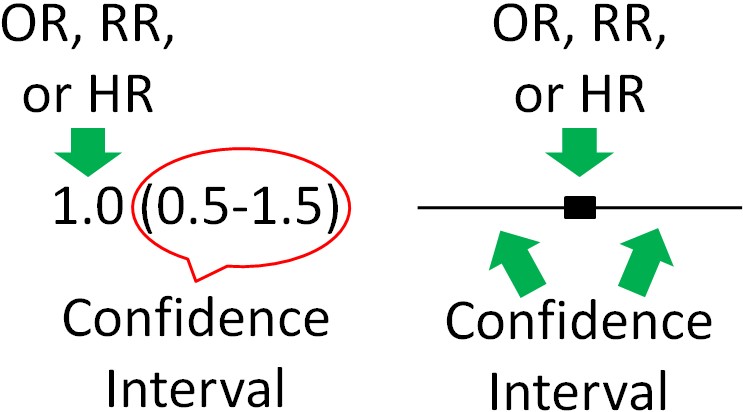
Epidemiological research usually uses different statistics to analyze their results. Epidemiological results are commonly reported as odds ratios (ORs), relative risks (RRs), or hazard ratios (HRs). These values can be interpreted similarly regardless of which is used. For example, the odds ratio represents the odds of a certain event occurring (often a disease) in response to a certain exposure (in nutrition this is often a food or dietary compound). In a paper it is common to see one of these measures in this form: OR = 2.0. What does this mean? As shown below, an OR, RR, or HR of 1 means that exposure is associated with neither increased nor decreased risk (neutral). If an OR, RR or HR is less than 1, that exposure is associated with a decreased risk. If an OR, RR, or HR is greater than 1, that exposure is associated with an increased risk. An OR,RR, or HR of 2 means there is twice the risk, while an OR, RR, or HR of 0.5 means there is half the risk of the exposure versus the comparison group.
To determine whether OR, RR, and HR are significantly different for a given exposure, most epidemiological research uses 95% confidence intervals. Confidence intervals indicate the estimated range that the measure is calculated to include. They go below and above the OR, RR, and HR itself. It is a calculation of how confident the researchers are that the OR, RR, and HR value is correct. Thus:
Large Confidence Intervals = Less Confidence in Value
Small Confidence Intervals = More Confidence in Value
Thus, 95% confidence intervals indicate that researchers are 95% confident that the true value is within the confidence intervals. A confidence interval is normally written in parenthesis following the OR, RR, or HR or represented as bars in a figure as shown below.
Most of the time, the OR, RR, or HR will be found in the middle of the 95% confidence interval, but not necessarily all of the time. For instance, there could be much greater confidence that the value is not much lower than the OR, RR, or HR, but not much confidence that the value does not exceed the HR, RR, or HR. This could lead to confidence interval looking skewed above the OR, RR, or HR (more confidence interval above, than below, the OR, RR, or HR).
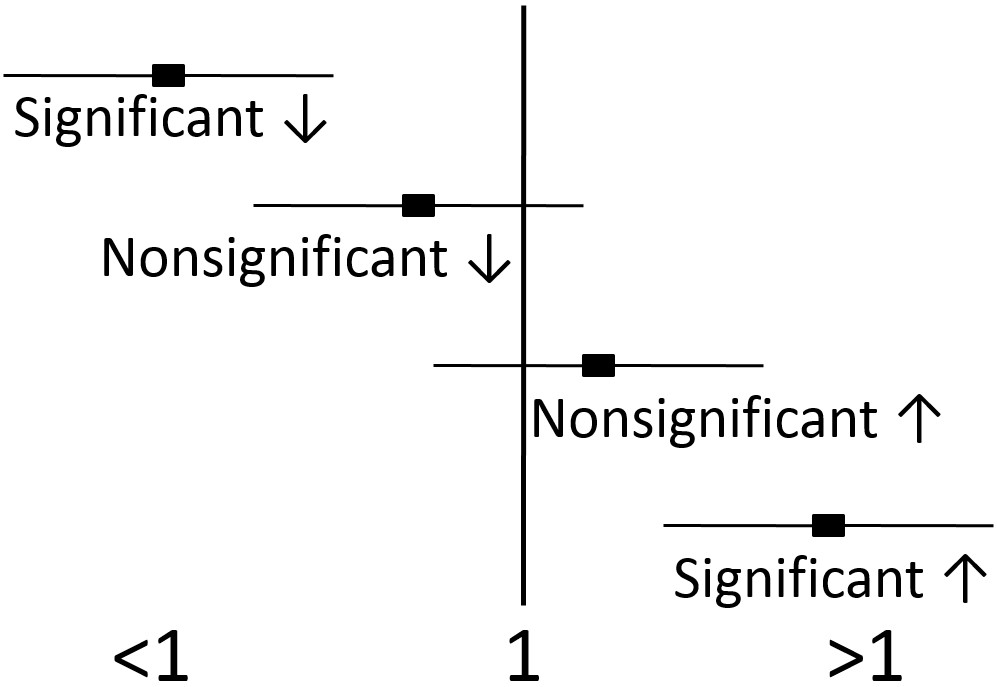
If the 95% confidence intervals of the OR, RR, or HR does not include or overlap 1, then the value is significant. If the 95% confidence intervals include or overlap 1, then the OR, RR, or HR is not significant, because it is possible the the true value is 1, which is neutral, and can not be significantly different than 1.
1.7 Interpreting Research
Now that you are familiar with the different forms of nutrition research, the next step is understanding how to interpret and synthesize the information. To synthesize information on a certain topic, the two most popular methods are meta-analyses and systematic literature reviews. While there are differences between these two methods, they are similar overall in that they aim to draw a conclusion from the body of research evidence rather than from one study. We will focus on systematic literature reviews because of their rising popularity in biomedical literature.
A systematic literature review does what the name implies, it systematically reviews the literature related to a certain research question. For example, the research question might be, "Does chocolate decrease blood pressure?" There is a method for performing the review established ahead of time that details answers to questions such as:
How will journal articles be identified?
Using what databases?
What search terms will be used?
The end product is a conclusion based on the evidence in the identified journal articles. A person in the following video compares it to reading Consumer Reviews or a consumer report about something that you are going to buy. The Cochrane Collaboration performs many systematic reviews; the first link is to a video about the Cochrane Collaboration, the second is a link to the site itself.
| Web Links |
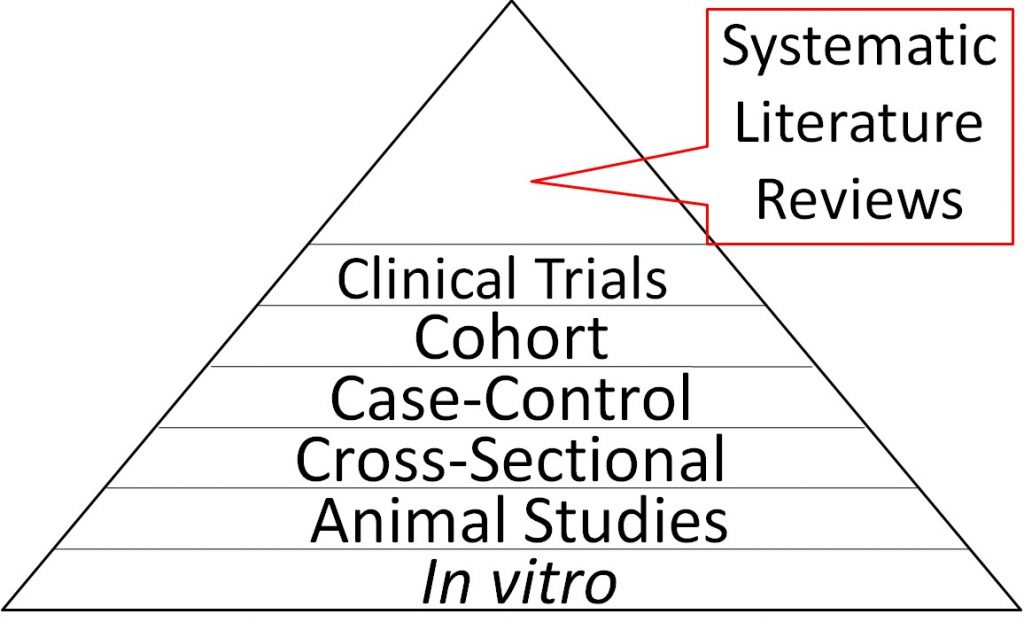
Because they synthesize the findings from multiple trials, systematic literature reviews are considered the highest level of nutrition research evidence and are therefore shown at the top of the strength of nutrition research pyramid below. In vitro studies are shown at the bottom of the triangle because they are the weakest form of evidence overall. It should be pointed out that most systematic literature reviews only consider epidemiological studies and clinical trials and do not include animal studies or in vitro evidence. While these studies are of less strength, they should still be considered.
There are a couple of other factors to consider relating to the different forms of research. First, epidemiological studies cannot show causality (i.e. smoking causes lung cancer), but instead identify relationships or associations (i.e. smoking is associated with lung cancer occurrence). Clinical trials/human studies are the best form of primary research because their findings should be directly translatable to patients. So why use other forms of research? The description below should help explain why the other forms of research are also important.
In general, a certain sequence of studies in nutrition research is often followed as shown in the figure below.
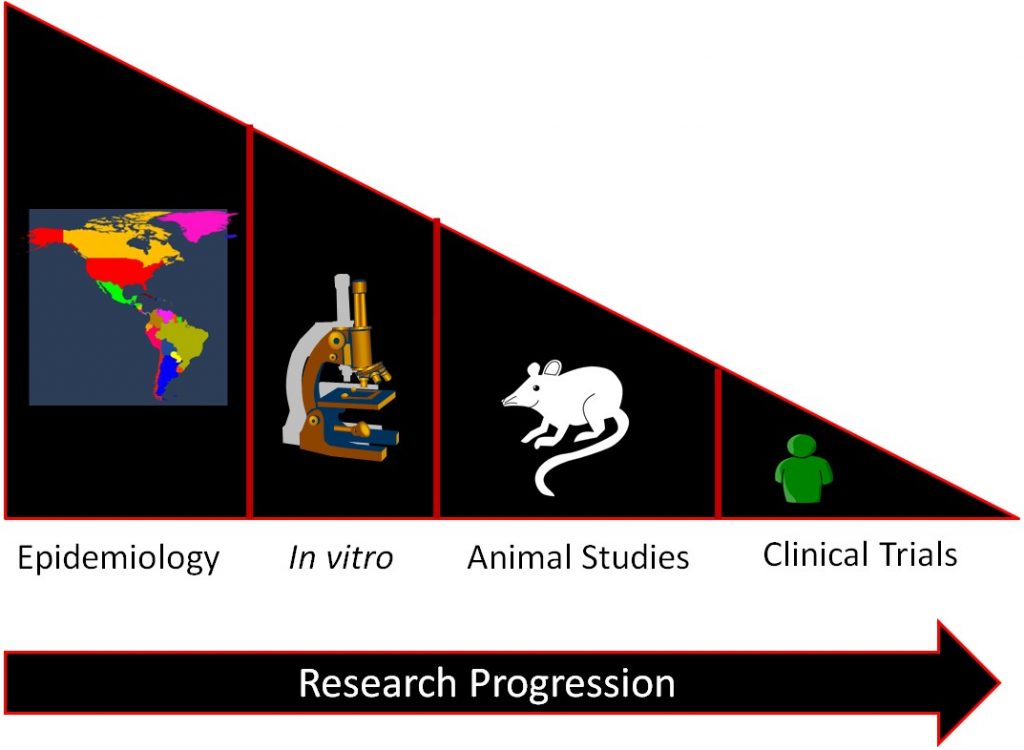
Epidemiological studies find relationships between food/food components and a specific health outcome. This relationship is then investigated by in vitro studies and then, some of the most promising move to animal studies. Then the most promising and safe food/food components are moved into clinical trials/human studies. If it is an individual compound, there will be smaller trials designed to see if the compound is safe before it is moved into larger clinical trials to determine whether the food/food component results in beneficial health outcomes. The overall effect of this process is to select the most promising and safe food/food components for the clinical trials/human studies. This allows time and money to be used more efficiently, because while clinical trials/human studies are the best form of research, they are also normally the most expensive and time-consuming.
Researchers nevertheless have been tempted to skip directly to clinical trials in the past rather than following the research progression. To illustrate what happens in these situations, the following describes a couple of examples when "normal" research progression hasn't been followed.
Beta-Carotene and Lung Cancer
In the early 1980s there was a lot of excitement among researchers over the epidemiological evidence showing that higher dietary consumption of the carotenoid, beta-carotene, decreased lung cancer risk[4]. By the mid 1980’s, two large, randomized, placebo-controlled trials began to determine whether high-dose β-carotene supplementation (far higher than dietary intake) could decrease lung cancer incidence in high-risk populations before in vitro or animal studies had investigated this relationship. The research community was shocked when these two studies were terminated early in the mid 1990s because of significant increases in lung cancer incidence among smokers receiving β-carotene supplements[5],[6]. In vitro and animal studies completed after the clinical trial found that as β-carotene intake shifts from normal dietary levels to high, supplement-type levels, the effect on lung cancer development also shifts from beneficial to detrimental in combination with smoke or carcinogen exposure[7]. Thus, if the normal research progression had been followed, it is likely that a lower dose of beta-carotene would have been used or trials wouldn't have been undertaken at all.
Selenium, Vitamin E, and Prostate Cancer
Another example of when the research progression was not followed was the relationship between selenium, vitamin E, and prostate cancer. Two clinical trials had found secondary results that suggested that selenium and vitamin E supplementation may decrease prostate cancer risk [8],[9]. A secondary result means it was not the primary outcome that the clinical trial was designed to find, thus they need to be interpreted with some caution. Rather than examining the relationship using in vitro and animal studies, a clinical trial was undertaken to determine if selenium and vitamin E supplementation alone, or in combination, could decrease the development of prostate cancer incidence[10]. This clinical trial was also terminated early because of a nonsignificant increase in prostate cancer in those receiving vitamin E[11], and a nonsignificant increase in diabetes among those receiving selenium[12]. In vitro studies and animal models performed since the clinical trial was undertaken and after its termination suggest that vitamin E is not effective and that another form of selenium could have possibly been more effective[13].
In addition to the lessons learned about the sequence of research in nutrition, these studies add to growing evidence that suggests that single-agent interventions, even in combination, may not be an effective strategy for improving health. The common nutrition research approach, after epidemiology finds an association or relationship, is to use in vitro and animal studies to identify the specific compound in a certain food that is responsible. This has been termed the reductionist approach because it takes something complex (food) and reduces it down to its simpler components. However, there is growing evidence that this may be a flawed approach. Some nutrition researchers feel that more focus should be on the food itself, rather than trying to discern exactly what is responsible for the beneficial health outcomes. Because it may not be one or 2 compounds alone that are responsible for the effect, it might be difficult to determine from the multitude of nutrients in foods which are responsible for the beneficial effect. This will mean changes in the overall research approach, especially at the human intervention studies/clinical trials level, because in most cases there is not a way to give a “placebo food”[14],[15].
Links
Video: The Cochrane Collaboration - http://www.youtube.com/watch?v=AhtchOL1ofc
The Cochrane Colaboration - http://www.cochrane.org/
- Artaud-Wild SM, Connor SL, Sexton G, Connor WE. (1993) Differences in coronary mortality can be explained by differences in cholesterol and saturated fat intakes in 40 countries but not in france and finland. A paradox. Circulation 88(6): 2771.[\footnote]. A paradox means something contradictory, which this finding seemed to be. The "French Paradox" has led to research on red wine, and one of its active components, resveratrol, because the French consume a lot of this alcoholic beverage. Cross-sectional studies are considered the weakest type of epidemiology because they are based only on group outcomes. This may lead people to believe that members of the group have characteristics, which as individuals they do not. This is known as ecologic (another name that is used to refer to this type of study) fallacy, and is a limitation of cross-sectional studies[footnote]Gordis L. (2004) Epidemiology. Philadelphia, PA: Elsevier Saunders. ↵
- Giovannucci E, Ascherio A, Rimm EB, Stampfer MJ, Colditz GA, et al. (1995) Intake of carotenoids and retinol in relation to risk of prostate cancer. J Natl Cancer Inst 87(23):1767-1776. ↵
- http://www.merriam-webster.com/dictionary/bias ↵
- Peto R, Doll R, Buckley JD, Sporn MB. Can dietary beta-carotene materially reduce human cancer rates? Nature 290, 201-208, 1981. ↵
- The effect of vitamin E and beta carotene on the incidence of lung cancer and other cancers in male smokers. the alpha-tocopherol, beta carotene cancer prevention study group. N Engl J Med. 330, 1029-1035, 1994. ↵
- Goodman GE, Thornquist MD, Balmes J, Cullen MR, Meyskens FL,Jr., Omenn GS, et al. The beta-carotene and retinol efficacy trial: Incidence of lung cancer and cardiovascular disease mortality during 6-year follow-up after stopping beta-carotene and retinol supplements. J Natl Cancer Inst 96, 1743-1750, 2004. ↵
- Lindshield BL, Erdman JW. (2006) Carotenoids. In: Bowman BA, Russell RM, editors. Present Knowledge in Nutrition. Washington, D.C.: International Life Sciences Institute. pp. 184-197. ↵
- Clark LC, Dalkin B, Krongrad A, Combs GF,Jr., Turnbull BW, Slate EH, et al. Decreased incidence of prostate cancer with selenium supplementation: Results of a double-blind cancer prevention trial. Br J Urol 81, 730-734, 1998. ↵
- Heinonen OP, Albanes D, Virtamo J, Taylor PR, Huttunen JK, Hartman AM, et al. Prostate cancer and supplementation with alpha-tocopherol and beta-carotene: Incidence and mortality in a controlled trial. J Natl Cancer Inst 90, 440-446, 1998. ↵
- Lippman SM, Goodman PJ, Klein EA, Parnes HL, Thompson IM,Jr., Kristal AR, et al. Designing the selenium and vitamin E cancer prevention trial (SELECT). J Natl Cancer Inst 97, 94-102, 2005. ↵
- Klein EA, Thompson IM, Tangen CM, Crowley JJ, Lucia MS, Goodman PH, Minasian LM, Ford LG, Parnes HL, Gaziano JM, Karp DD, Lieber MM, Walther PJ, Klotz L, Parsons JK, Chin JL, Darke AK, Lippman SM, Goodman GE, Meysken FL, Baker LH. Vitamin E and the Risk of Prostate Cancer: The Selenium and Vitamin E Cancer Prevention Trial (SELECT). JAMA 306, 1549-1556, 2011. ↵
- Lippman SM, Klein EA, Goodman PJ, Lucia MS, Thompson IM, Ford LG, et al. Effect of selenium and vitamin E on risk of prostate cancer and other cancers: The selenium and vitamin E cancer prevention trial (SELECT). JAMA 301, 39-51, 2009. ↵
- Lindshield, B.L., Ford, N.A., Canene-Adams, K., Diamond A.M., Wallig, M.A., Erdman, J.W., Jr. Selenium, but not lycopene or vitamin E, decreases growth of transplantable Dunning R3327-H rat prostate tumors. PLoS One. 2010. ↵
- Gann PH, Khachik F. Tomatoes or lycopene versus prostate cancer: Is evolution anti-reductionist? J Natl Cancer Inst 95, 1563-1565, 2003. ↵
- Gann PH. Randomized trials of antioxidant supplementation for cancer prevention: First bias, now chance--next, cause. JAMA 301, 102-103, 2009. ↵
