Main Body
Blood, Bones & Teeth Micronutrients
This chapter is a collection of vitamins and minerals that are involved in the structure or function of blood, bones and teeth. The individual sections are:
12.1 Vitamin D
12.2 Calcium
12.3 Phosphorus
12.4 Fluoride
12.5 Vitamin K
12.6 Vitamin A
12.7 Iron
12.8 Zinc
12.9 Copper
12.1 Vitamin D
Vitamin D is unique among the vitamins in that it is part vitamin, part hormone. It is considered part hormone for two reasons: (1) we have the ability to synthesize it, and (2) it has hormone-like functions. The amount synthesized, however, is often not enough to meet our needs. Thus, we need to consume this vitamin under certain circumstances, meaning that vitamin D is a conditionally essential micronutrient.
There are two major dietary forms of vitamin D: the form produced mainly by plants and yeast is vitamin D2 (ergocalciferol), and the form mainly made by animals is vitamin D3 (cholecalciferol). The mainly terms in the previous sentence are because lichens, a symbiotic relationship between 2 bacteria and a fungus, are able to synthesize vitamin D3, and are being utilized some now commercially as described in the following article.
| Web Link
Veggie D3 maker explores novel production process to secure future funding supplies |
The structures of these two forms are shown below. Notice that the only difference is the presence of a double bond in D2 that is not in D3.

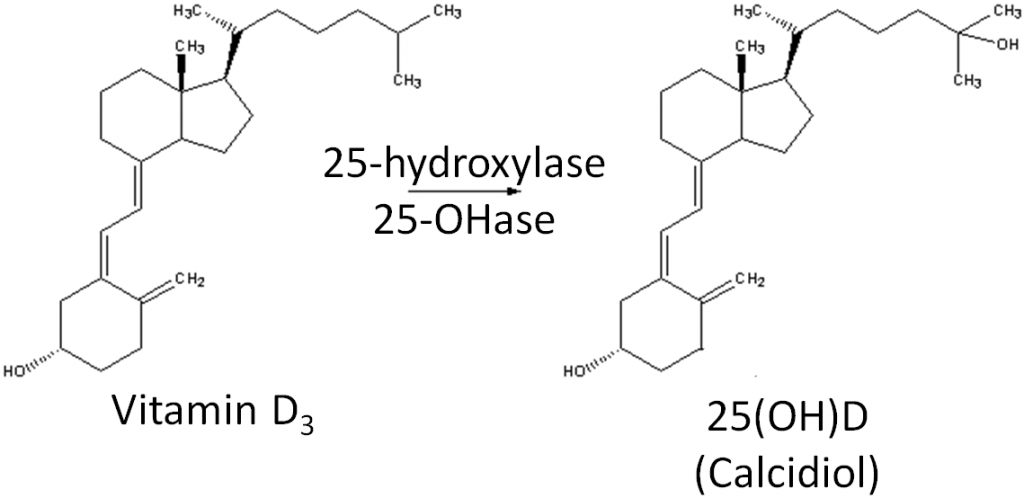
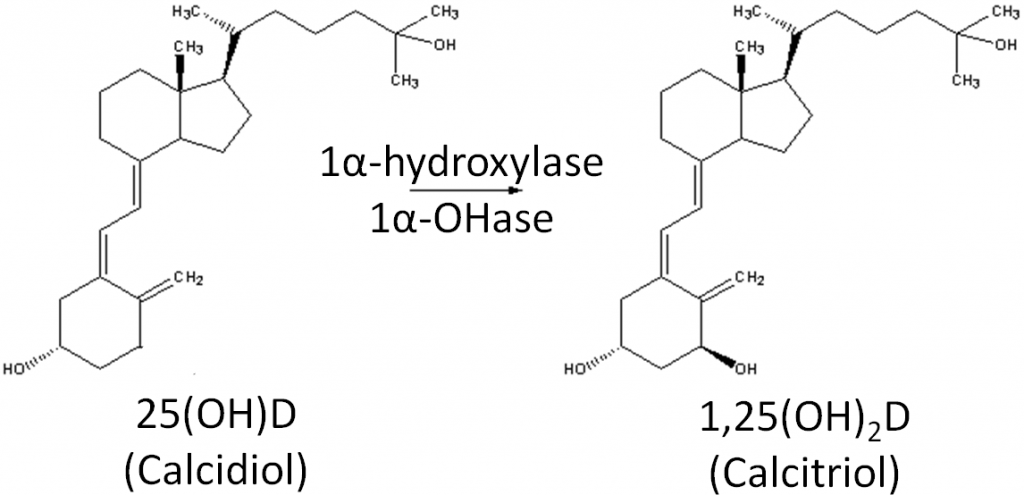
We synthesize vitamin D3 from cholesterol, as shown below. In the skin, cholesterol is converted to 7-dehydrocholesterol. In the presence of UV-B light, 7-dehydrocholesterol is converted to vitamin D3. Synthesized vitamin D will combine with vitamin D-binding protein (DBP) to be transported to the liver. Dietary vitamin D2 and D3 is transported to the liver via chylomicrons and then taken up in chylomicron remnants. Once in the liver, the enzyme 25-hydroxylase (25-OHase) adds a hydroxyl (-OH) group at the 25th carbon, forming 25-hydroxy vitamin D (25(OH)D, calcidiol). This is the circulating form of vitamin D, thus 25(OH)D blood levels are measured to assess a person’s vitamin D status. The active form of vitamin D is formed with the addition of another hydroxyl group by the enzyme 1alpha-hydroxylase (1alpha-OHase) in the kidney, forming 1,25 hydroxy vitamin D (1,25(OH)2D). The synthesis and activation of vitamin D is shown in the figures below.
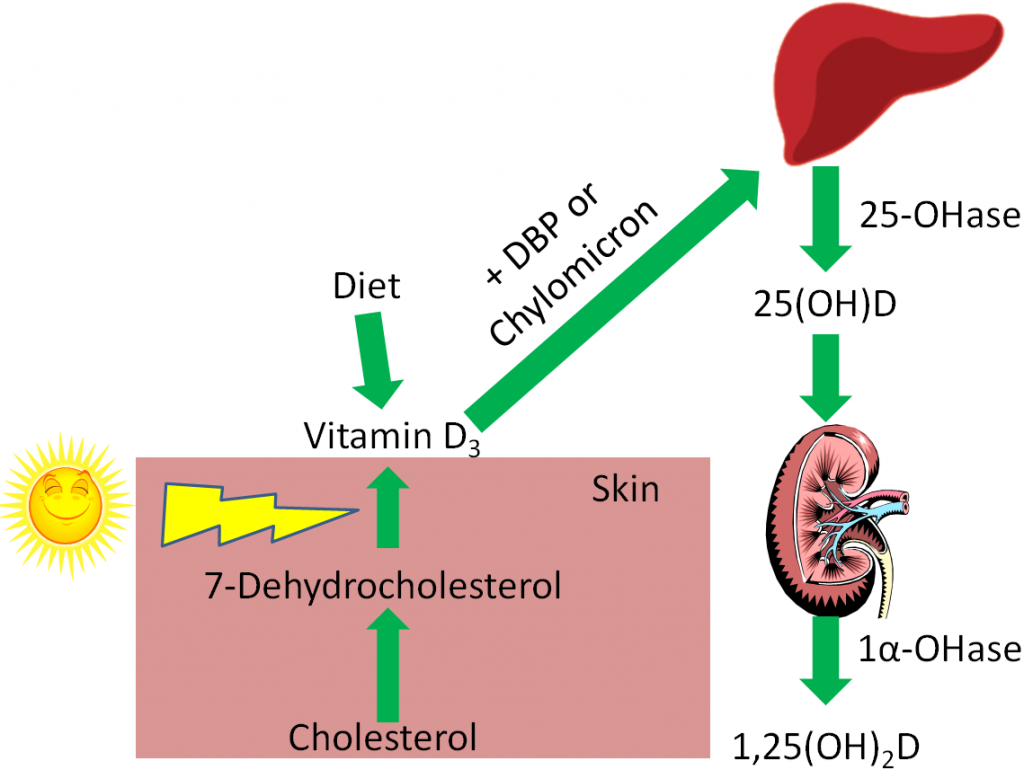
However, there are a number of other tissues that have been found to have 1alpha-hydroxylase activity. Therefore, these tissues can activate circulating 25(OH)D to 1,25(OH)2D for their own use.
Vitamin D2 and D3 were once thought to be equivalent forms of vitamin D, but research has found that D3 supplementation increases 25(OH)D levels more than D2 supplementation7,8.
Subsections:
12.11 Environmental Factors That Impact Vitamin D3 Synthesis
12.12 Dietary or Supplemental Vitamin D
12.13 Response to Low Blood Calcium
12.14 Response to High Blood Calcium
12.15 Vitamin D Receptor
12.16 Vitamin D Deficiency, Toxicity, & Insufficiency
References & Links
- http://en.wikipedia.org/wiki/File:Ergocalciferol.svg
- http://en.wikipedia.org/wiki/File:Cholecalciferol.svg
- Gropper SS, Smith JL, Groff JL. (2008) Advanced nutrition and human metabolism. Belmont, CA: Wadsworth Publishing.
- http://commons.wikimedia.org/wiki/File:Liver.svg
- https://en.wikipedia.org/wiki/Vitamin_D#/media/File:Reaction_-_cholecalciferol_to_calcidiol.png
- https://en.wikipedia.org/wiki/Vitamin_D#/media/File:Reaction_-_calcidiol_to_calcitriol.png
- Lehmann U, Hirch F, Stangl GI, Hinz K, Westphal S, Dierkes J. (2013) Bioavailability of vitamin D2 and D3 in Healthy Volunteers, a randomized placebo-controlled trial. J Clin Endocrinol Metab. 98(11): 4339-4345.
- Tripkovic L, Wilson LR, Hart K, Johnsen S, de Lusignan S, Smith CP, Bucca G, Penson S, Chope G, Elliott R, Hypponen E, Berry JL Lanham-New SA. (2017) Daily supplementation with 15 μg vitamin D2 compared with vitamin D3 to increase wintertime 25-hydroxyvitamin D status in healthy South Asian and white European women: a 12-wk randomized, placebo-controlled food-fortification trial. Am J Clin Nutr 106 (2): 481-490.
Link
Veggie D3 maker explores novel production process to secure future funding supplies – https://www.nutraingredients-usa.com/Article/2012/03/13/Veggie-vitamin-D3-maker-explores-novel-production-process-to-secure-future-supplies?utm_source=newsletter_daily&utm_medium=email&utm_campaign=Newsletter%2BDaily&c=yazB%2FDHFv2VlvQJ3xinVgQ%3D%3D
12.11 Environmental Factors That Impact Vitamin D3 Synthesis
There are a number of environmental factors that affect vitamin D3 synthesis:
Latitude
Season
Time of Day
Skin Color
Age
Clothing
Sunscreen
Latitude
The latitude a person is at affects that person’s ability to synthesize vitamin D3. There is an inverse relationship between distance from the equator and UV light exposure. Thus, with increased distance from the equator (increased latitude), there is decreased UV light exposure and vitamin D3 synthesis. The link below shows the latitude and longitude lines of the United States.
| Web Link |
Seasons
Seasons also make a difference in vitamin D3 synthesis. In Boston (42० N), vitamin D synthesis only occurs from March-October, because during late fall and winter not enough UV-B reaches the earth’s surface to synthesize vitamin D3. However, in Los Angeles (34० N), vitamin D3 synthesis occurs year round2. The difference is the angle of the sun relative to latitude and how many UV-B photons are absorbed before they reach the earth’s surface1.

Time
Time of day is also an important factor in affecting vitamin D3 synthesis. Vitamin D3 synthesis increases in the morning before peaking at noon, then declines the rest of the day1.

Skin pigmentation
Another factor that plays an important role in vitamin D3 synthesis is skin pigmentation. Skin color is the result of increased production of the pigment melanin, as shown in the link below.
| Web Link |
Very dark skin color can provide a sun protection factor (SPF) 8-30 for those individuals who never burn2. These individuals will require approximately 5- to 10-times greater sunlight exposure than a light-skinned, white person to synthesize the same amount of vitamin D32,3.
Age
Age also plays a factor in vitamin D3 synthesis. Aging results in decreased 7-dehydrocholesterol concentrations in the skin, resulting in an approximately 75% reduction in the vitamin D3 synthesis capability by age 703.

Clothing
Clothing is another factor that influences vitamin D3 synthesis. More clothing means that less sun reaches your skin, and thus less vitamin D3 synthesis.

Sunscreen, “Sensible Sun Exposure”, and Tanning
There is quite a spirited debate on sunscreen, sun exposure, skin cancer, and vitamin D synthesis. On one side are the vitamin D researchers, on the other side are dermatologists. Vitamin D research found that SPF 8 sunscreen almost totally blocked vitamin D3 synthesis4. However, the SPF value equals 1/(# photons that reaches your skin) meaning that SPF 30 means 1/30 UV photons reach your skin. Thus, vitamin D3 synthesis shouldn’t be totally blocked. In addition, studies indicate that consumers apply 1/2 or less of the amount required to get the listed SPF protection4. Researchers recommend sun exposure on the face, arms, and hands for 10-15 minutes 2-3 times per week between 10 AM-3 PM2,5. However, dermatologists do not like “sensible sun exposure” because this is also the peak time for harmful sun exposure. Dermatologists say that “sensible sun exposure” appeals to those who are looking for a reasons to support tanning and are at highest risk (primarily young, fair-skinned females) of sun damage. They argue that vitamin D can be provided through supplementation3.
What about tanning beds? Not all tanning beds provide UV-B rays that are needed for vitamin D3 synthesis. In fact, some advertise that they only use UV-A rays that are safer, even though this is not the case6. Virtually every health organization advises against using tanning beds, because the risks are far greater than the potential benefits6,7.
References & Links
- Shils ME, Shike M, Ross AC, Caballero B, Cousins RJ, editors. (2006) Modern nutrition in health and disease. Baltimore, MD: Lippincott Williams & Wilkins.
- Holick M. (2008) Vitamin D: A D-lightful health perspective. Nutr Rev 66(10 Suppl 2): S182.
- Stipanuk MH. (2006) Biochemical, physiological, & molecular aspects of human nutrition. St. Louis, MO: Saunders Elsevier.
- Gilchrest B. (2008) Sun exposure and vitamin D sufficiency. Am J Clin Nutr 88(2): 570S.
- Byrd-Bredbenner C, Moe G, Beshgetoor D, Berning J. (2009) Wardlaw’s perspectives in nutrition. New York, NY: McGraw-Hill.
- Whitney E, Rolfes SR. (2011) Understanding nutrition. Belmont, CA: Wadsworth Cengage Learning.
- McGuire M, Beerman KA. (2011) Nutritional sciences: From fundamentals to food. Belmont, CA: Wadsworth Cengage Learning.
Links
United States Latitude and Longitude Lines – http://modernsurvivalblog.com/survival-skills/basic-map-reading-latitude-longitude/
Melanin – http://www.nytimes.com/imagepages/2007/08/01/health/adam/9620Melanin.html
12.12 Dietary or Supplemental Vitamin D
Because of the possible double-edged sword of sun exposure for synthesizing vitamin D3, consuming vitamin D from the diet or supplements is the alternative.
However, there are a limited number of food naturally rich in vitamin D. Good sources of vitamin D are fatty fish (salmon, tuna, etc.) and their oils (such as cod liver oil). The amount in fatty fish varies greatly with wild-caught salmon being the highest. One study showed that farmed salmon contained almost 75% less vitamin D than wild-caught salmon1. It is not known whether this disparity exists between other types of farmed and wild-caught fish varieties.
Table 12.121 Vitamin D content of fish1
| Fish | Vitamin D (IU/oz) |
| Blue Fish | 280 ± 68 |
| Cod | 104 ± 24 |
| Grey Sole | 56 ± 36 |
| Farmed Salmon | 240 ± 108 |
| Wild Salmon | 988 ± 524 |
| Farmed Trout | 388 ± 212 |
| Tuna | 404 ± 440 |
Like vitamin C, E, and A, international units (IU) are also used for vitamin D.
For vitamin D the conversions are:
1 ug of D3 = 40 IU
1 ug of 25-OH-D = 200 IU2
Thus, since not many foods contain vitamin D, many brands of milk have been fortified with vitamin D2 or D3 (100 IU/8 oz) since the 1930s3. However, the actual measured amount of vitamin D in many brands of milk is far less than stated on their labels4,5. Part of this problem stems from a lack of a standardized method for measuring vitamin D in the past. Without standardized analysis, there inevitably was a wide range of variation from lab to lab in the reported amount of vitamin D.
Another issue with relying on dairy products to provide vitamin D is the common problem of lactose intolerance. Lactose intolerant individuals don’t have lactase, the enzyme needed to break down lactose. Common symptoms of this condition include:
Abdominal Pain
Abdominal Bloating
Gas
Diarrhea
Nausea6
Lactose intolerance is a fairly common problem worldwide, as shown in the map below.

The following table shows the percent of people who are lactose intolerant by race:
Table 12.122 Lactose intolerance rates8
| Race or ethnicity | % Lactose Intolerant |
| Southeast Asian | 98% |
| Native Americans | 62-100%9 |
| Asian Americans | 90% |
| Alaskan Eskimo | 80% |
| African-American Adults | 79% |
| Mexicans (rural communities) | 74% |
| North American Jews | 69% |
| Greek Cypriots | 66% |
| Cretans | 56% |
| Mexican American Males | 55% |
| Indian Adults | 50% |
| African-American Children | 45% |
| Indian Children | 20% |
| Descendants of N. Europeans | 5% |
Thus, you can see that many people are lactose intolerant. Coincidentally, many of these people have darker pigmented skin, meaning that they have an increased risk of vitamin D deficiency/insufficiency because they require greater sun exposure to synthesize adequate amounts of vitamin D3.
Other foods that are sometimes fortified are breakfast cereals and orange juice. Despite the fact that orange juice doesn’t contain fat, and vitamin D is fat-soluble, vitamin D is quite bioavailable in orange juice10.
Vitamin D in supplements is found as vitamin D2 or D3. However, based on the recent evidence suggesting that D2 isn’t as beneficial as D3, many are being reformulated to contain D311.
References & Links
- Lu Z, Chen TC, Zhang A, Persons KS, Kohn N, et al. (2007) An evaluation of the vitamin D3 content in fish: Is the vitamin D content adequate to satisfy the dietary requirement for vitamin D? J Steroid Biochem Mol Biol 103(3-5): 642.
- Anonymous. (1997) Dietary reference intakes for calcium, phosphorus, magnesium, vitamin D, and fluoride. Washington, D.C.: National Academies Press.
- Stipanuk MH. (2006) Biochemical, physiological, & molecular aspects of human nutrition. St. Louis, MO: Saunders Elsevier.
- Holick MF, Shao Q, Liu WW, Chen TC. (1992) The vitamin D content of fortified milk and infant formula. New England Journal of Medicine, the 326(18): 1178.
- Faulkner H, Hussein A, Foran M, Szijarto L. (2000) A survey of vitamin A and D contents of fortified fluid milk in ontario. J Dairy Sci 83(6): 1210.
- http://digestive.niddk.nih.gov/ddiseases/pubs/lactoseintolerance/
- https://commons.wikimedia.org/wiki/File:World_map_of_lactose_intolerance.png
- http://nutrigenomics.ucdavis.edu/?page=Information/Concepts_in_Nutrigenomics/Lactose_Intolerance
- McBean LD, Miller GD. (1998) Allaying fears and fallacies about lactose intolerance. J Am Diet Assoc 98(6): 671.
- Tangpricha V, Koutkia P, Rieke S, Chen T, Perez A, et al. (2003) Fortification of orange juice with vitamin D: A novel approach for enhancing vitamin D nutritional health. Am J Clin Nutr 77(6): 1478.
- https://ods.od.nih.gov/factsheets/VitaminD-HealthProfessional/
12.13 Response to Low Blood Calcium
One of the major functions of vitamin D is to assist in maintaining blood calcium concentrations. The other major regulators of blood calcium levels are 2 hormones: parathyroid hormone (PTH) and calcitonin, which are released from the parathyroid glands and thyroid glands, respectively. Bone serves as the calcium depot, or reservoir, if there is a sufficient concentration in the body. In bone, calcium is found in hydroxyapatite crystals on a collagen matrix.
The chemical formula of hydroxyapatite is:
Ca10(PO4)6(OH)2
Calcium and phosphorus are either jointly deposited (deposition) or jointly liberated (resorption) from bone hydroxyapatite to maintain/achieve blood calcium concentrations. Osteoblasts are bone cells that are responsible for bone formation or depositing hydroxyapatite. Osteoclasts are the bone cells that are responsible for breaking down or resorption of bone. An easy way to remember the function of these cells is:
Osteoblasts “build” bone
Osteoclasts “chew” bone
Bone resorption is the process of liberating calcium and phosphorus from hydroxyapatite.
Bone deposition is the process of depositing calcium and phosphorus in bone as hydroxyapatite.
Response to Low Blood Calcium
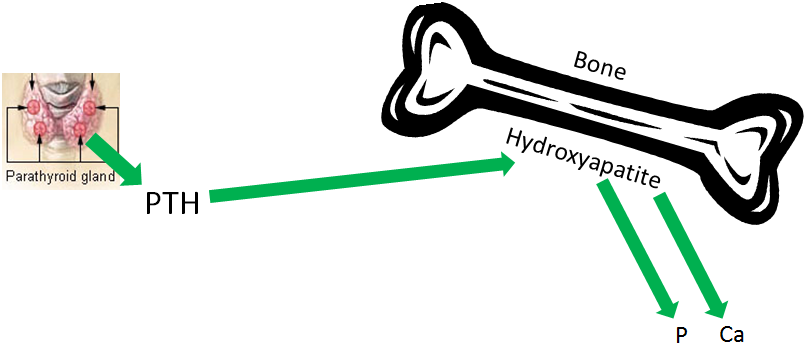
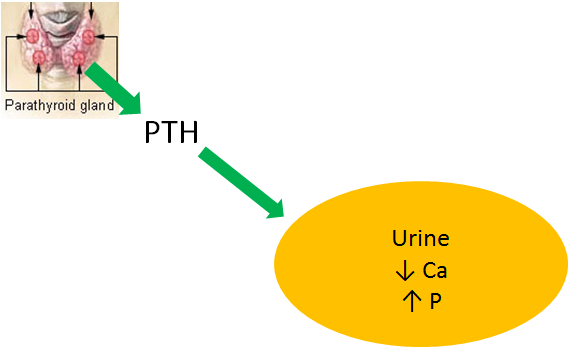
The parathyroid senses low blood calcium concentrations and releases PTH. These steps are designed to maintain consistent blood calcium levels, but also affects phosphate (phosphorus) levels. PTH has 3 effects:
- Increases bone resorption
- Decreases calcium and increases phosphorus urinary excretion
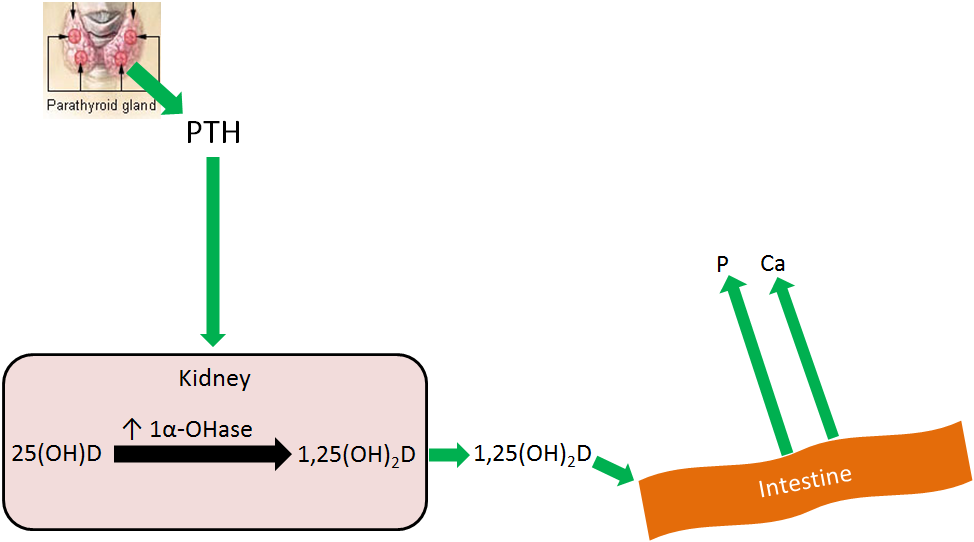
- Increases 1,25(OH)2D activation in the kidney1,2
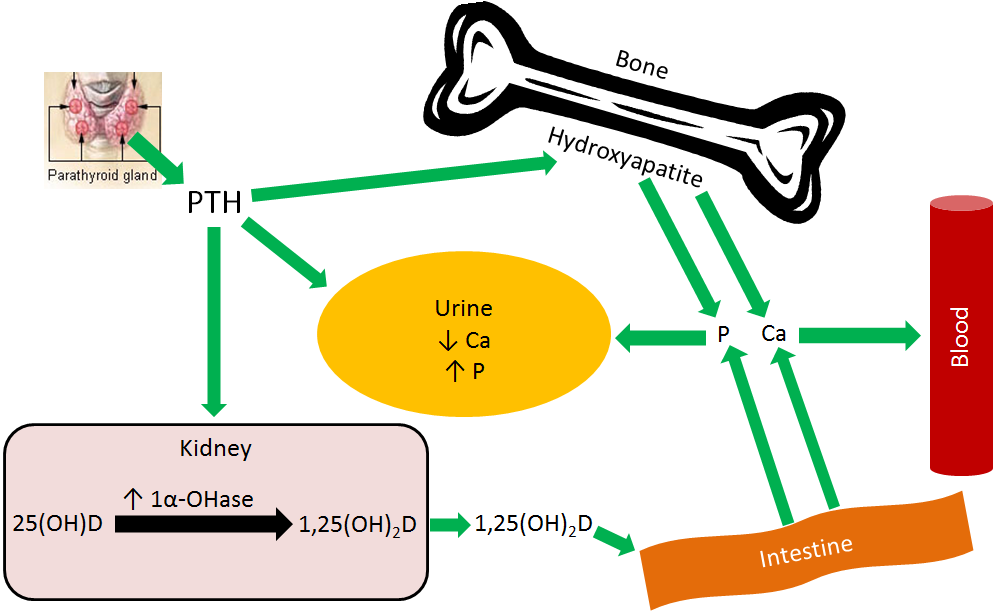
The first effect of PTH is increased bone resorption. Hydroxyapatite must be broken down to release both calcium and phosphate. This effect is illustrated below.
The second effect of PTH is decreased calcium excretion in urine. This is a result of increased calcium reabsorption by the kidney before it is excreted in urine. Kidney phosphate reabsorption is decreased, meaning the net effect is less calcium, but more phosphate in urinary excretion, as shown in the figure below.
The 3rd effect of PTH is that it increases 1,25(OH)2D activation in the kidney, by increasing 1alpha-hydroxylase levels. The 1,25(OH)2D then increases calcium and phosphorus absorption in the small intestine to help raise blood calcium levels, as shown below. This mechanism will be discussed in more detail in the vitamin D receptor subsection.
Overall PTH causes more calcium and phosphate to be leached from bone, and absorbed from the intestine, into the blood. Coupled with decreased calcium and increased phosphate urinary excretion, means that blood calcium levels rise without a marked rise in phosphate levels, as depicted in the figure below.
References & Links
- Gropper SS, Smith JL, Groff JL. (2008) Advanced nutrition and human metabolism. Belmont, CA: Wadsworth Publishing.
- Whitney E, Rolfes SR. (2011) Understanding nutrition. Belmont, CA: Wadsworth Cengage Learning.
- http://en.wikipedia.org/wiki/File:Illu_thyroid_parathyroid.jpg
12.15 Vitamin D Receptor
Vitamin D, along with vitamin A, are unique among the vitamins because they have nuclear receptors. Many steroid hormones have nuclear receptors. The following figure illustrates the action of a nuclear hormone receptor.
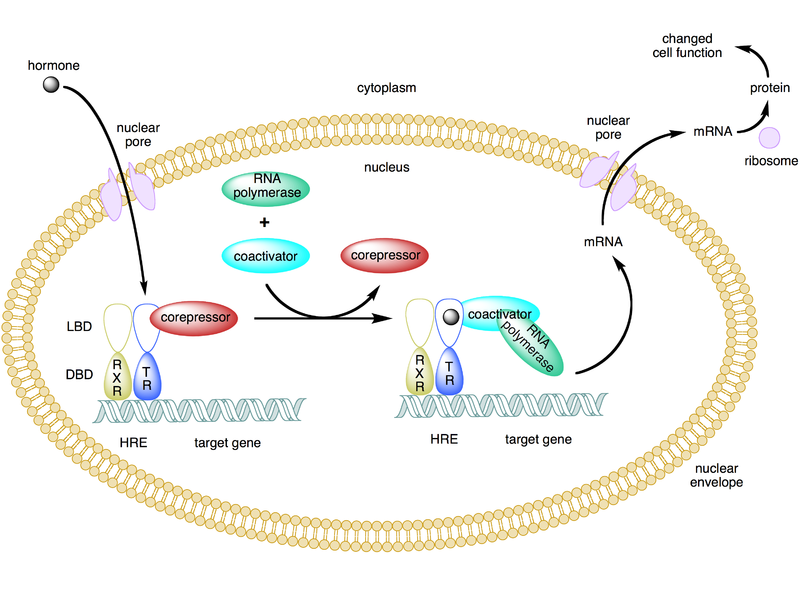
In the figure above of the hormone (in this case thyroid hormone), the receptor’s ligand (something that binds to the receptor), enters the nucleus and binds to the thyroid hormone receptor (TR). The TR has paired (formed a dimer) with the retinoid X receptor (RXR) on the hormone response element (HRE) in the promoter of target genes. The HRE for thyroid hormone is the thyroid hormone response element. Target genes are those whose transcription is altered by the hormone binding to its receptor on the response element. The mRNA produced then leaves the nucleus where it is translated into protein.
Vitamin A and D have nuclear receptors that act in the same fashion as nuclear hormone receptors. The video below very clearly explains the action of a nuclear hormone receptor. A thorough explanation of the nuclear Vitamin D receptor follows.
| Web Link |
1,25(OH)2D is considered to be the active form of vitamin D because it is the form that binds to the vitamin D receptor (VDR). Like the thyroid hormone example above, there is a vitamin D response element (VDRE) in the promoter of specific vitamin D target genes. In the figure below, 25(OH)D, the major circulating form of vitamin D, is usually transported through the blood to the kidney by vitamin D binding protein (DBP). Again, the kidney converts 25(OH)D to 1,25(OH)2D by use of the enzyme 1alpha-hydroxylase. 1,25(OH)2D (bound to DBP) moves from the kidney , or the tissue itself, into the nucleus. It then binds to the vitamin D receptor (VDR), that is dimerized to the RXR on the vitamin D response element of the target gene. Consequently, this then increases transcription of mRNA. The mRNA then moves into the cytoplasm to synthesize specific proteins. This process is shown in the figure below.
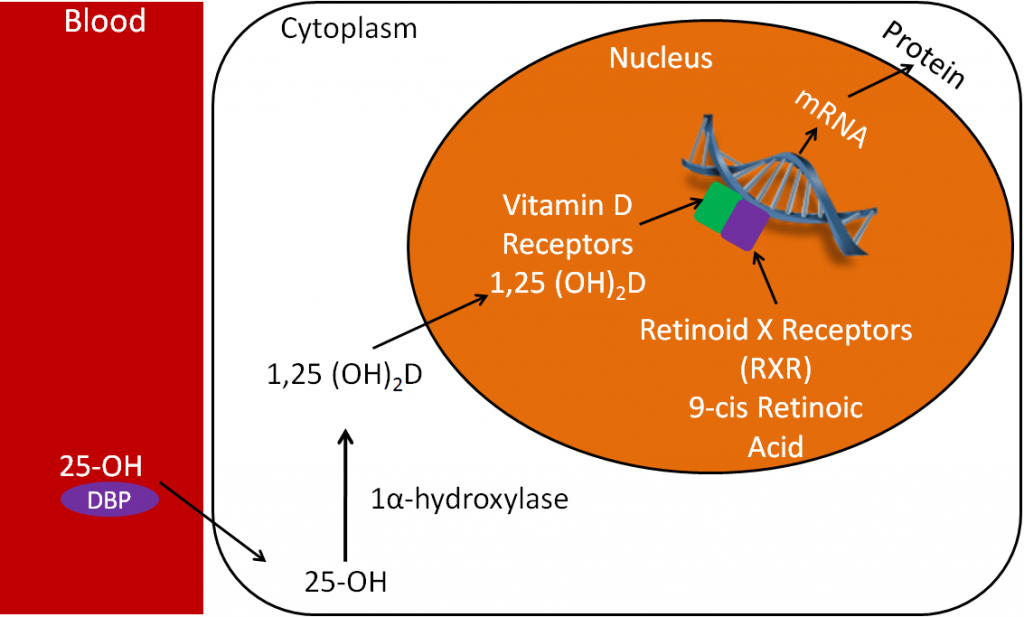
It’s through this action that 1,25(OH)2D is able to increase calcium absorption. In this case, the target gene is the calcium-binding protein calbindin. Thus, increased 1,25(OH)2D leads to increased calbindin mRNA. This then leads to increased calbindin protein levels. Calbindin will be discussed in more detail in the calcium section.

References & Links
- http://en.wikipedia.org/wiki/File:Type_ii_nuclear_receptor_action.png
Video
Steroid Hormone Receptor – http://www.youtube.com/watch?v=Dxyq8GAWbpo
12.16 Vitamin D Deficiency, Toxicity & Insufficiency
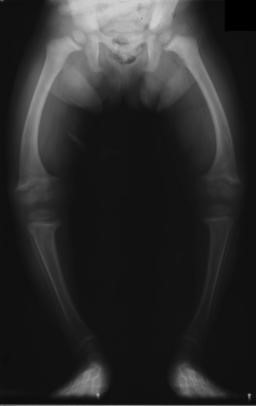
Rickets is a vitamin D deficiency in infants and children. A lack of vitamin D leads to decreased bone mineralization, causing the bones to become weak. The bones then bow under pressure, leading to the characteristic bowed legs, as seen below.
Another characteristic symptom of rickets is rachitic rosary, or beaded ribs. The beading occurs at the areas where cartilage meets bone on the rib cage, as shown in the link below3.
| Web Link |
Osteomalacia is a vitamin D deficiency in adults and results in poor bone mineralization. The bone becomes soft, resulting in bone pain and an increased risk of fractures3.
While rickets and osteomalacia are fairly rare in the United States, it is believed that vitamin D insufficiency might be much more widespread. Insufficiency means that the level of intake, or body status, is suboptimal (neither deficient nor optimal). The figure below illustrates this concept.
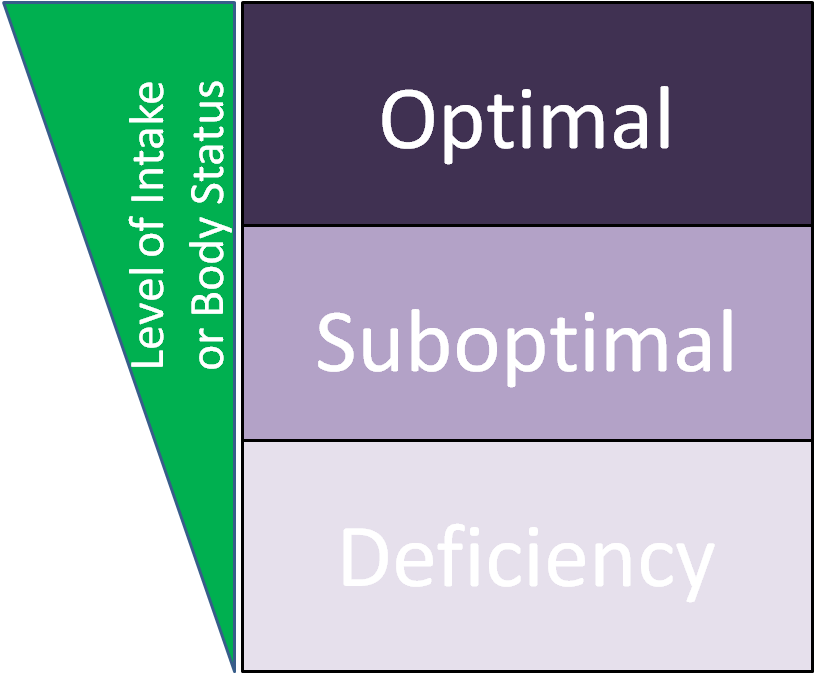
Suboptimal/insufficient means intake, or status, is higher than deficient, but lower than optimal. Thus, higher intake levels will provide additional benefits. The functions of vitamin D are growing by the day due to increased research discoveries. These functions now include benefits beyond bone health, further supporting the importance of vitamin D. In late 2010, an RDA for vitamin D was established (was an Adequate Intake before). This made it, along with calcium, the first micronutrients to have their DRIs revised4. The RDA for vitamin D is 3 times higher than the previous AI. Many believe these are more reasonable levels, while others think that the new RDA is still not high enough. This belief, that many people’s vitamin D intake/status is suboptimal, is challenged by a recent review described in the link below that found that vitamin D did not reduce osteoporosis risk. In addition, a recent meta-analysis (second link) concluded that “there is probably no benefit to expect from vitamin D supplementation in normally healthy people.”
| Web Link |
Vitamin D from supplements can become toxic. You cannot develop vitamin D toxicity from sun exposure, because the sunlight degrades a precursor of vitamin D3 in the skin5. Vitamin D toxicity results in hypercalcemia or high blood calcium levels. These become problematic because it can lead to the calcification of soft tissues.
References & Links
- http://en.wikipedia.org/wiki/File:Rickets_USNLM.gif
- http://en.wikipedia.org/wiki/File:XrayRicketsLegssmall.jpg
- Whitney E, Rolfes SR. (2011) Understanding nutrition. Belmont, CA: Wadsworth Cengage Learning.
- http://iom.nationalacademies.org/Reports/2010/Dietary-Reference-Intakes-for-Calcium-and-Vitamin-D.aspx
- Shils ME, Shike M, Ross AC, Caballero B, Cousins RJ, editors. (2006) Modern nutrition in health and disease. Baltimore, MD: Lippincott Williams & Wilkins.
Links
Rachitic Rosary – http://1.bp.blogspot.com/_ZWqgYBROGHw/S9r9rOb8thI/AAAAAAAAAh4/y8uHS9m42MU/s1600/18111.jpg
Vitamin D Ineffective for Preventing Osteoporosis – http://well.blogs.nytimes.com/2013/10/17/vitamin-d-ineffective-for-preventing-osteoporosis/?
Limits of Vitamin D Supplements – http://well.blogs.nytimes.com/2013/12/11/limits-of-vitamin-d-supplements/?
12.2 Calcium
Calcium is a macromineral and the most abundant mineral in the body. The reason for calcium’s abundance is its distribution in the skeleton, which contains 99% of the calcium in the body.
Subsections:
12.21 Calcium Absorption
12.22 Calcium Bioavailability
12.23 Calcium Functions
12.24 Calcium Deficiency & Toxicity
12.21 Calcium Absorption
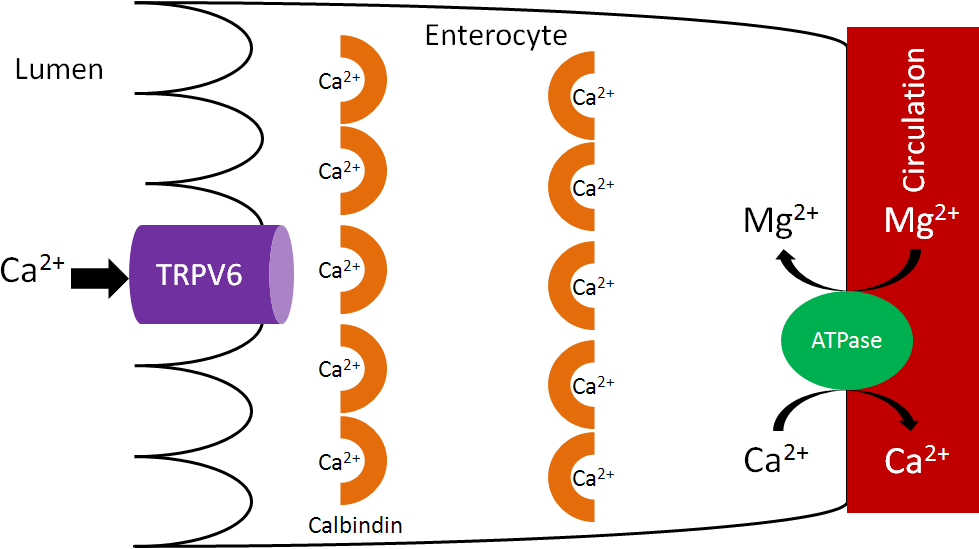
Calcium is taken up into the enterocyte through Transient Receptor Potential V6 (TRPV6), a calcium channel found on the brush border. Calbindin is the calcium binding protein that facilitates uptake through TRPV6 and transport across the enterocyte. Ca2+-Mg2+ ATPase functions to pump calcium out of the enterocyte and into circulation and to pump magnesium into the enterocyte, as shown below1.
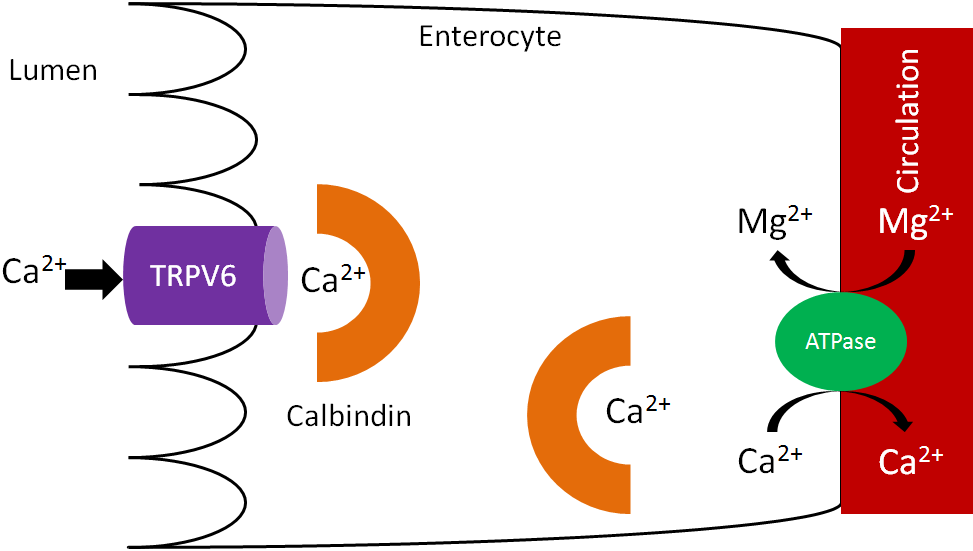
As we have previously discussed, increased 1,25(OH)2D synthesis in the kidney causes increased binding to the vitamin D receptor, which increases calbindin synthesis. Increased calbindin ultimately increases calcium uptake and absorption.
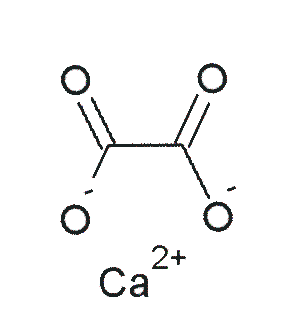
There are a couple of calcium-binding compounds that inhibit its absorption. Therefore, even though some foods are good sources of calcium, the calcium is not very bioavailable. Oxalate, found in high levels in spinach, rhubarb, sweet potatoes, and dried beans, is the most potent inhibitor of calcium absorption2. Recall that calcium oxalate is one of the compounds that makes up kidney stones. Based on this understanding, it should not be a surprise that formation of this compound inhibits calcium absorption.

Another inhibitor of calcium absorption is phytate. Phytate is found in whole grains and legumes3.

References & Links
- Gropper SS, Smith JL, Groff JL. (2008) Advanced nutrition and human metabolism. Belmont, CA: Wadsworth Publishing.
- Shils ME, Shike M, Ross AC, Caballero B, Cousins RJ, editors. (2006) Modern nutrition in health and disease. Baltimore, MD: Lippincott Williams & Wilkins.
- http://en.wikipedia.org/wiki/File:Calcium_oxalate.png
- http://en.wikipedia.org/wiki/File:Phytic_acid.png
12.23 Calcium Functions
Calcium in hydroxyapatite is a major component of bones and teeth.
There are also a number of non-bone functions of calcium. Calcium is an intracellular signaling molecule. Because of this, intracellular calcium is tightly controlled, primarily stored within organelles.
Non-bone functions include:
Neurotransmitter release
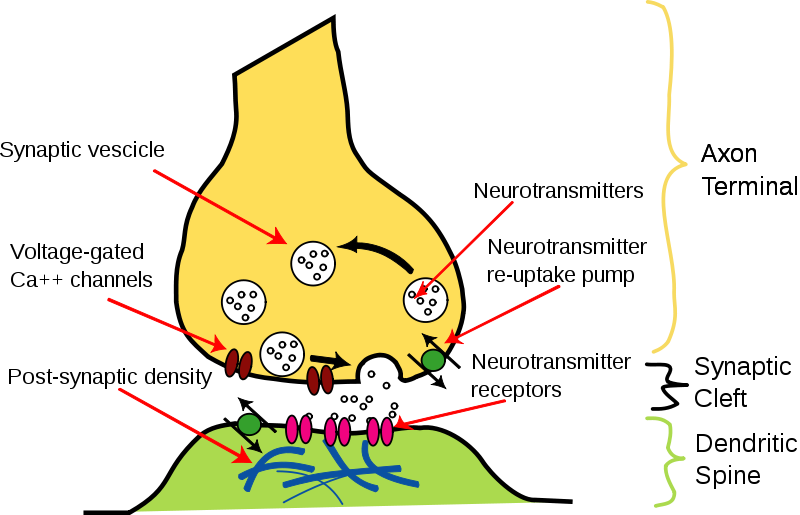
Neurotransmitter release is stimulated by the opening of voltage-gated Ca2+ channels. This stimulates the synaptic vesicle to fuse with the axon membrane and release the neurotransmitter into the synapse, as shown below1.
Muscle contraction
Calcium is released in muscle cells, where it binds to the protein troponin, changes its shape, and removes the tropomyosin blockade of actin active sites so that contraction can occur3. This can be seen in the following animation and figure (same link).
| Web Link |
Hormone release
Calcium acts as an intracellular messenger for the release of hormones, such as insulin. The link below shows how in the beta cells of the pancreas, the opening of voltage-gated calcium channels stimulates the insulin granules to fuse with the beta cell membrane to release insulin.
| Web Link |
Blood Clotting
As will be discussed more in the vitamin K section, calcium binding to activated Gla proteins is important in the blood clotting cascade.

Enzyme regulation
The binding of calcium to calcium-binding proteins also regulates the action of a number of enzymes4.
References & Links
- Byrd-Bredbenner C, Moe G, Beshgetoor D, Berning J. (2009) Wardlaw’s perspectives in nutrition. New York, NY: McGraw-Hill.
- http://en.wikipedia.org/wiki/File:Synapse_Illustration_unlabeled.svg
- http://legacy.owensboro.kctcs.edu/GCaplan/anat/Notes/API%20Notes%20J%20%20Muscle%20Contraction.htm
- Gropper SS, Smith JL, Groff JL. (2008) Advanced nutrition and human metabolism. Belmont, CA: Wadsworth Publishing.
Links
Muscle contraction – http://legacy.owensboro.kctcs.edu/GCaplan/anat/Notes/API%20Notes%20J%20%20Muscle%20Contraction.htm
Insulin release – http://www.dolcera.com/wiki/images/Image11.jpeg
12.24 Calcium Deficiency & Toxicity
Because of the large amount of calcium in bones, deficiency is rare1. Hypocalcemia (low serum calcium levels in blood) can result in tetany (involuntary muscle contractions)2. In addition, calcium deficiency in children can lead to rickets, which is a vitamin D deficiency. While not a deficiency, low calcium intake can lead to decreased bone mineral density and the conditions osteopenia and osteoporosis. How these differ from osteomalacia and normal bone is illustrated and described below. There are two different bone components that we will consider to understand what is happening in the bone. Matrix is the scaffolding onto which mineral is deposited. Mineral is at it sounds, the mineral that is deposited on the matrix.
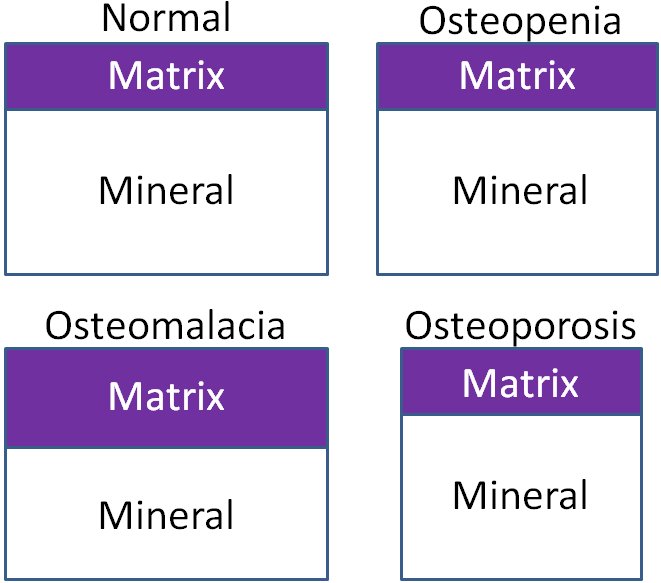
Osteomalacia – Bone mass is normal, but the matrix to mineral ratio is increased, meaning there is less mineral in bone.
Osteopenia – Bone mass is decreased, but the matrix to mineral ratio is not altered from normal bone. This condition is intermediate in between normal and osteoporosis.
Osteoporosis – Bone mass is further decreased from osteopenia, but the matrix to mineral ratio is not altered from normal bone3.
To prevent osteoporosis it is important to build peak bone mass, 90% of which is built in females by age 18 and age 20 in males, but can continue to increase until age 30. After that time, bone mass starts to decrease. For women after menopause, bone mass decreases dramatically because of the decrease in estrogen production, as shown in the link below5.
| Web Link |
Combining the decrease after menopause along with the fact that women have lower bone mass to begin with, helps further explain why osteoporosis is more common in females. A measure of bone status is bone mineral density. As the name indicates, bone mineral density is a measure of the amount of mineral in bone. Dual energy X-ray absorptiometry (DEXA) accurately measures bone mineral density using a small amount of radiation. A DEXA is shown in the figure below.
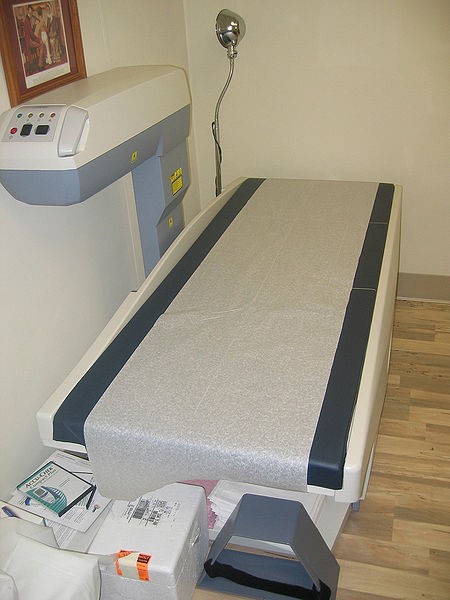
A person lies down on the table and the arm of the machine moves slowly over them.
From the scan, a bone mineral density t-score is generated. As shown below, normal bone mineral density has a t-score of greater than -1, low bone mass is from -1 to -2.5, and osteoporosis is a t-score of less that -2.5 as illustrated in the figure in the link below.
| Web Link |
There are other methods of measuring bone mineral density, such as peripheral DEXA and ultrasound. These typically are done on the wrist or heel, but are not as accurate because that one area might not reflect the bone mineral density in other parts of the body7.
Calcium toxicity is rare, occurring in those with hyperparathyroidism or high calcium supplementation levels. Like vitamin D, toxicity can lead to calcification of soft tissues7. In addition, a very high intake of calcium can lead to kidney stone formation.
References & Links
- Shils ME, Shike M, Ross AC, Caballero B, Cousins RJ, editors. (2006) Modern nutrition in health and disease. Baltimore, MD: Lippincott Williams & Wilkins.
- Gropper SS, Smith JL, Groff JL. (2008) Advanced nutrition and human metabolism. Belmont, CA: Wadsworth Publishing.
- Sambrook, P. Bone structure and function in normal and disease states http://v5.books.elsevier.com/bookscat/samples/9780443070150/9780443070150.pdf
- http://nof.org/articles/7
- http://www.niams.nih.gov/Health_Info/Bone/Osteoporosis/bone_mass.asp
- http://en.wikipedia.org/wiki/File:Bone_density_scanner.jpg
- Byrd-Bredbenner C, Moe G, Beshgetoor D, Berning J. (2009) Wardlaw’s perspectives in nutrition. New York, NY: McGraw-Hill.
Link
Bone Mass – http://drugline.org/img/term/bone-mass-density-2046_2.gif
Bone Mineral Density T-Scores – http://www.orthopaedicsurgeon.com.sg/wp-content/uploads/2011/11/t-scores-large.gif
12.3 Phosphorus
We have already talked about how blood phosphate levels are regulated in the body by PTH, calcitonin, and 1,25(OH)2D. Animal products are rich sources of phosphate. Plant products contain phosphorus, but some is in the form of phytic acid (phytate). In grains, over 80% of the phosphorus is phytate. This structure is shown below1.

The bioavailability of phosphorus from phytate is poor (~50%) because we lack the enzyme phytase3. Nevertheless, ~50-70% of phosphorus is estimated to be absorbed from our diet1. Another source of phosphorus is phosphoric acid that is used to acidify colas. Colas are caramel-colored, carbonated soft drinks that contain caffeine, such as Coca-Cola, Pepsi, etc. Epidemiological studies have found that soft drink consumption is associated with decreased bone mineral densities, particularly in females4,5. It has been hypothesized that phosphoric acid plays some role in this effect, but there is limited evidence to support this belief.
Most phosphorus is excreted in the urine.
Phosphorus deficiency is rare, but can hinder bone and teeth development. Other symptoms include muscle weakness, rickets, and bone pain6. Toxicity is also rare, but it causes low blood calcium concentrations and tetany1.
Subsection:
12.31 Phosphorus Functions
References & Links
- Gropper SS, Smith JL, Groff JL. (2008) Advanced nutrition and human metabolism. Belmont, CA: Wadsworth Publishing.
- http://en.wikipedia.org/wiki/File:Phytic_acid.png
- Phosphorus. Linus Pauling Institute Micronutrient Information Center. http://lpi.oregonstate.edu/mic/minerals/phosphorus#reference10
- Tucker K, Morita K, Qiao N, Hannan M, Cupples LA, et al. (2006) Colas, but not other carbonated beverages, are associated with low bone mineral density in older women: The framingham osteoporosis study. Am J Clin Nutr 84(4): 936-942.
- Libuda L, Alexy U, Remer T, Stehle P, Schoenau E, et al. (2008) Association between long-term consumption of soft drinks and variables of bone modeling and remodeling in a sample of healthy german children and adolescents. Am J Clin Nutr 88(6): 1670-1677.
- Byrd-Bredbenner C, Moe G, Beshgetoor D, Berning J. (2009) Wardlaw’s perspectives in nutrition. New York, NY: McGraw-Hill.
12.31 Phosphorus Functions
Phosphorus has a number of functions in the body1.
Phosphate is a component of hydroxyapatite in bones and teeth, as described earlier.
Non-bone functions include:
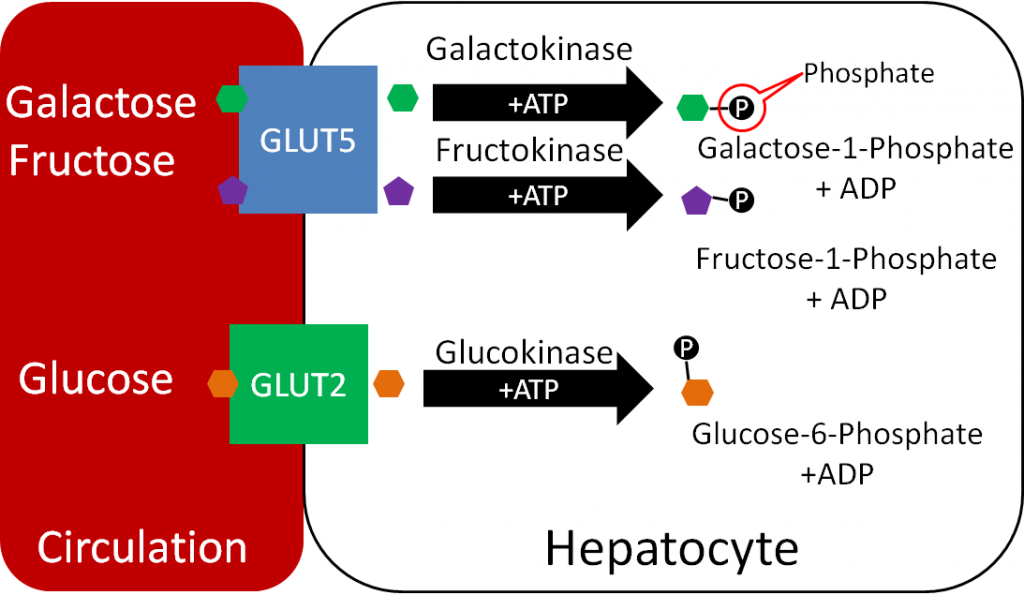
Phosphorylation
Phosphates are used to activate and deactivate a number of proteins. In addition, compounds are also frequently phosphorylated, like the monosaccharides shown below.
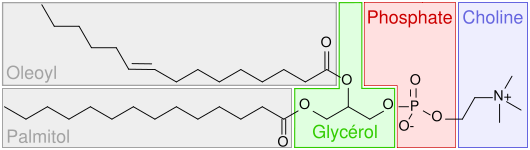
Phospholipids
Phosphates are a component of phospholipids, as shown below.
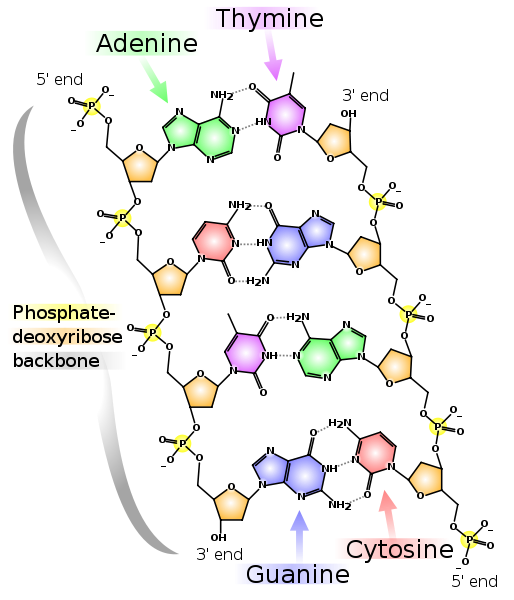
DNA/RNA
DNA/RNA have a phosphate backbone as shown below.
ATP
The major energy currency, ATP, stores energy in its phosphate bonds.

Secondary Messengers
The intracellular secondary messengers cyclic AMP (cAMP) and inositol triphosphate (IP3) both contain phosphate. The action of these secondary messengers can be seen in the links below.
| Web Links
cAMP (inactive link as of 05/18/2021) IP3 (inactive link as of 05/18/2021) |
Other functions of phosphate include:
Acid/Base Balance
Intracellular Anion
References & Links
- Gropper SS, Smith JL, Groff JL. (2008) Advanced nutrition and human metabolism. Belmont, CA: Wadsworth Publishing.
- http://commons.wikimedia.org/wiki/File:Popc_details.svg
- http://en.wikipedia.org/wiki/File:DNA_chemical_structure.svg
- http://en.wikipedia.org/wiki/File:ATP_structure.svg
Links
cAMP – http://courses.washington.edu/conj/gprotein/cyclicamp.htm (inactive link as of 05/18/2021)
IP3 – http://courses.washington.edu/conj/gprotein/ip3.htm (inactive link as of 05/18/2021)
12.4 Fluoride
Fluoride is a nonessential mineral. It is not required by the body and it is not widely found in the food supply. The majority of what we consume comes from fluoridated water. Other good non-dietary sources are fluoridated toothpaste and dental rinses1. Absorption of fluoride is near 100% for both dietary and non-dietary forms and it is rapidly excreted in the urine2.
Fluoride alters the mineralization of bones and teeth. It does this by replacing hydroxyl (OH) ions in hydroxyapatite (Ca10(PO4)6(OH)2) , forming fluorohydroxyapatite. Fluorohydroxyapatite is more resistant to acid degradation than hydroxyapatite, leading to fewer cavities2.
Since it is a nonessential mineral, there is no fluoride deficiency. However, fluoride can be quite toxic. Acute toxicity symptoms from large intakes of fluoride include1:
Nausea
Vomiting
Diarrhea
Convulsions
Chronic toxicity results in an irreversible condition known as fluorosis, characterized by the mottling and pitting of teeth as shown below.
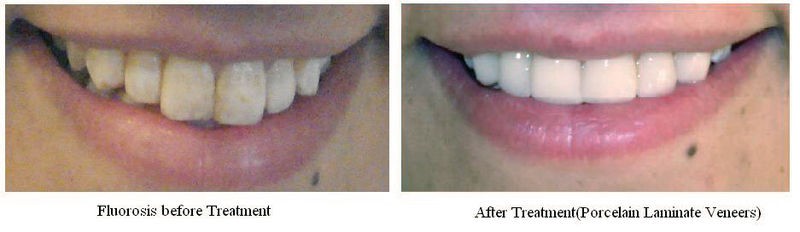
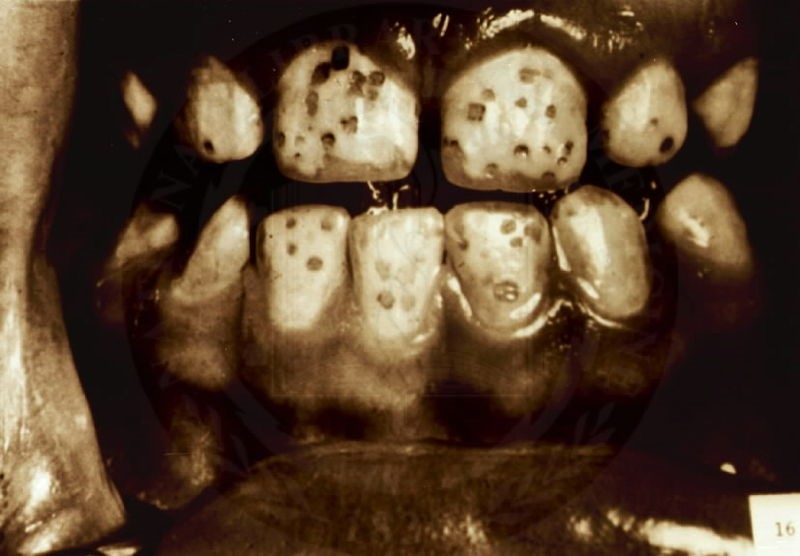
As you can see from the figure below, fluorosis is more prevalent in the United States than most people would probably believe.
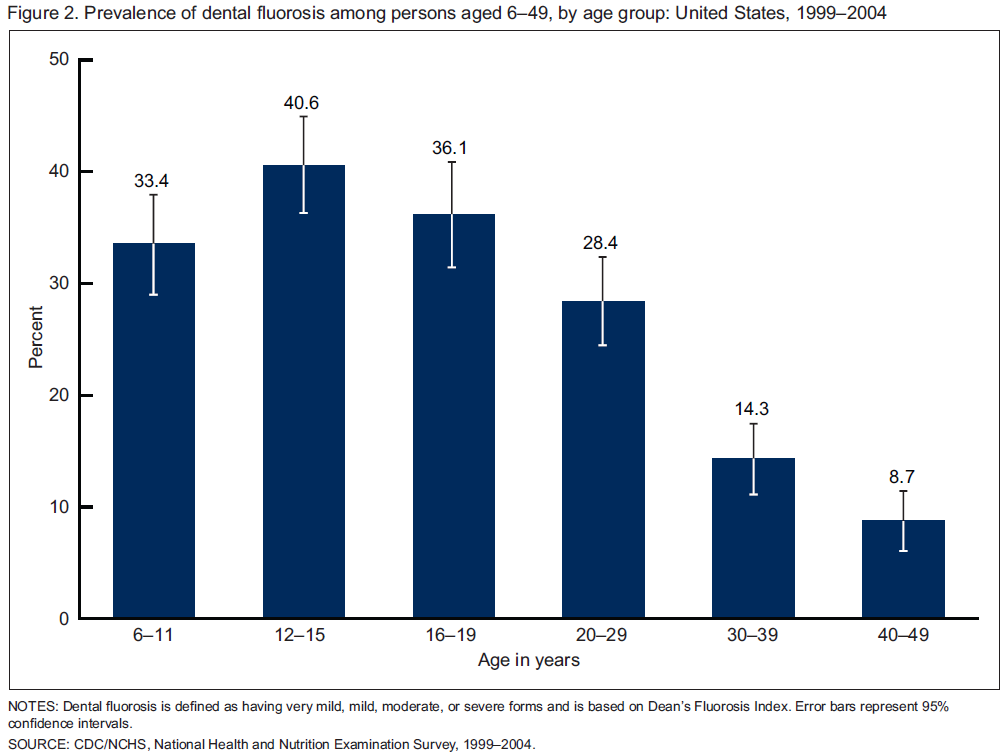
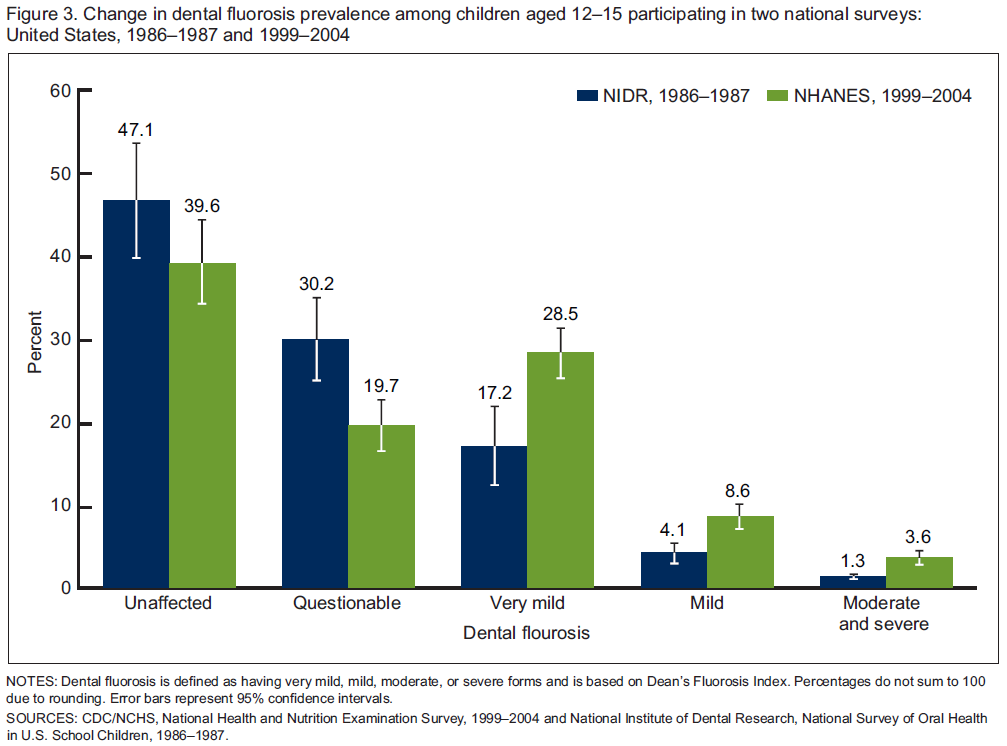
A comparison of the prevalence of fluorosis in US children, ages 12-15, indicates an increase from the late 1980s to the early 2000s5.
There is debate as to whether water should be fluoridated. The following links are examples of just how conflicted the U.S. is. The first is a New York Times article on this topic. There is also an article about Portland’s decision to begin fluoridating its water in 2014. The third article is about a bill introduced by a Kansas lawmaker concerned about the effects of water fluoridation. Salina, Kansas, which is home to one of Kansas State University’s campuses, voted last November to not rescind its policy of fluoridating its water, as described in the fourth link.
| Web Links |
References & Links
- Byrd-Bredbenner C, Moe G, Beshgetoor D, Berning J. (2009) Wardlaw’s perspectives in nutrition. New York, NY: McGraw-Hill.
- Gropper SS, Smith JL, Groff JL. (2008) Advanced nutrition and human metabolism. Belmont, CA: Wadsworth Publishing.
- http://en.wikipedia.org/wiki/File:Fluorosisb%26a.jpg
- https://en.wikipedia.org/wiki/Dental_fluorosis#/media/File:FluorosisFromNIH.jpg
- Beltran-Aguilar, ED, Barker, L, Dye, BA. (2010) Prevalence and Severity of Dental Fluorosis in the United States, 1999-2004. http://www.cdc.gov/nchs/data/databriefs/db53.htm
Links
Fluoridation Debate, Redux – http://www.nytimes.com/2012/03/18/opinion/sunday/fluoridation-debate-redux.html?
Portland Approves Fluoridation by ‘14 – http://www.nytimes.com/2012/09/13/us/portland-approves-adding-fluoride-to-water-by-14.html?
Fluoride to Stay in Salina Water – http://www.salina.com/1d3c8158-0a31-5c90-b5b4-98afdda9ce92.html
12.5 Vitamin K
There are 3 forms of vitamin K. Phylloquinone (K1), the plant form of vitamin K, is the primary dietary form of vitamin K. Its structure is shown below.

Green leafy vegetables, broccoli, Brussels sprouts, and asparagus are foods that are good sources of phylloquinone2.
Another form of vitamin K, menaquinone (K2), is synthesized by bacteria in the colon. Menaquinone comprises ~10% of absorbed vitamin K every day and can also be found in small amounts in animal products. Its structure is shown below3.

In the structure above, if it was menaquinone-8, there would be 7 (8-1) repeating units of the structure inside the brackets above.
The synthetic form of vitamin K is menadione (K3), whose structure is shown below.
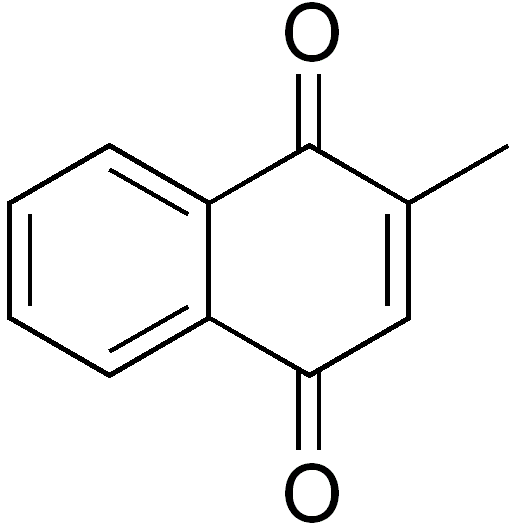
A tail, similar to the one found in menaquinone, has to be added to menadione for it to be biologically active.
Vitamin K is absorbed like other fat-soluble substances. Approximately 80% of phylloquinone and menaquinone are incorporated into chylomicrons and stored primarily in the liver2,6. Once metabolized, vitamin K is primarily excreted via bile in the feces, with a lesser amount excreted in urine6.
Subsections:
12.51 Vitamin K Functions
12.52 Vitamin K Deficiency & Toxicity
References & Links
- http://en.wikipedia.org/wiki/File:Phylloquinone_structure.svg
- McGuire M, Beerman KA. (2011) Nutritional sciences: From fundamentals to food. Belmont, CA: Wadsworth Cengage Learning.
- Byrd-Bredbenner C, Moe G, Beshgetoor D, Berning J. (2009) Wardlaw’s perspectives in nutrition. New York, NY: McGraw-Hill.
- http://en.wikipedia.org/wiki/File:Menaquinone.svg
- http://en.wikipedia.org/wiki/File:Menadione.png
- Gropper SS, Smith JL, Groff JL. (2008) Advanced nutrition and human metabolism. Belmont, CA: Wadsworth Publishing.
12.51 Vitamin K Functions
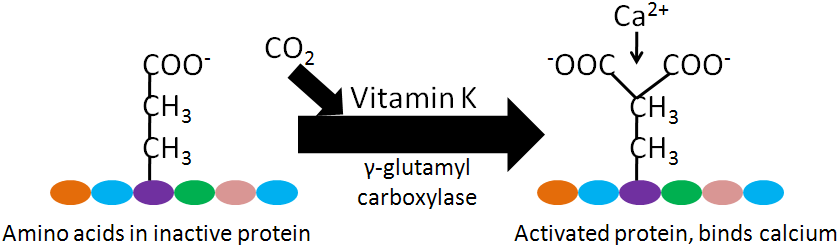
Vitamin K is a cofactor for carboxylation reactions that add a CO2 to the amino acid, glutamic acid (glutamate), in certain proteins. The structure of glutamic acid is shown below.

The enzyme, gamma-glutamyl carboxylase, uses a vitamin K cofactor to convert glutamic acid to gamma-carboxyglutamic acid (Gla). Gla proteins are those that contain glutamic acid(s) that have been converted to gamma-carboxyglutamic acid(s). The formation of Gla proteins allows the 2 positive charges of calcium to bind between the 2 negative charges on the carboxylic acid groups (COO-) in the Gla. The binding of calcium activates these proteins2-4.
Gla proteins are important in blood clotting. Blood clotting occurs through a cascade of events, as shown in the following 2 videos. The animation below gives an overview of blood clotting, the video is a fun depiction of the blood clotting cascade.
| Web Links |
Within the blood clotting cascade, there a number of potential Gla proteins, as shown in the figure below.
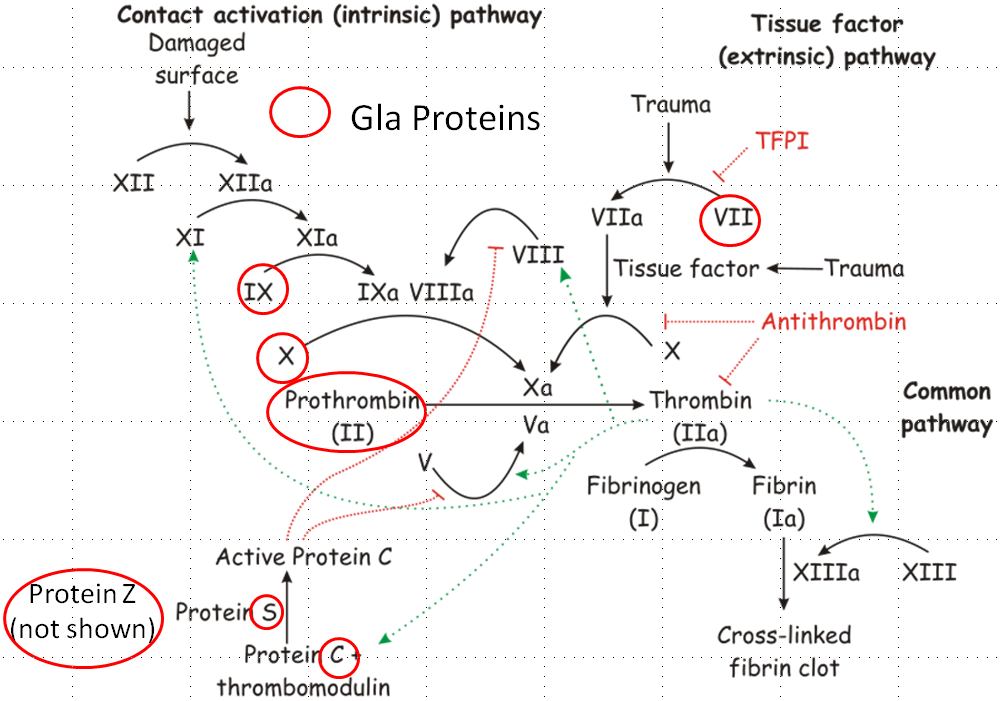
If these proteins within the blood clotting cascade are not activated to Gla, the cascade does not proceed as normal, leading to impaired blood clotting. After being used as a cofactor by gamma-glutamyl carboxylase to produce a Gla protein, vitamin K becomes vitamin K epoxide. Vitamin K epoxide needs to be converted back to vitamin K to serve as a cofactor again. Warfarin (Coumadin) and dicumarol are a couple of blood thinning drugs that inhibit this regeneration of vitamin K. This reduces the amount of Gla in the blood clotting proteins ,thus reducing the clotting response. The structure of warfarin and dicumarol are shown below5.


The following coumadin rap song video gives further information on warfarin.
| Web Link |
Vitamin K may also be important for bone health. There are 3 Gla proteins found in bone: osteocalcin, matrix Gla protein (MGP), and protein S6. Osteocalcin is a major bone protein, constituting 15-20% of all non-collagen proteins in bone. However, overall, the function of these 3 proteins in bone is not known2,3. Some research suggests that higher vitamin K status or intake decreases bone loss, but it is still not clear whether vitamin K truly is important for bone health9.
References & Links
- https://en.wikipedia.org/wiki/Glutamic_acid#/media/File:Glutamic_Non-ionic.png
- Gropper SS, Smith JL, Groff JL. (2008) Advanced nutrition and human metabolism. Belmont, CA: Wadsworth Publishing.
- Byrd-Bredbenner C, Moe G, Beshgetoor D, Berning J. (2009) Wardlaw’s perspectives in nutrition. New York, NY: McGraw-Hill.
- McGuire M, Beerman KA. (2011) Nutritional sciences: From fundamentals to food. Belmont, CA: Wadsworth Cengage Learning.
- http://en.wikipedia.org/wiki/File:Coagulation_full.svg
- Shils ME, Shike M, Ross AC, Caballero B, Cousins RJ, editors. (2006) Modern nutrition in health and disease. Baltimore, MD: Lippincott Williams & Wilkins.
- http://en.wikipedia.org/wiki/File:Warfarin.svg
- http://en.wikipedia.org/wiki/File:Dicumarol.svg
- Shea MK, Booth S. (2008) Update on the role of vitamin K in skeletal health. Nutr Rev 66(10): 549-557.
Videos
Hemostasis Animation- http://www.mhhe.com/biosci/esp/2002_general/Esp/folder_structure/tr/m1/s7/trm1s7_3.htm
The Clotting Cascade – https://www.youtube.com/watch?v=NJm4DE-tVuY&feature=related
Coumadin Rap Song – http://www.youtube.com/watch?v=Mfk05IFfW48&feature=watch_response
12.52 Vitamin K Deficiency & Toxicity
Vitamin K deficiency is rare, but can occur in newborn infants. They are at higher risk, because there is poor transfer of vitamin K across the placental barrier, their gastrointestinal tracts do not contain vitamin K producing bacteria, and breast milk is generally low in vitamin K1. As a result, it is recommended (and widely practiced) that all infants receive a vitamin K injection within 6 hours of birth2.
Prolonged antibiotic treatment (which kills bacteria in the gastrointestinal tract) and lipid absorption problems can also lead to vitamin K deficiency3. Vitamin K deficient individuals have an increased risk of bleeding or hemorrhage. Remember that high levels of alpha-tocopherol intake can also interfere with vitamin K’s blood clotting function. It is believed that an alpha-tocopherol metabolite, with similar structure to the vitamin K quinones, antagonizes the action of vitamin K.
Phylloquinone and menaquinone have no reported toxicities. However, menadione can cause liver damage1.
References & Links
- Gropper SS, Smith JL, Groff JL. (2008) Advanced nutrition and human metabolism. Belmont, CA: Wadsworth Publishing.
- Byrd-Bredbenner C, Moe G, Beshgetoor D, Berning J. (2009) Wardlaw’s perspectives in nutrition. New York, NY: McGraw-Hill.
- McGuire M, Beerman KA. (2011) Nutritional sciences: From fundamentals to food. Belmont, CA: Wadsworth Cengage Learning.
12.6 Vitamin A
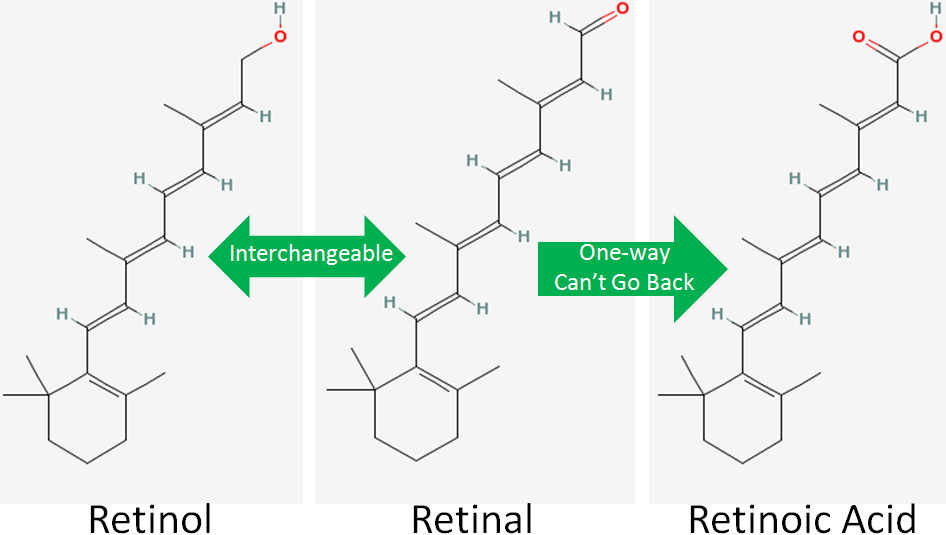
There are 3 forms of vitamin A (retinol, retinal, and retinoic acid) that collectively are known as retinoids. Retinol is the alcohol (OH) form, retinal is the aldehyde (COH) form, and retinoic acid is the carboxylic acid (COOH) form, as shown in the figure below (areas of difference are indicated by red).
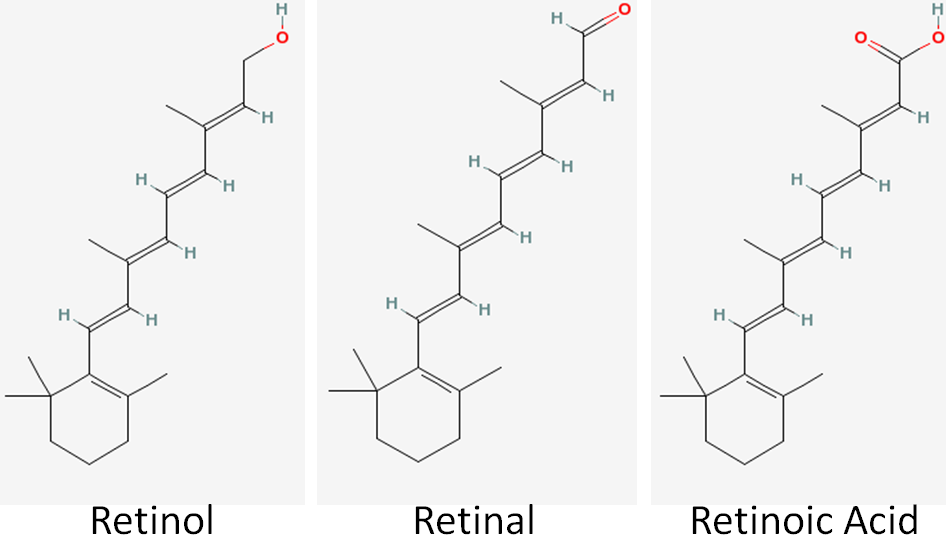
Among these different retinoids, retinol and retinal are fairly interchangeable. Either form is readily converted to the other. However, only retinal is used to form retinoic acid, and this is a one-way reaction. Thus, once retinoic acid is formed it can’t be converted back to retinal, as shown in the figure below.
There are 2 primary dietary sources of vitamin A:
Retinyl/retinol esters (Animal Products)
Provitamin A Carotenoids (Plants)
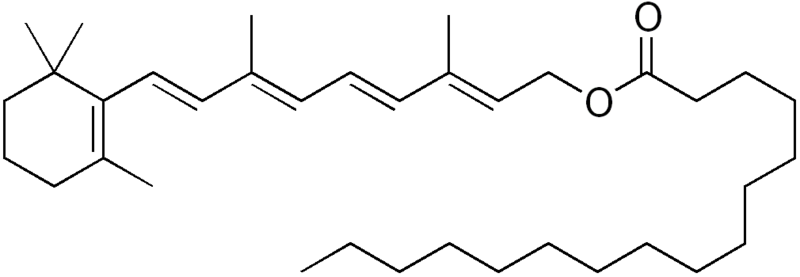
Preformed vitamin A means that the compound is a retinoid. Preformed vitamin A is only found in animal products (carrots are not a good source of preformed vitamin A). Most retinol in animal products is esterified, or has a fatty acid added it, to form retinyl esters (aka retinol esters). The most common retinyl ester is retinyl palmitate (retinol + the fatty acid palmitate) whose structure is shown below.
Provitamin A is a compound that can be converted to vitamin A in the body, but currently isn’t in vitamin A form. The next section will talk about carotenoids, some of which are provitamin A compounds.
International units are also used for vitamin A, such that:
1 IU = 0.3 ug retinol or 0.6 ug beta-carotene
Subsections:
12.61 Carotenoids
12.62 Vitamin A Uptake, Absorption, Transport & Storage
12.63 Vitamin A Nuclear Receptors
12.64 Vitamin A Functions
12.65 Vitamin A Deficiency & Toxicity
References & Links
- Structures from Pubchem http://pubchem.ncbi.nlm.nih.gov/
- http://en.wikipedia.org/wiki/File:Retinyl_palmitate.png
12.61 Carotenoids
Carotenoids are 40-carbon compounds that are found throughout nature. Animals do not produce carotenoids, thus any found in animals came from consumed plants or microorganisms. There are more than 600 natural carotenoids. However, the 6 main ones found in the diet and in the body are1:
Beta-carotene
Alpha-carotene
Beta-cryptoxanthin
Lutein
Zeaxanthin
Lycopene
Many carotenoids are pigments, meaning they are colored. The table below gives the color of some of these carotenoids, as well as some food sources.
Table 12.611 Carotenoids’ color and food sources
| Carotenoid | Color | Food Sources |
| Beta-carotene | Orange | Carrots, Sweet Potatoes, Leafy Greens |
| Lycopene | Red | Tomatoes, Watermelon, Pink Grapefruit |
| Lutein/Zeaxanthin | Yellow | Kale, Corn, Egg Yolks, Spinach |
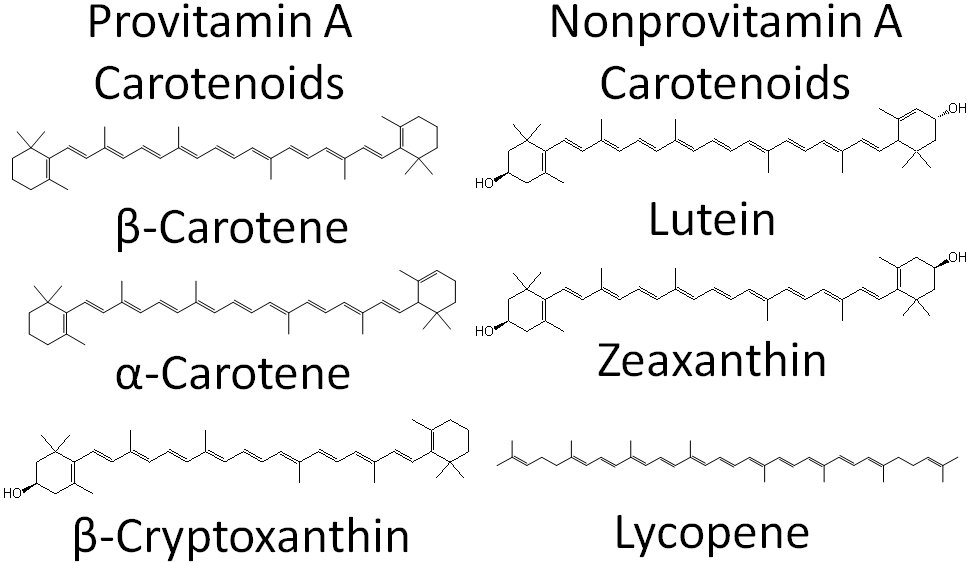
Carotenoids can be further classified as provitamin A or non-provitamin A. Provitamin A carotenoids are those that can be cleaved to form retinal, while the non-provitamin A carotenoids cannot. The structure and classification of the 6 major carotenoids are shown below.
After provitamin A carotenoids are taken up into the enterocyte, some are cleaved to form retinal. In the case of symmetrical beta-carotene, it is cleaved in the center to form 2 retinal molecules as shown below.
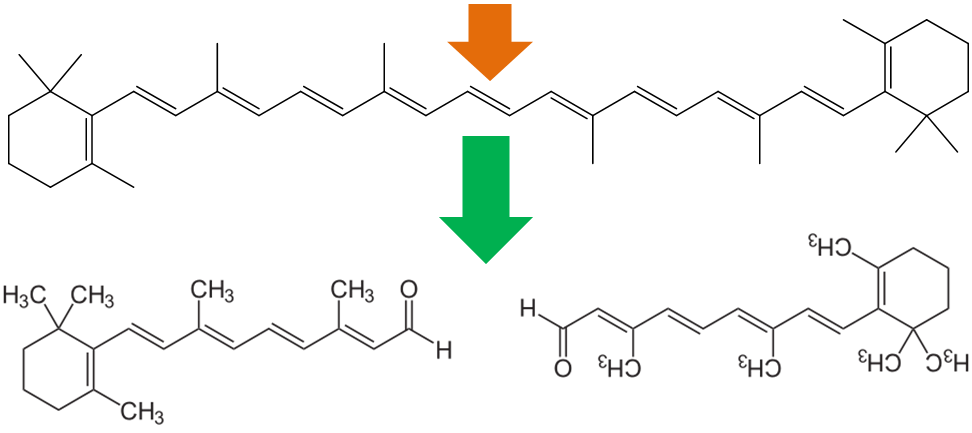
Alpha-carotene and beta-cryptoxanthin are asymmetrical, thus they can be used to form only 1 retinal.
To help account for the fact that retinol can be made from carotenoids, the DRI committee made retinol activity equivalents (RAE) that take into account the bioavailability and bioconversion of the provitamin A carotenoids.
1 ug RAE
= 1 ug of retinol
= 2 ug of supplemental beta-carotene
= 12 ug of dietary beta-carotene
= 24 ug of alpha-carotene or beta-cryptoxanthin3
References & Links
- Lindshield BL, Erdman JW. (2006) Carotenoids. In: Bowman BA, Russell RM, editors. Present Knowledge in Nutrition. Washington, D.C.: International Life Sciences Institute. pp. 184-197.r
- https://en.wikipedia.org/wiki/Retinal#/media/File:All-trans-Retinal2.svg
- Anonymous. (2001) Dietary reference intakes for vitamin A, vitamin K, arsenic, boron, chromium, copper, iodine, iron, manganese, molybdenum, nickel, silicon, vanadium, and zinc. Washington, D.C.: National Academies Press.
12.62 Vitamin A Uptake, Absorption, Transport & Storage
The uptake, absorption, transport, and storage of vitamin A and carotenoids are summarized in the figure below.
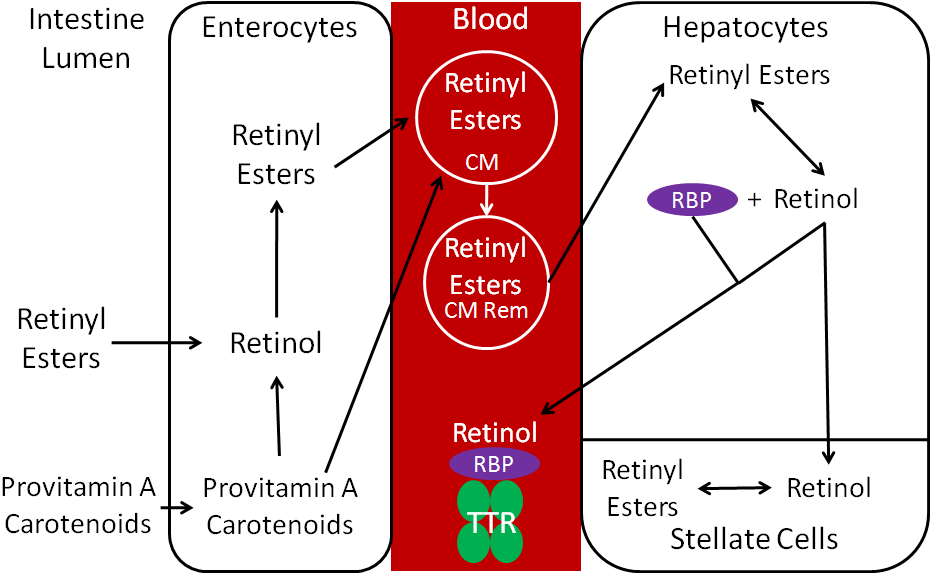
Esters are removed by esterases so that free retinol can be taken up into the enterocyte. Preformed vitamin A is highly bioavailable (70-90%) if consumed with some fat2. Carotenoids have a much lower bioavailability, which varies based on the carotenoid and matrix it is in when consumed. Once provitamin A carotenoids are taken up into the enterocytes, they are: (1) cleaved to retinal and then converted to retinol or (2) absorbed intact and incorporated into chylomicrons.
Retinol in the enterocyte is esterified, forming retinyl esters. The retinyl esters are packaged into chylomicrons (CM) and enter the lymph system. Once the chylomicrons reach circulation, triglycerides are cleaved off to form chylomicron remnants (CM Rem). These are taken up by hepatocytes, where the retinyl esters are de-esterified to form retinol. The liver is the major storage site of vitamin A. For storage, the retinol will be transported from the hepatocytes to the stellate cells and converted back to retinyl esters, the storage form of vitamin A.
If vitamin A is needed to be released into circulation, retinol will combine with retinol binding protein (RBP). Retinol + RBP are then bound to a large transport protein, transthyretin (TTR). It is believed that retinol + RBP would be filtered out by the kidney and excreted in urine if it was not bound to TTR1.
After it is further metabolized, 60% of vitamin A is excreted in the urine, 40% in feces2.
References & Links
- Stipanuk MH. (2006) Biochemical, physiological, & molecular aspects of human nutrition. St. Louis, MO: Saunders Elsevier.Stipaunuk
- Gropper SS, Smith JL, Groff JL. (2008) Advanced nutrition and human metabolism. Belmont, CA: Wadsworth Publishing.
12.63 Vitamin A Nuclear Receptors
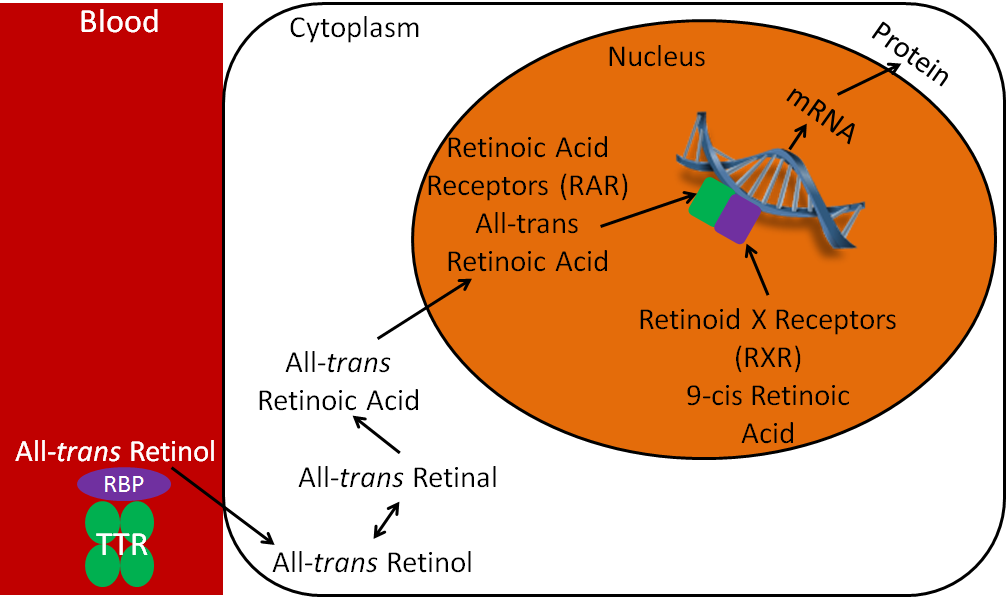
Vitamin A, like vitamin D, has a nuclear receptor. Vitamin A technically has two nuclear receptors, the retinoic acid receptors (RARs) and retinoid X receptors (RXRs). Vitamin A, like polyunsaturated fatty acids, can be found in trans and cis forms, depending on the conformation of its double bonds. The ligand for RARs is all-trans-retinoic acid, and the ligand for RXRs is 9-cis retinoic acid.
As shown in the figure below, all-trans retinol is brought to the cell by RBP and TTR. All-trans retinol is converted to all-trans-retinal, and then to all-trans-retinoic acid. RAR and RXR are paired, or dimerized, on the retinoic acid response element (RARE) in the promoter region of target genes. The binding of all-trans retinoic acid causes the transcription and ultimately the translation of target proteins. This is why all-trans-retinoic acid is the active form of vitamin A because it is the ligand for RARs, leading to many of the biologic effects attributed to vitamin A.
No References
12.64 Vitamin A Functions
Vitamin A has a number of important functions in the body.
Vision
The retina is the inner back lining of the eye that takes visual images and turns them into nerve signals that are sent to the brain to form the images that we “see”, as shown in the following link1.
| Web Link |
Inside the retina are the photoreceptor cells, rods and cones. Cones are responsible for color vision, while rods are important for seeing black and white. Within the rods, 11-cis retinal combines with the protein, opsin, to form rhodopsin. When light strikes rhodopsin, the compound splits into opsin and all-trans retinal. This sends a signal to your brain for us to “see”. This process is illustrated in the figure below1.
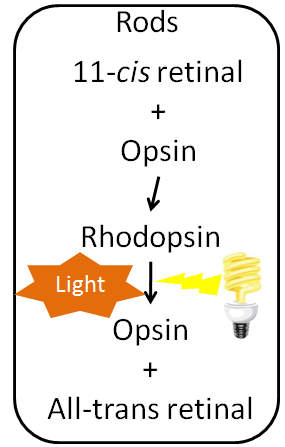
Most all-trans retinal is converted back to 11-cis retinal through a series of steps so it can continue to be used to form rhodopsin. However, this recycling is not 100% efficient. Vitamin A stores, or continued intake, is required to provide the 11-cis retinal needed to continue to form rhodopsin. Normally, our eyes adapt to darkness by increasing the amount of rhodopsin available so we can see under reduced light conditions1. If a person does not have enough rhodopsin he/she will become night blind, meaning his/her eyes do not adjust, or adjust very slowly, preventing he/she from seeing under limited light conditions. The picture below is an example of what night blindness looks like.

Cell Differentiation
Vitamin A, in particular retinoic acid, is important for cell differentiation, or the ability of stem cells to develop into specialized cells.
Other functions that vitamin A is important for include:
Growth and development
Reproduction
Immune function
References & Links
- Byrd-Bredbenner C, Moe G, Beshgetoor D, Berning J. (2009) Wardlaw’s perspectives in nutrition. New York, NY: McGraw-Hill.
- https://commons.wikimedia.org/wiki/File:P360_Onderdendam_goed_nachtzicht_ns_nachtblind.jpg
- http://www.wikipremed.com/image.php?img=040601_68zzzz334000_Cell_differentiation_68.jpg&image_id=334000
Links
Retina – http://webvision.umh.es/webvision/imageswv/Sagschem.jpeg
12.65 Vitamin A Deficiency & Toxicity
Vitamin A deficiency is rare in North America, but is a huge problem in developing countries. In many developing countries, they do not have a stable dietary source of retinoids or provitamin A carotenoids. The figure below gives you an idea of countries where vitamin A deficiency is a problem.

Often the earliest symptom of vitamin A deficiency is night blindness, due to the insufficient production of rhodopsin. The reason that this is the earliest symptom, is that circulating vitamin A levels are homeostatically-controlled, meaning that they do not change until after vitamin A stores are exhausted. This means that blood, serum, plasma measurements are going to appear normal until all stores are exhausted. As a result, sensitively assessing someone as vitamin A deficient can be challenging. There are further changes to the eye that occur during vitamin A deficiency, collectively referred to as xerophthalmia, which are shown in the link below.
| Web Link |
Ultimately the person can become blind. Vitamin A deficiency is the leading cause of blindness in some parts of the world2.
Another symptom of vitamin A deficiency is hyperkeratosis. In this condition, cells overproduce the protein keratin, causing the skin to become rough and irritated, as shown in the link below2.
| Web Link
Hyperkeratosis (inactive link as of 05/18/2021) |
One way to counter vitamin A deficiency in developing countries is for staple crops, like rice and corn, to contain beta-carotene. In the case of rice, Golden Rice was genetically modified to produce beta-carotene. A second generation of golden rice, known as Golden Rice 2, has now been developed. However, politics and regulations have prevented it from being used. This is described in the first link. The second link is a nice figure that details the progress towards Golden Rice being used. The third link describes the issues with how some research with it was conducted. The fourth link is an opinion article that gives you a feel for the opposition to its use.
| Web Links
Golden Rice |
There are also corn varieties that have been bred to produce high amounts of beta-carotene, as described in the link below.
| Web Link |
Vitamin A can be very toxic and can cause serious symptoms, such as blurred vision, liver abnormalities, skin disorders, and joint pain2,3. In addition, research has suggested that people who consume high levels of vitamin A are more prone to bone fractures2. Toxic levels of vitamin A are also teratogenic, which means they could cause birth defects.
This is important to keep in mind because a vitamin A derivative isotretinoin (13-cis retinoic acid) is the active ingredient in the oral acne medication, Accutane. Accutane is effective, as you can see in the video below.
| Web Link |
However, due to the number of adverse events reported from its consumption, Accutane was recalled from the US market in 20094. Isotretinoin medications though are still commonly prescribed.
Retin-A is a topical product of all-trans-retinoic acid. Women of childbearing age need to exercise caution when using these products due to the risk of birth defects, should they become pregnant3. People should not consume huge doses of vitamin A expecting to get the same effects seen from these 2 medications5.
It is important to note that you cannot develop vitamin A toxicity from consuming too much beta-carotene or other provitamin A carotenoids. Instead, a nontoxic condition known as carotenodermia occurs when large amounts of beta-carotene are consumed, where the accumulation of the carotenoid in the fat below the skin causes the skin to look orange, as shown in the link below.
| Web Link |
References & Links
- http://en.wikipedia.org/wiki/File:Vitamin_A_deficiency.PNG
- McGuire M, Beerman KA. (2011) Nutritional sciences: From fundamentals to food. Belmont, CA: Wadsworth Cengage Learning.
- Byrd-Bredbenner C, Moe G, Beshgetoor D, Berning J. (2009) Wardlaw’s perspectives in nutrition. New York, NY: McGraw-Hill.
- http://www.drugwatch.com/accutane/
- Whitney E, Rolfes SR. (2011) Understanding nutrition. Belmont, CA: Wadsworth Cengage Learning.
Links
The eye signs of vitamin A deficiency – http://www.cehjournal.org/article/the-eye-signs-of-vitamin-a-deficiency/
Hyperkeratosis – http://api.ning.com/files/pKcbIy8a8fSwvjlw-NqcoyW-h1U9xsjxM86*Pg7xe7WAS91frtrQFThTH2oDWcMvbUJ9Mlutd3B9tXk8hjbfmXkeZyJs-7Mi/follicularhyperkeratosis1.jpg
Golden Rice – http://www.goldenrice.org/
‘Golden Rice’: A Dengvaxia fiasco waiting to happen- http://opinion.inquirer.net/109834/golden-rice-dengvaxia-fiasco-waiting-happen#ixzz53FKBsYGO
Golden Rice Project – http://blog.daimonie.com/2017/03/lets-talk-about-gmos-part-two-what-are.html
New Yellow Corn Could Boost Vitamin A, Save Sight – http://www.npr.org/templates/story/story.php?storyId=18203237
Carotenodermia – http://4.bp.blogspot.com/__7hHVSyD26Y/R8xxsFbRc0I/AAAAAAAAAEs/I73lzYHNE5k/s1600-h/carotenodermia.jpg
Video
Accutane – https://www.youtube.com/watch?v=r93K-w2saPA
12.7 Iron
There are 2 major dietary forms of iron: heme iron and non-heme iron. Heme iron is only found in foods of animal origin, within hemoglobin and myoglobin. The structure of heme iron is shown below.
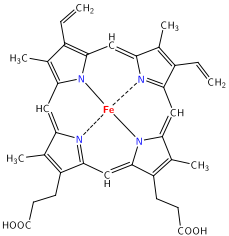
Approximately 40% of iron in meat, fish, and poultry is heme-iron, and the other 60% is non-heme iron2.
Non-heme iron is the mineral alone, in either its oxidized or reduced form. The 2 forms of iron are:
Ferric (Fe3+, oxidized)
Ferrous (Fe2+, reduced)
It is estimated that 25% of heme iron and 17% of non-heme iron are absorbed2. Approximately 85-90% of the iron we consume is non-heme iron2,3.
In addition to getting iron from food sources, if food is cooked in cast iron cookware, a small amount of iron can be transferred to the food.
Many breakfast cereals are fortified with reduced iron, which looks like iron filings, as the following video shows.
| Web Link |
While the iron bioavailability of this reduced iron is low, some is absorbed4.
Supplements
Most iron supplements use ferrous (Fe2+) iron, because this form is better absorbed, as discussed in the next section. The figure below shows the percent of elemental iron in different supplements. This is the percentage of elemental iron that is in each compound.
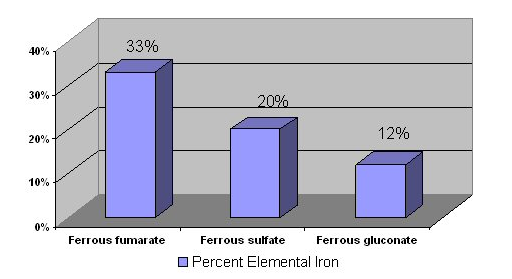
Vitamin C does not increase absorption of ferrous supplements because they are already in reduced form, as discussed in the following subsection2. Iron chelates are marketed as being better absorbed than other forms of iron supplements, but this has not been proven5. It is recommended that supplements are not taken with meals, because they are better absorbed when not consumed with food2.
Subsections:
12.71 Iron Uptake & Absorption
12.72 Iron Transport & Storage
12.73 Iron Functions
12.74 Iron Deficiency & Toxicity
References & Links
- http://en.wikipedia.org/wiki/File:Heme.svg
- Whitney E, Rolfes SR. (2011) Understanding nutrition. Belmont, CA: Wadsworth Cengage Learning.
- http://foodfix.ca/health.php#en65
- Garcia-Casal M, Layrisse M, Pena-Rosas J, Ramirez J, Leets I, et al. (2003) Iron absorption from elemental iron-fortified corn flakes in humans. role of vitamins A and C1-3. Nutr Res 23(4): 451-463.
- Gropper SS, Smith JL, Groff JL. (2008) Advanced nutrition and human metabolism. Belmont, CA: Wadsworth Publishing.
Video
Iron for breakfast – https://www.youtube.com/watch?v=pRK15XSqtAw
12.71 Iron Uptake & Absorption
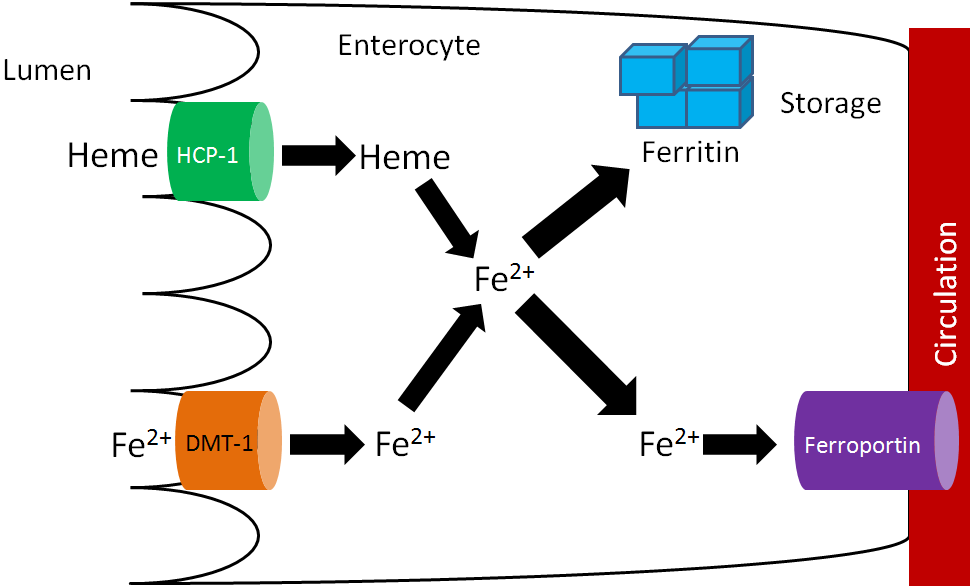
There are 2 transporters for iron, one for heme iron and one for non-heme iron. The non-heme transporter is the divalent mineral transporter 1 (DMT1), which transports Fe2+ into the enterocyte. Heme iron is taken up through heme carrier protein 1 (HCP-1), and then metabolized to Fe2+. Fe2+ may be used by enzymes and other proteins or stored in the enterocyte bound to ferritin, the iron storage protein. To reach circulation, iron is transported through ferroportin1,2. This process is summarized in the figure below.
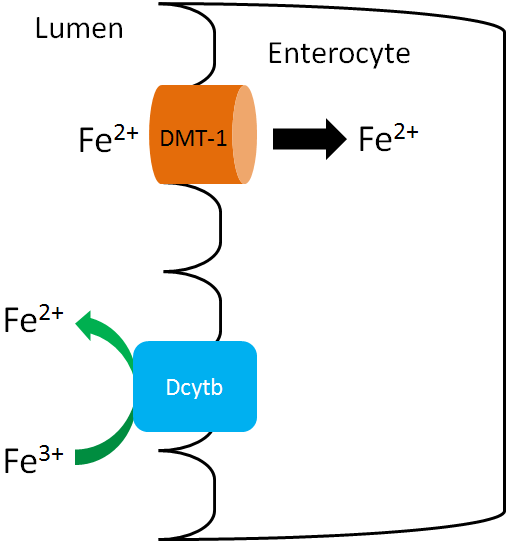
Since only the reduced form of non-heme iron (Fe2+) is taken up, Fe3+ must be reduced. There is a reductase enzyme on the brush border, duodenal cytochrome b (Dcytb), that catalyzes the reduction of Fe3+ to Fe2+, as shown below. Vitamin C enhances non-heme iron absorption because it is required by Dcytb for this reaction. Thus, if dietary non-heme iron is consumed with vitamin C, more non-heme iron will be reduced to Fe2+ and taken up into the enterocyte through DMT1.
In addition to vitamin C, there is an unidentified factor in muscle that enhances non-heme iron absorption if consumed at the same meal3. This unidentified factor is referred to as meat protein factor (MPF). The table shows how MPF can increase non-heme iron absorption.
Table 12.711 Non-heme iron absorption from chicken or beef muscle fraction3
| Mean Fe Absorption
(% of Dose) |
Egg Albumin | Whole Muscle | Whole Muscle Protein | Heme-Free Muscle Protein |
| Chicken | 8.41 | 16.43 | 26.98 | 36.81 |
| Beef | 11.21 | 31.52 | 44.15 | 38.29 |
Albumin is a protein, so the egg albumin represents a non-meat protein standard for comparison. You can see that absorption is much higher with whole muscle. When only consuming muscle protein, there is a slight increase from muscle itself, and when they look at heme-free muscle iron, absorption is still higher than egg albumin3.
Inhibitors of non-heme iron absorption typically chelate, or bind, the iron to prevent absorption. Phytates (phytic acid), which also inhibit calcium absorption, chelate non-heme iron decreasing its absorption.

Other compounds that inhibit absorption are:
Polyphenols (coffee, tea)1

Oxalate (spinach, rhubarb, sweet potatoes, and dried beans)2

Calcium is also believed to inhibit iron uptake.
References & Links
- Gropper SS, Smith JL, Groff JL. (2008) Advanced nutrition and human metabolism. Belmont, CA: Wadsworth Publishing.
- Shils ME, Shike M, Ross AC, Caballero B, Cousins RJ, editors. (2006) Modern nutrition in health and disease. Baltimore, MD: Lippincott Williams & Wilkins.
- Hurrell R, Reddy M, Juillerat M, Cook J. (2006) Meat protein fractions enhance nonheme iron absorption in humans. J Nutr 136(11): 2808-2812.
- http://en.wikipedia.org/wiki/File:Phytic_acid.png
- http://en.wikipedia.org/wiki/File:Gallic_acid.svg
- http://en.wikipedia.org/wiki/File:Calcium_oxalate.png
12.72 Iron Transport & Storage
Transferrin is the major iron transport protein (transports iron through blood). Fe3+ is the form of iron that binds to transferrin, so the Fe2+ transported through ferroportin must be oxidized to Fe3+. There are 2 copper-containing proteins that catalyze this oxidation of Fe2+: hephaestin and ceruloplasmin. Hephaestin is found in the membrane of enterocytes, while ceruloplasmin is the major copper transport protein in blood. Hephaestin is the primary protein that performs this function in a coupled manner (occur together) with transport through ferroportin. This means that the Fe2+ being transported through ferroportin is oxidized by hephaestin. Evidence suggests that ceruloplasmin is involved in oxidizing Fe2+ when iron status is low1. Once oxidized, Fe3+ binds to transferrin and is transported to a tissue cell that contains a transferrin receptor. Transferrin binds to the transferrin receptor and is endocytosed, as shown below2.
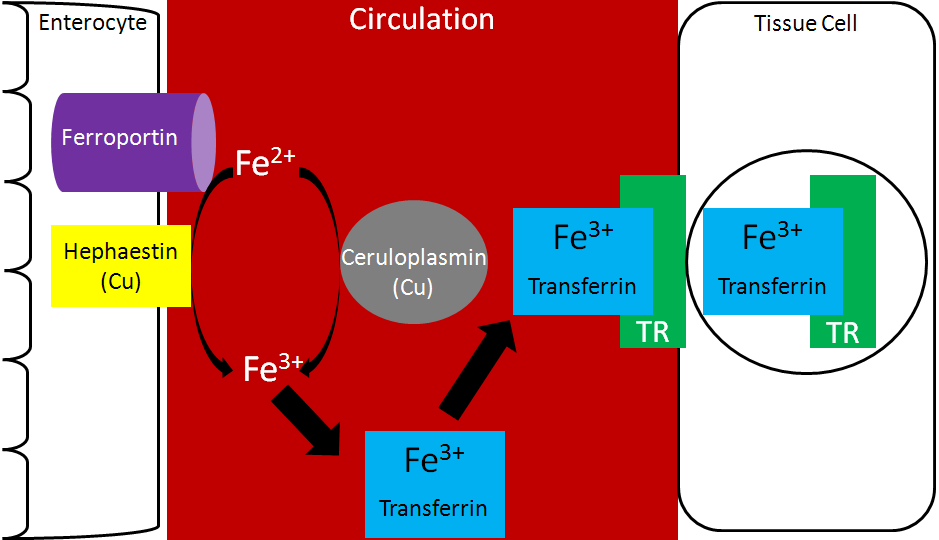
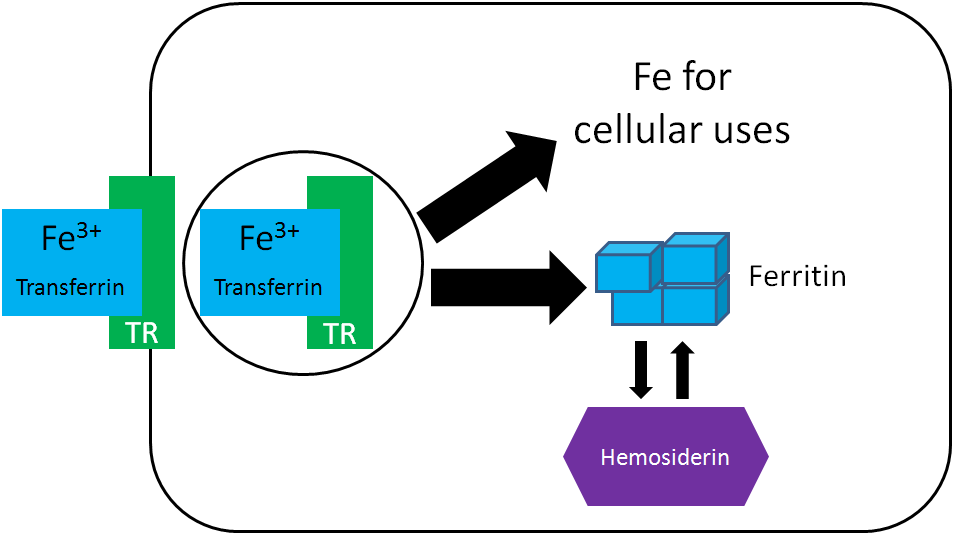
Once inside cells, the iron can be used for cellular purposes (cofactor for enzyme etc.) or it can be stored in the iron storage proteins ferritin or hemosiderin. Ferritin is the primary iron storage protein, but at higher concentrations, iron is also stored in hemosiderin2.
There are 3 major compartments of iron in the body3:
- Functional Iron
- Storage Iron
- Transport Iron
Functional iron consists of iron performing some function. There are 3 functional iron subcompartments.
- Hemoglobin
- Myoglobin
- Iron-containing enzymes
The functions of these subcompartments are discussed in the next section.
Iron Stores consist of:
- Ferritin
- Hemosiderin
The liver is the primary storage site in the body, with the spleen and bone marrow being the other major storage sites.
Circulating iron is found in transferrin3.
The following table shows how much iron is distributed among the different compartments.
Table 12.721 Iron Distribution in adults (mg Fe/kg body weight)3
| Men | Women | |
| Functional iron | ||
| Hemoglobin | 32 | 28 |
| Myoglobin | 5 | 4 |
| Fe-containing enzymes | 1-2 | 1-2 |
| Storage iron | ||
| Ferritin and hemosiderin | ~11 | ~6 |
| Transport iron | ||
| Transferrin | 0.04 | 0.04 |
Hopefully you notice that the majority of iron is in the functional iron compartment. The figure below further reinforces this point, showing that most iron is found in red blood cells (hemoglobin) and tissues (myoglobin).

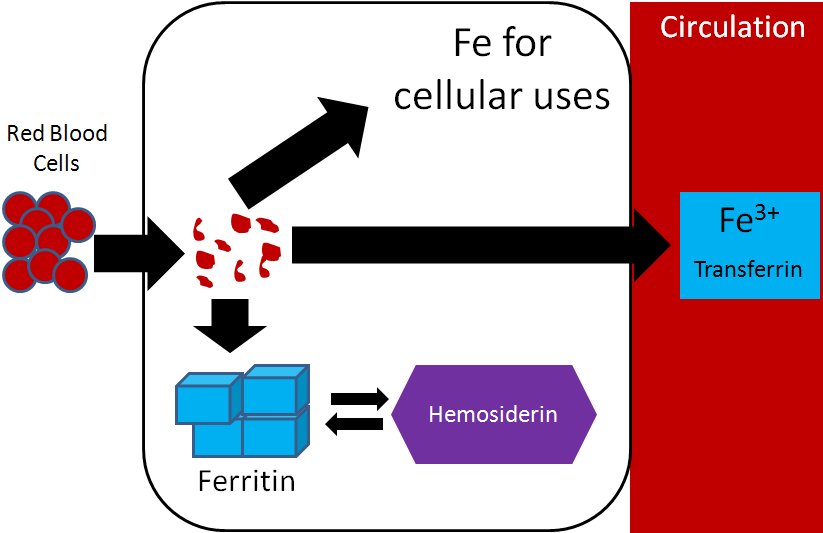
Also notice how small oral intake and excretion are compared to the amount found in the different compartments in the body. As a result, iron recycling is really important, because red blood cells only live for 120 days. Red blood cells are broken down in the liver, spleen, and bone marrow and the iron can be used for the same purposes as described earlier: cellular use, storage, or transported to another tissue on transferrin2. Most of this iron will be used for heme and ultimately red blood cell synthesis. The figure below summarizes the potential uses of iron recycled from red blood cells.
Iron is unique among minerals in that our body has limited excretion ability. Thus, absorption is controlled by the hormone hepcidin. The liver has an iron sensor so when iron levels get high, this sensor signals for the release of hepcidin. Hepcidin causes degradation of ferroportin. Thus, the iron is not able to be transported into circulation5.
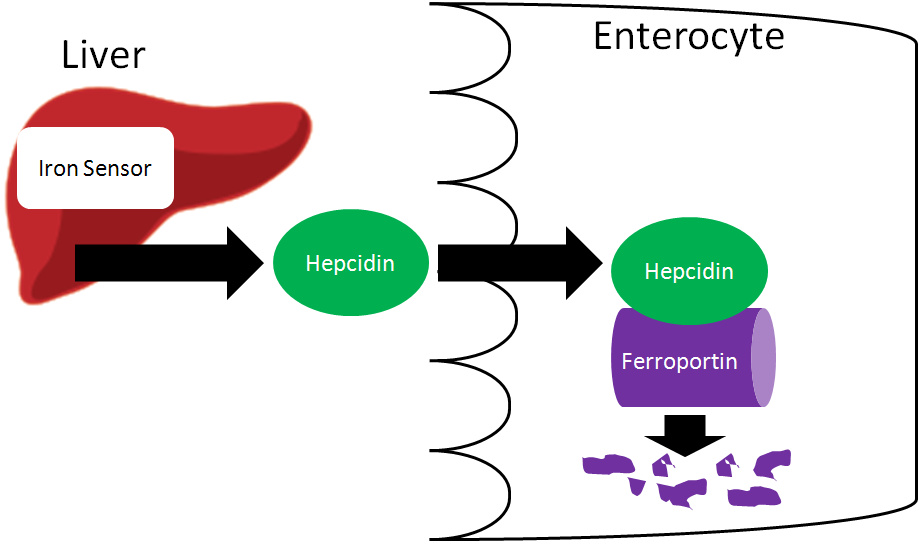
The iron is now trapped in the enterocyte, which is eventually sloughed off and excreted in feces. Thus, iron absorption is decreased through the action of hepcidin.

References & Links
- Yehuda S, Mostofsky DI (2010) Iron Deficiency and Overload: From Basic Biology to Clinical Medicine. New York, NY. Humana Press.
- Gropper SS, Smith JL, Groff JL. (2008) Advanced nutrition and human metabolism. Belmont, CA: Wadsworth Publishing.
- Stipanuk MH. (2006) Biochemical, physiological, & molecular aspects of human nutrition. St. Louis, MO: Saunders Elsevier.
- http://en.wikipedia.org/wiki/File:Iron_metabolism.svg
- Nemeth E, Ganz T. (2006) Regulation of iron metabolism by hepcidin. Annu Rev Nutr 26: 323-342.
12.73 Iron Functions
As we talked about in the previous subsection, there are 3 primary functional iron subcompartments.
- Hemoglobin
- Myoglobin
- Iron-containing enzymes
Hemoglobin contains heme that is responsible for red blood cells’ red color. Hemoglobin carries oxygen to tissues. The function of hemoglobin can be seen in the link below.
| Web Link |
Myoglobin is similar to hemoglobin in that it can bind oxygen. However, instead of being found in blood, it is found in muscle. The color of meat products is a result of the state that myoglobin is in, as shown in the link below.
| Web Link |
There are a number of enzymes that use iron as a cofactor. We’ve already talked about two in this class.
Iron is a cofactor for the antioxidant enzyme, catalase, that converts hydrogen peroxide to water, as shown below.

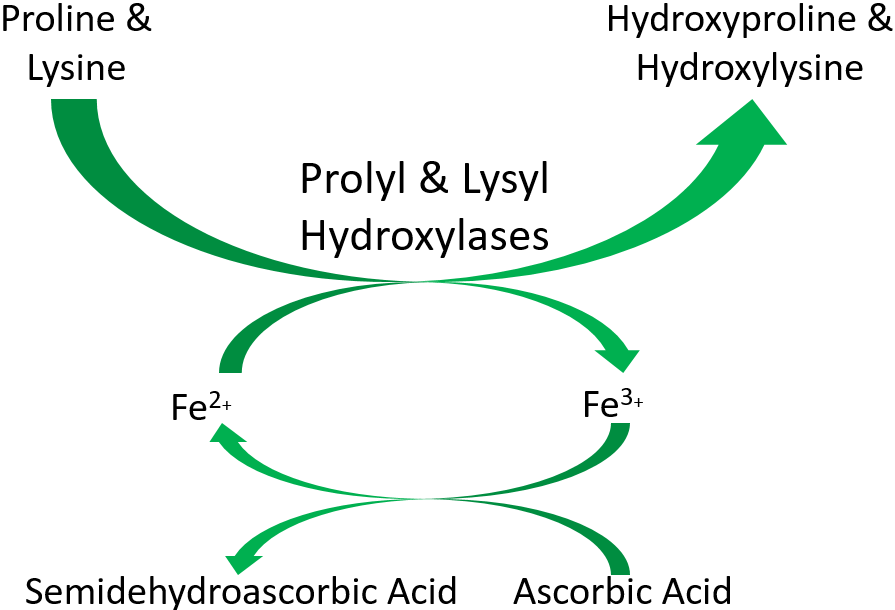
Iron is also a cofactor for proline and lysyl hydroxylases that are important in collagen cross-linking. This will be discussed further in the vitamin C section. The function of these enzymes is shown below.
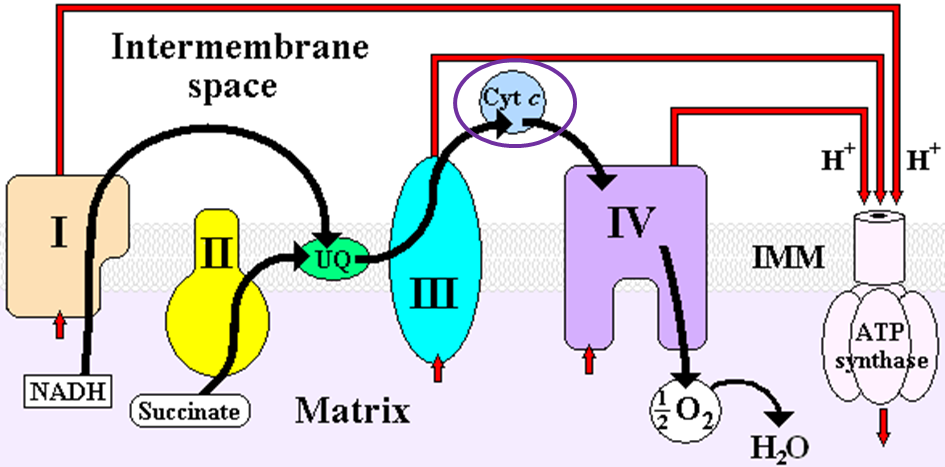
Heme iron is also found in cytochromes, like cytochrome c in the electron transport chain as shown below1.
iron2
References & Links
- Gropper SS, Smith JL, Groff JL. (2008) Advanced nutrition and human metabolism. Belmont, CA: Wadsworth Publishing.
- http://wikidoc.org/index.php/File:ETC.PNG
Links
Hemoglobin – http://www.nlm.nih.gov/medlineplus/ency/imagepages/19510.htm
Myoglobin & Meat Color – http://meatisneat.files.wordpress.com/2009/09/slide11.jpg
12.74 Iron Deficiency & Toxicity
The levels of iron in the different compartments is illustrated by the figure below. The red above the table is meant to represent the amount of iron in the different compartments. In early negative iron balance stage, iron stores are slightly depleted. Once the stores are almost completely exhausted, this state is referred to as iron depletion. In iron deficiency, stores are completely exhausted and the circulating and functional iron levels are also depleted. In iron anemia, the circulating and functional iron levels are further depleted from iron-deficiency.
1 Great measure, but invasive
2 Small amount are released from liver, bone, and spleen – proportional to body stores
3 Also referred to as total iron-binding capacity
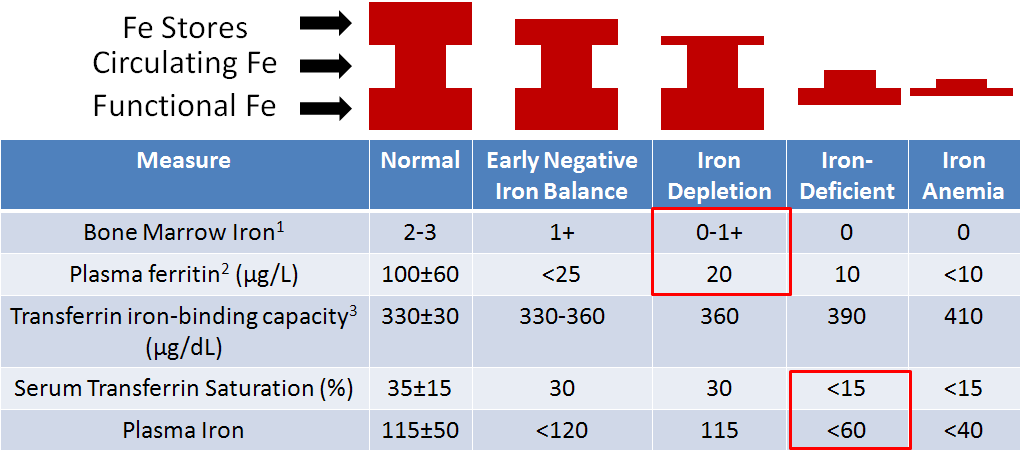
The most common measures of iron status are hemoglobin concentrations and hematocrit (described below) levels. A decreased amount of either measure indicates iron deficiency, but these two measures are among the last to indicate that iron status is depressed. This is because, as you can see in the figure above, circulating iron (plasma iron) levels are not altered until you reach iron deficiency. Thus, other measures are likely better choices1.
The hematocrit, as illustrated in the figure below, is a measure of the proportion of red blood cells (erythrocytes) as compared to all other components of blood. The components are separated by a centrifuge. The red blood cells remain at the bottom of the tube. They can be quantified by measuring the packed cell volume (PCV) relative to the total whole blood volume.

One of the best measures of iron status is bone marrow iron, but this is an invasive measure, and is therefore not commonly used. Plasma ferritin, the iron storage protein, is also found in lower amounts in the blood (plasma) and is a good indicator of iron stores. Thus, it is a sensitive measure to determine if someone is in negative iron balance or iron depleted. It is not as useful of a measure beyond this stage because the iron stores have been exhausted for the most part. Transferrin iron binding capacity (aka total iron binding capacity), as it sounds, is a measure of how much iron transferrin can bind. An increase in transferrin iron binding capacity indicates deficiency (>400 indicates deficiency). But the best measure for deficiency or anemia is either percent serum transferrin saturation or plasma iron. A lower % saturation means that less of the transferrin are saturated or carrying the maximum amount of iron that they can handle. Plasma iron is easily understood as the amount of iron within the plasma1.
Iron deficiency is the most common deficiency worldwide, estimated to affect 1.6 billion people. In the US, it is less common, but an estimated 10% of toddlers and women of childbearing age are deficient. Iron deficiency often results in a microcytic (small cell), hypochromic (low color) anemia, that is a result of decreased hemoglobin production. With decreased hemoglobin, the red blood cells cannot carry as much oxygen. Decreased oxygen leads to slower metabolism. Thus, a person with this anemia feels fatigued, weak, apathetic, and can experience headaches6. Other side effects include decreased immune function and delayed cognitive development in children7.
Those who are particularly at risk are1,7:
Women of childbearing age – because of losses due to menstruation
Pregnant women – because of increased blood volume
Vegetarians – because they do not consume heme iron sources
Infants – because they have low iron stores that can quickly be depleted
To give you a better understanding of these risks, it is helpful to look at how much higher the RDAs are for women of reproductive age and pregnant women compared to men8.
Women of reproductive age 18 mg/day
Pregnancy 27 mg/day
Men 8 mg/day
To put this in perspective, 3 oz of beef contains ~3 mg of iron. Thus, it can be a challenge for some women to meet the requirement. The RDA committee estimates the iron requirements to be 80% and 70% higher for vegans and endurance athletes, respectively. The increased requirement for endurance athletes is based on loss due to “foot strike hemolysis”, or the increased rupture of red blood cells due to the striking of the foot on hard surfaces3.
Iron toxicity is rare in adults, but can occur in children who consume too many supplements containing iron. Symptoms of this acute toxicity include nausea, vomiting, and diarrhea7.
50 out of 10,000 newborns in the United States are born with the genetic condition, hemochromatosis. In this condition, there is a mutation in a protein in the enterocyte that prevents the normal decrease of intestinal iron absorption. Without this protein these individuals cannot decrease iron absorption. Since the body cannot excrete iron, it accumulates in tissues, and ultimately can result in organ failure1.
References & Links
- Gropper SS, Smith JL, Groff JL. (2008) Advanced nutrition and human metabolism. Belmont, CA: Wadsworth Publishing.
- Stipanuk MH. (2006) Biochemical, physiological, & molecular aspects of human nutrition. St. Louis, MO: Saunders Elsevier.
- McGuire M, Beerman KA. (2011) Nutritional sciences: From fundamentals to food. Belmont, CA: Wadsworth Cengage Learning.
- http://en.wikipedia.org/wiki/File:Illu_blood_components.svg
- http://en.wikipedia.org/wiki/File:Packed_cell_volume_diagram.svg
- Whitney E, Rolfes SR. (2011) Understanding nutrition. Belmont, CA: Wadsworth Cengage Learning.
- Byrd-Bredbenner C, Moe G, Beshgetoor D, Berning J. (2009) Wardlaw’s perspectives in nutrition. New York, NY: McGraw-Hill.
- Anonymous. (2001) Dietary reference intakes for vitamin A, vitamin K, arsenic, boron, chromium, copper, iodine, iron, manganese, molybdenum, nickel, silicon, vanadium, and zinc. Washington, D.C.: National Academies Press.
12.8 Zinc
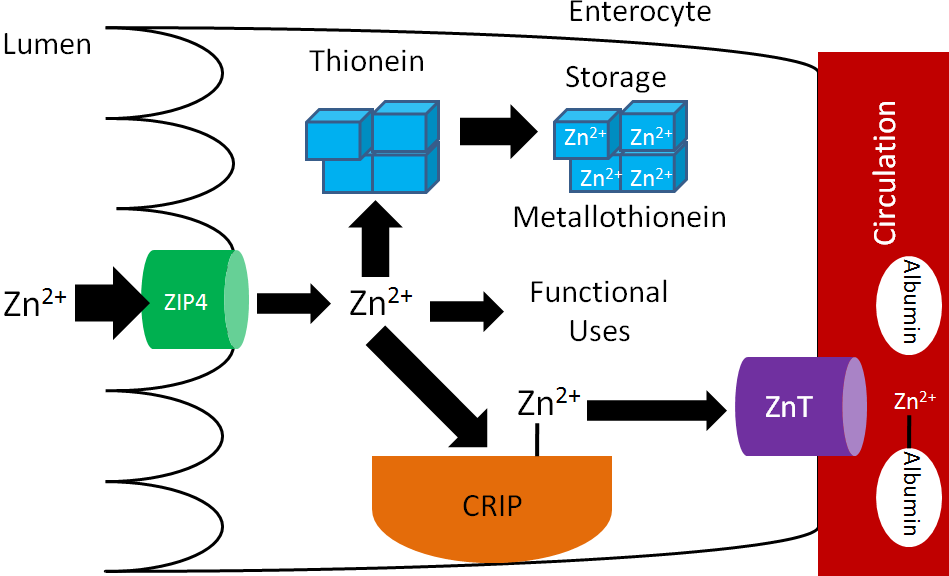
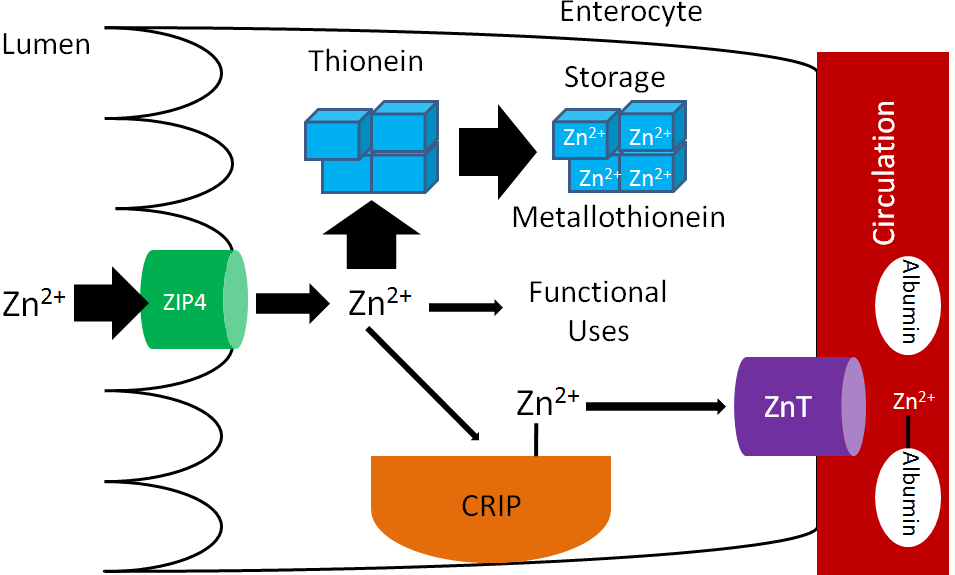
Many animal products are good sources of zinc and are estimated to account for 70% of the zinc North Americans’ consume1. An estimated 15-40% of consumed zinc is absorbed2. Zinc is taken up into the enterocyte through the Zir-and Irt-like protein 4 (ZIP4). Once inside the enterocyte, zinc can:
- Bind to the zinc storage protein thionein. Once thionein has bound a mineral (or a metal) it is known as metallothionein.
- Be used for functional purposes.
- Bind to the cysteine-rich intestinal protein (CRIP) where it is shuttled to a zinc transporter (ZnT). After moving through the basolateral membrane, zinc primarily binds to the circulating protein albumin3.
These functions are represented in the figure below.
The zinc attached to albumin is transported to the liver through the portal vein. There is not a major storage site of zinc, but there are pools of zinc in the liver, bone, pancreas, and kidney1. Zinc is primarily excreted in feces.
There are some similarities between zinc and iron absorption. Increased zinc consumption results in increased thionein synthesis in the enterocyte. As a result, more zinc is bound to thionein (forming metallothionein) and not used for functional uses or transported into circulation, as represented by the thick and thin arrows in the figure below.
The enterocytes are then sloughed off preventing the bound zinc from being absorbed.

There are a number of inhibitors of zinc absorption:
Phytate (phytic acid), which inhibits calcium and iron absorption, also binds to and inhibits zinc absorption3.

Polyphenols (coffee, tea)3
Oxalate (spinach, rhubarb, sweet potatoes, and dried beans)3
Non-heme iron also inhibits zinc absorption.
In supplements, zinc is found as3,7:
Zinc oxide – 80% zinc
Zinc chloride – 23% zinc
Zinc sulfate – 23% zinc
Zinc gluconate – 14.3% zinc
Zinc oxide is the least bioavailable form, but since it is 80% zinc, it is commonly used in supplements7.
Subsections:
12.81 Zinc Functions
12.82 Zinc Deficiency & Toxicity
References & Links
- Byrd-Bredbenner C, Moe G, Beshgetoor D, Berning J. (2009) Wardlaw’s perspectives in nutrition. New York, NY: McGraw-Hill.
- Whitney E, Rolfes SR. (2011) Understanding nutrition. Belmont, CA: Wadsworth Cengage Learning.
- Gropper SS, Smith JL, Groff JL. (2008) Advanced nutrition and human metabolism. Belmont, CA: Wadsworth Publishing.
- http://en.wikipedia.org/wiki/File:Phytic_acid.png
- http://en.wikipedia.org/wiki/File:Gallic_acid.svg
- http://en.wikipedia.org/wiki/File:Calcium_oxalate.png
- Bowman BA, Russell RM, editors. (2006) Present knowledge in nutrition. Washington, DC: International Life Sciences Institute Press.
12.81 Zinc Functions
Zinc is a cofactor for up to 300 enzymes in the body1. Enzymes that use zinc as a cofactor are known as metalloenzymes.
Zinc is a cofactor for the antioxidant enzyme superoxide dismutase that converts superoxide to hydrogen peroxide, as shown below.
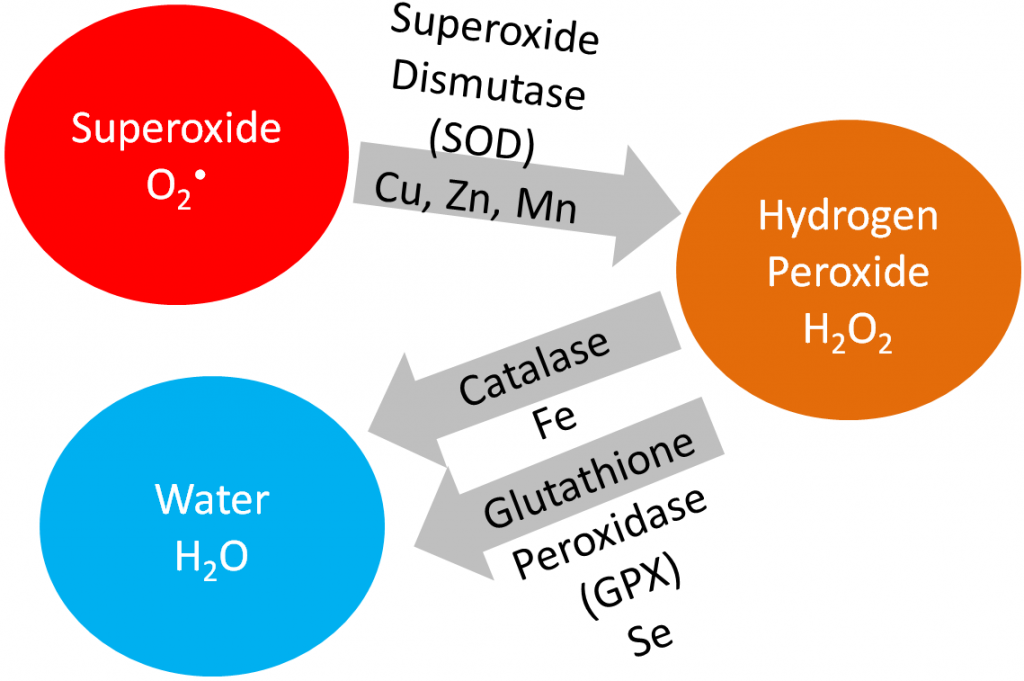
Alcohol dehydrogenase uses 4 zincs per enzyme. Its role in ethanol metabolism is shown below2.
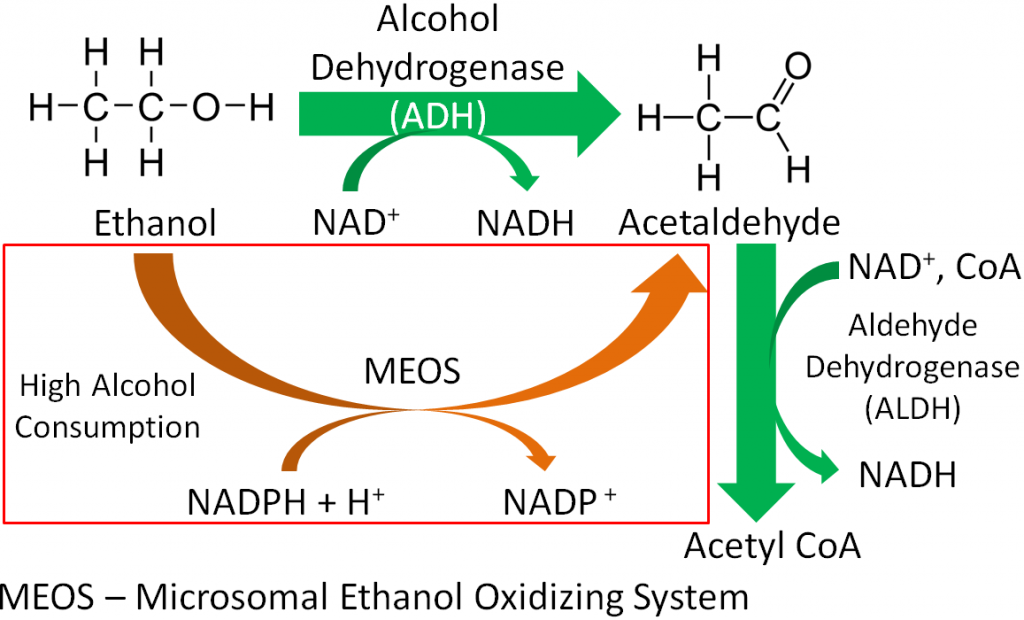
Delta-aminolevulinic acid dehydratase (ALA dehydrogenase), which is involved in heme synthesis, uses 8 zincs/enzyme to form porphobilinogen, as shown below2.
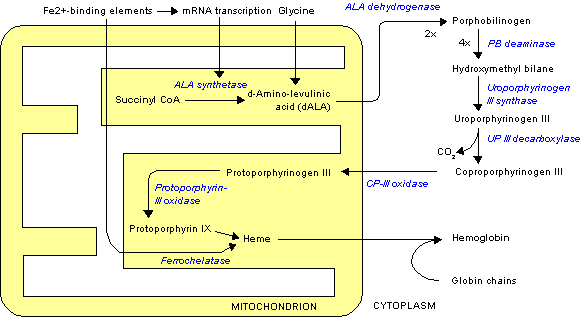
The enzyme that cleaves the extra glutamates from folate so that it can be taken up into the enterocyte is a metalloenzyme2. The cleavage of folate is shown in the figure below.
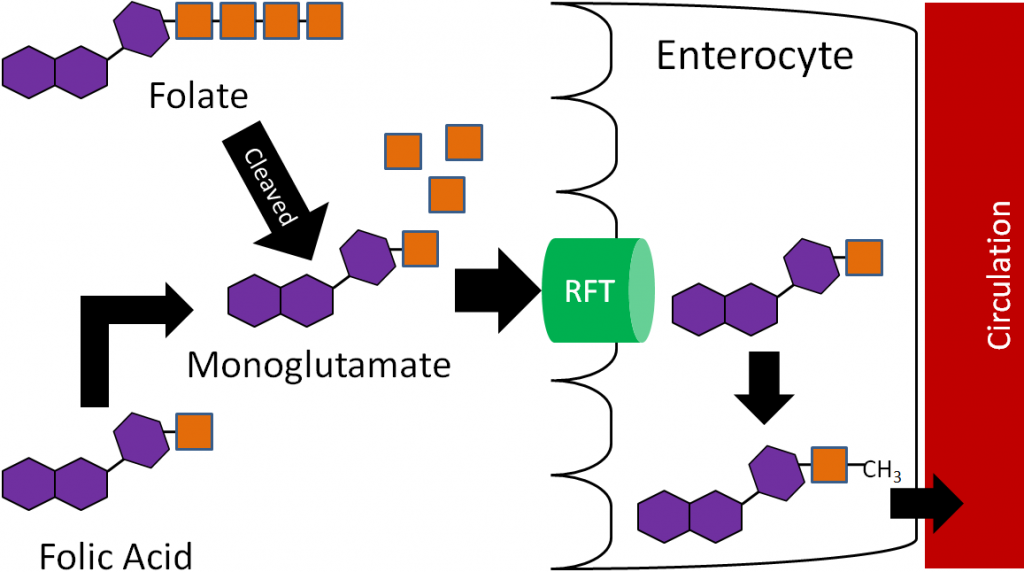
Other notable metalloenzymes include DNA and RNA polymerase2.
Zinc is also important for the formation of zinc fingers in proteins. Zinc fingers help proteins bind to DNA2.
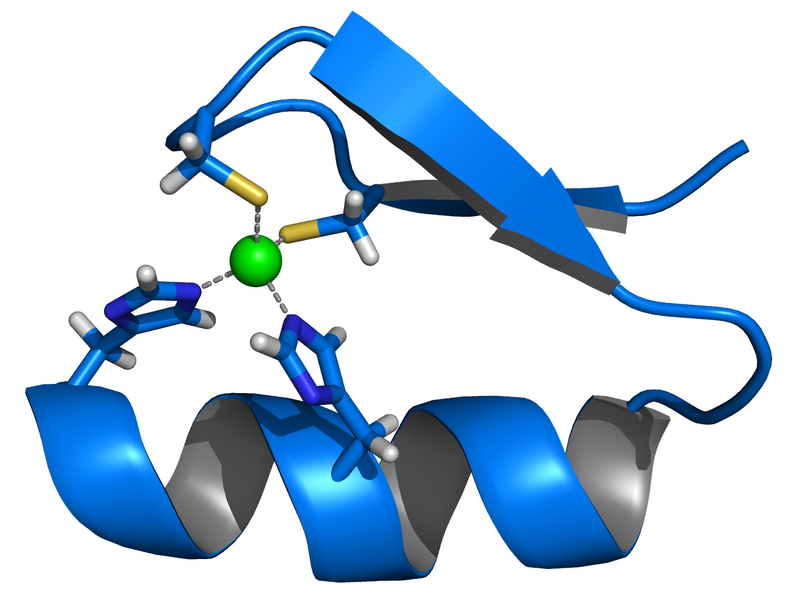
Zinc is also important for growth, immune function, and reproduction2.
A recent Cochrane review concluded that when taken within 24 hours of the onset of symptoms, that zinc lozenges or syrup results in a significant decrease in the duration and severity of common cold symptoms7. Thus, commonly used zinc lozenges may be an effective way to combat the common cold. However, large amounts of zinc consumption can be problematic for copper and ultimately iron levels in the body, as described in the copper section.
References & Links
- Byrd-Bredbenner C, Moe G, Beshgetoor D, Berning J. (2009) Wardlaw’s perspectives in nutrition. New York, NY: McGraw-Hill.
- Gropper SS, Smith JL, Groff JL. (2008) Advanced nutrition and human metabolism. Belmont, CA: Wadsworth Publishing.
- http://en.wikipedia.org/wiki/File:Ethanol_flat_structure.png
- https://en.wikipedia.org/wiki/Acetaldehyde#/media/File:Acetaldehyde-2D-flat.svg
- http://en.wikipedia.org/wiki/File:Heme_synthesis.png
- http://en.wikipedia.org/wiki/File:Zinc_finger_rendered.png
- Singh M, Das RR. (2011) Zinc for the common cold (Review). The Cochrane Collaboration.
12.82 Zinc Deficiency & Toxicity
As can be seen on the bottom map in the link below, the risk of zinc deficiency is low in North America, but there are other places in the world where it is much more common.
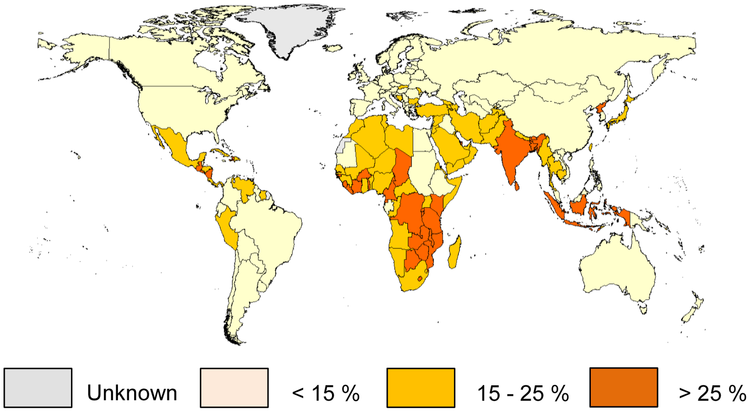
At particular risk are children, pregnant women, elderly and the poor1. Symptoms of zinc deficiency include2,3:
Growth inhibition
Delayed sexual maturation
Dermatitis
Hair loss
Impaired immune function
Skeletal abnormalities
In the link below you can see a picture of an infant with dermatitis caused by zinc deficiency.
| Web Link |
Another cause of zinc deficiency is mutation of ZIP4 that results in the condition acrodermatitis enteropathica. Without ZIP4, zinc cannot be taken up efficiently into the enterocyte. This condition is managed by administering very high levels of zinc, some of which is absorbed through other mechanisms3.
Zinc toxicity is not common, but an acute toxicity results in2:
Nausea
Vomiting
Intestinal cramps
Diarrhea
Chronic toxicity can result in copper deficiency, as will be discussed in the copper section3.
References & Links
- Wessells KR, Brown KH. (2012) Estimating the Global Prevalence of Zinc Deficiency: Results Based on Zinc Availability in National Food Supplies and the Prevalence of Stunting. PLoS ONE 7(11): e50568
- Byrd-Bredbenner C, Moe G, Beshgetoor D, Berning J. (2009) Wardlaw’s perspectives in nutrition. New York, NY: McGraw-Hill.
- Gropper SS, Smith JL, Groff JL. (2008) Advanced nutrition and human metabolism. Belmont, CA: Wadsworth Publishing.
Links
Zinc Deficiency – http://www.izincg.org/publications/deficiency
Zinc Deficiency Dermatitis – http://img.tfd.com/mosbycam/thumbs/50029X-fx3.jpg
12.9 Copper
Like iron, copper is found in 2 forms:
- Cupric (Cu2+), oxidized
- Cuprous (Cu1+), reduced
Cu1+ is the form that is primarily absorbed, thus Cu2+ is reduced to Cu1+ in the lumen. It is believed that, like iron, enzymatic reduction of Cu2+ is stimulated by ascorbate. The exact transporter that takes up the copper into the enterocyte is not known. It may be DMT1 that takes up non-heme iron. Once inside the enterocyte, Cu1+ can1:
- Bind to thionein to form metallothionein. While zinc is a better stimulator of thionein levels, copper is actually a more avid binder to this protein.
- Be used for functional uses discussed in the next subsection.
- Transported across the cell by an unknown carrier and then exported by ATP7A, an ATPase transporter.
Like zinc, copper is transported through the portal vein to the liver bound to albumin, as shown below. Albumin has a high affinity for Cu2+, so Cu1+ is oxidized before transported to albumin through ATP7A, as illustrated below.
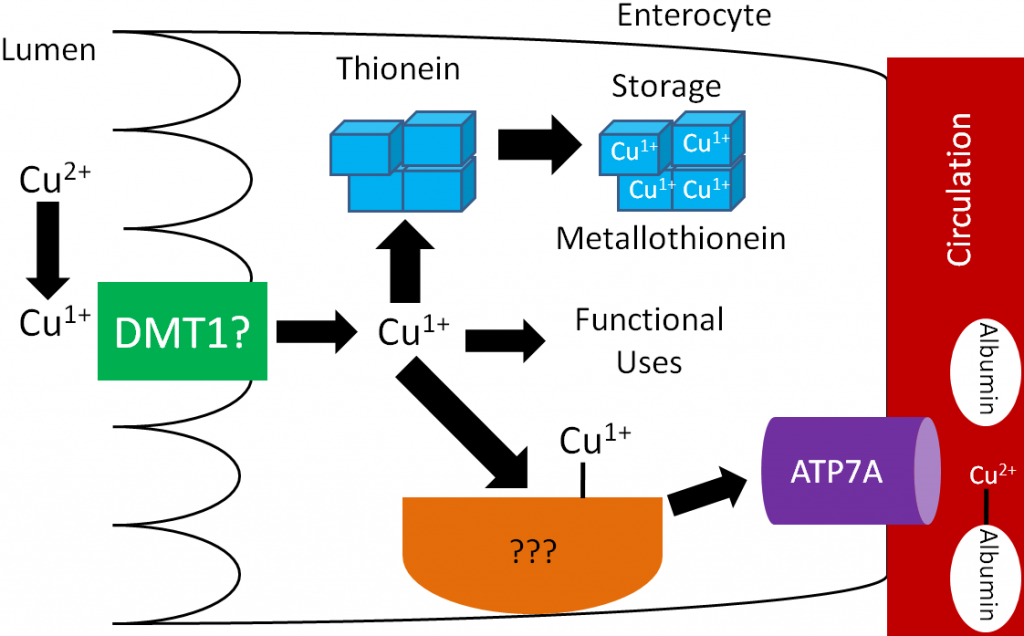
Like zinc, there is not much storage of copper in the body. The liver is the primary site of storage, where copper is taken up through an unknown transporter. If it is going to be stored, it will bind with thionein to form metallothionein. Copper to be sent out to the body is transferred to the copper transport protein ceruloplasmin, which can bind 6 coppers/protein as shown below1.
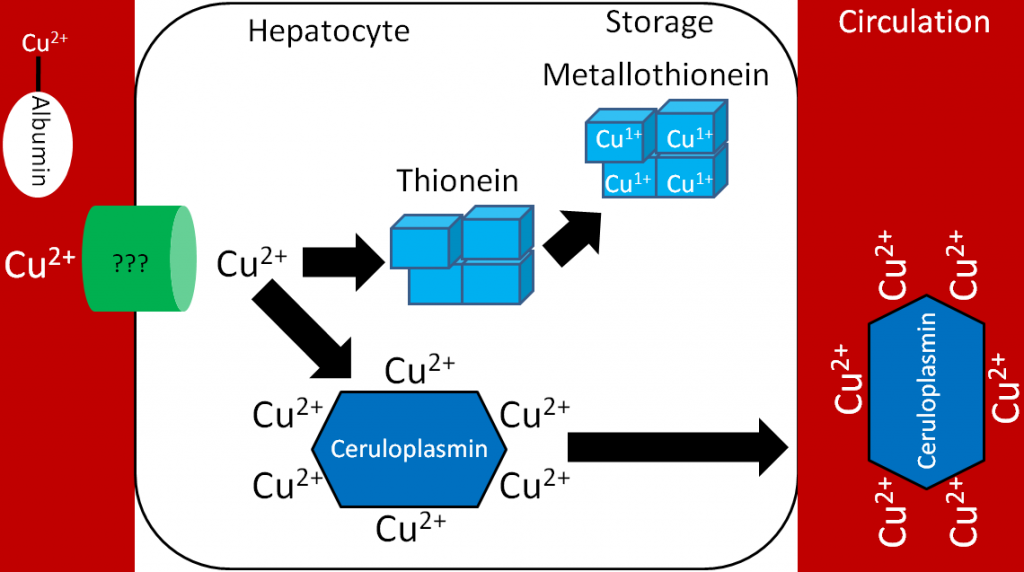
Legumes, whole grains, nuts, shellfish, and seeds are good sources of copper2. It is estimated that over 50% of copper consumed is absorbed1. Copper is primarily excreted in the feces.
There are number of different forms of copper used in supplements:
Copper sulfate (25% copper)
Cupric chloride (47% copper)
Cupric acetate (35% copper)
Copper carbonate (57% copper)
Cupric oxide (80% copper)
All of these forms of copper are bioavailable, except cupric oxide. Assays have shown that it is not absorbed at all. Nevertheless, some supplements still use this form of copper1,3.
Subsections:
12.91 Copper Functions
12.92 Copper Deficiency & Toxicity
12.93 How High Zinc Intake Can Lead to Iron & Copper Deficiencies
References & Links
- Gropper SS, Smith JL, Groff JL. (2008) Advanced nutrition and human metabolism. Belmont, CA: Wadsworth Publishing.
- Whitney E, Rolfes SR. (2011) Understanding nutrition. Belmont, CA: Wadsworth Cengage Learning.
- Baker DH. (1999) Cupric oxide should not be used as a copper supplement for either animals or humans. J Nutr 129(12): 2278-2279.
12.91 Copper Functions
Copper has a number of functions that are described and shown below.
Two copper-containing proteins, ceruloplasmin and hephaestin, oxidize Fe2+ to Fe3+. Fe3+ is the form that binds to transferrin, as shown below1.

Because copper is needed for this function, it is important for iron absorption.
Copper is also a cofactor for superoxide dismutase, which converts superoxide to hydrogen peroxide, as shown below.

Copper is also needed for hormone synthesis. For example, it is a cofactor for dopamine beta-hydroxylase, which converts dopamine to norepinephrine, as shown below1.

Hopefully the following example looks vaguely familiar because we talked about this pathway in the the vitamin C functions subsection. Ascorbic acid reduces Cu2+ back to Cu1+ so that this enzyme can continue to function, as shown below1. This is analogous to how ascorbic acid reduces Fe3+ back to Fe2+ so proline and lysyl hydroxylases can continue to function.
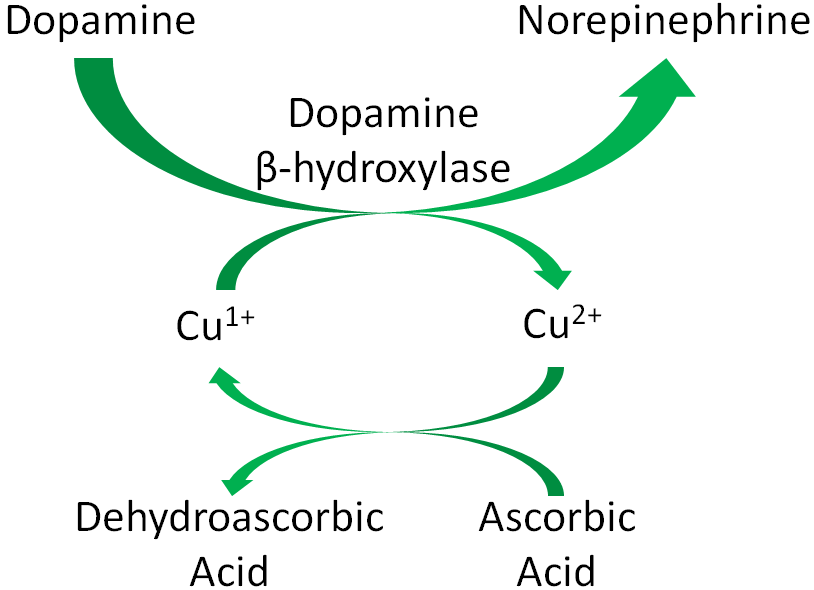
Cytochrome c oxidase (complex IV) in the electron transport chain is a copper-containing enzyme that reduces oxygen to form water, as shown below1.
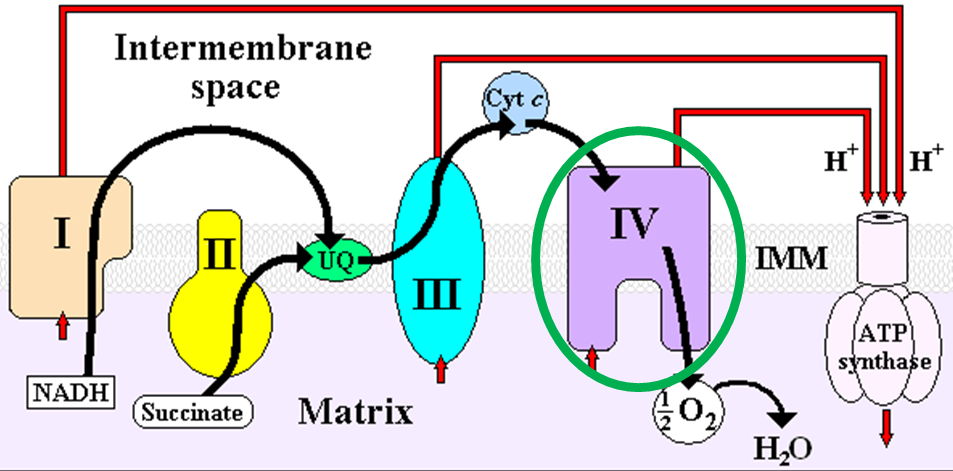
Lysyl oxidase, an enzyme that is important for cross-linking between structural proteins (collagen and elastin), requires copper as a cofactor1.
References & Links
- Gropper SS, Smith JL, Groff JL. (2008) Advanced nutrition and human metabolism. Belmont, CA: Wadsworth Publishing.
- http://en.wikipedia.org/wiki/File:Catecholamines_biosynthesis.svg
- http://wikidoc.org/index.php/File:ETC.PNG
12.92 Copper Deficiency & Toxicity
Copper deficiency is rare in humans, but results in the following symptoms1,2:
Hypochromic anemia
Decreased white blood cell counts leading to decreased immune function
Bone abnormalities
Copper deficiency can result in a secondary iron deficiency, since Fe2+ cannot be oxidized to Fe3+ to bind to transferrin. This can cause the hypochromic anemia that occurs in iron deficiency.
Menke’s disease is a genetic disorder that results in copper deficiency. It is believed that individuals with this disease have a mutation in ATP7A that prevents copper from leaving the enterocyte, thus preventing absorption1.
Copper toxicity is also rare in humans, but acute toxicity results in the following symptoms1,2:
Nausea, vomiting, diarrhea, abdominal pain
Chronic symptoms include1,2:
Brain, liver, and kidney damage
Neurological damage
Wilson’s disease is a genetic disorder where a mutation in ATP7B prevents copper excretion, resulting in copper toxicity. One notable symptom is that individuals with this disease have golden to greenish-brown Kayser-Fleischer rings around the edges of the cornea, as shown in the link below1,2.
| Web Link |
References & Links
- Gropper SS, Smith JL, Groff JL. (2008) Advanced nutrition and human metabolism. Belmont, CA: Wadsworth Publishing.
- Byrd-Bredbenner C, Moe G, Beshgetoor D, Berning J. (2009) Wardlaw’s perspectives in nutrition. New York, NY: McGraw-Hill.
Link
Kayser-Fleischer rings – http://www.nejm.org/doi/full/10.1056/NEJMicm1101534#t=article
12.93 How High Zinc Intake Can Lead to Copper & Iron Deficiencies
As you learned previously, thionein is the storage protein for zinc, but it more avidly binds copper. When it binds a mineral, it becomes metallothionein. High zinc intake results in increased thionein synthesis in the enterocyte. Thus, when an individual is consuming high zinc levels, the enterocyte will have high levels of thionein as shown below.
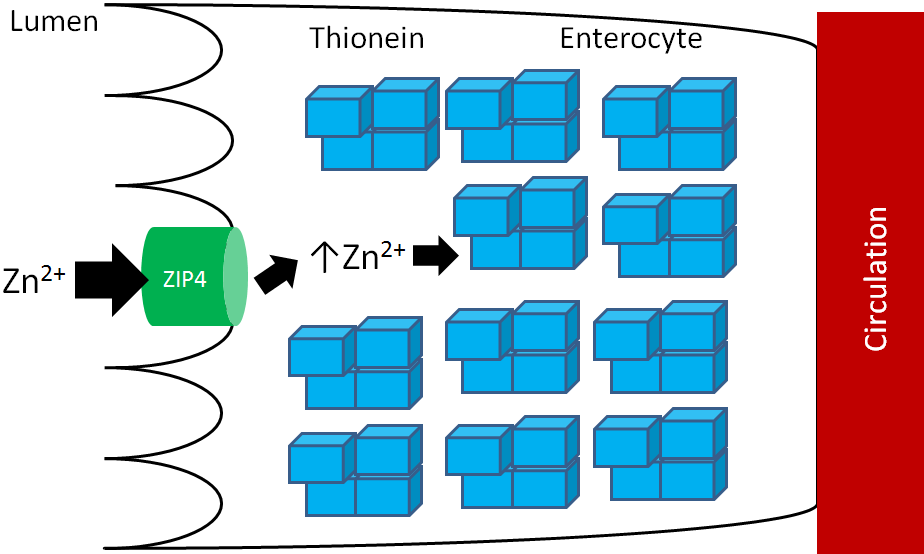
The high levels of thionein will bind any copper that is taken up into the enterocyte (as metallothionein), “trapping” the copper in the enterocyte and preventing it from being absorbed into circulation, as shown below.
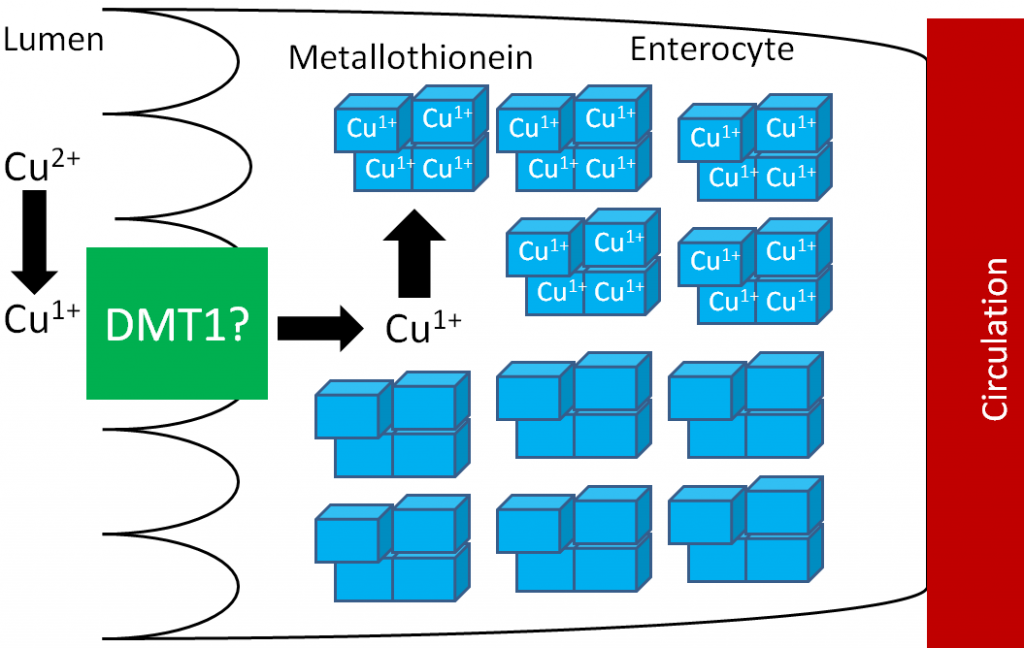
The enterocytes containing the “trapped” copper move up the crypt and are sloughed off and excreted in feces. The copper consumed essentially is lost from the body through this process.
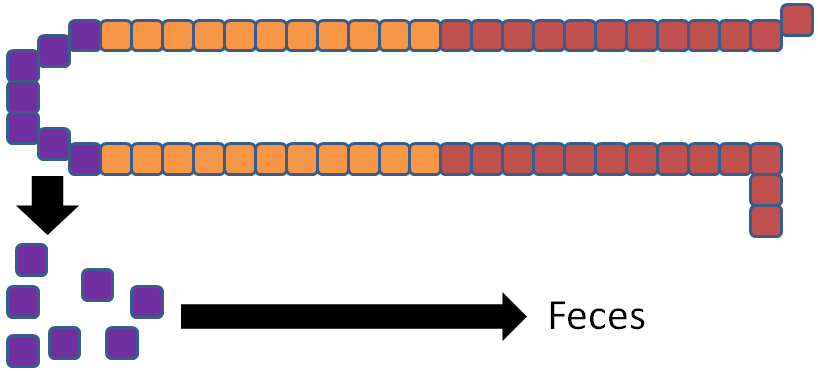
Without adequate copper being transported to the liver, no ceruloplasmin is produced and released into circulation. The lack of copper further influences iron transport by decreasing ceruloplasmin in circulation and hephaestin (another copper-containing protein) on the membrane of the enterocyte. These 2 proteins normally convert Fe2+ to Fe3+ so that iron can bind to transferrin.
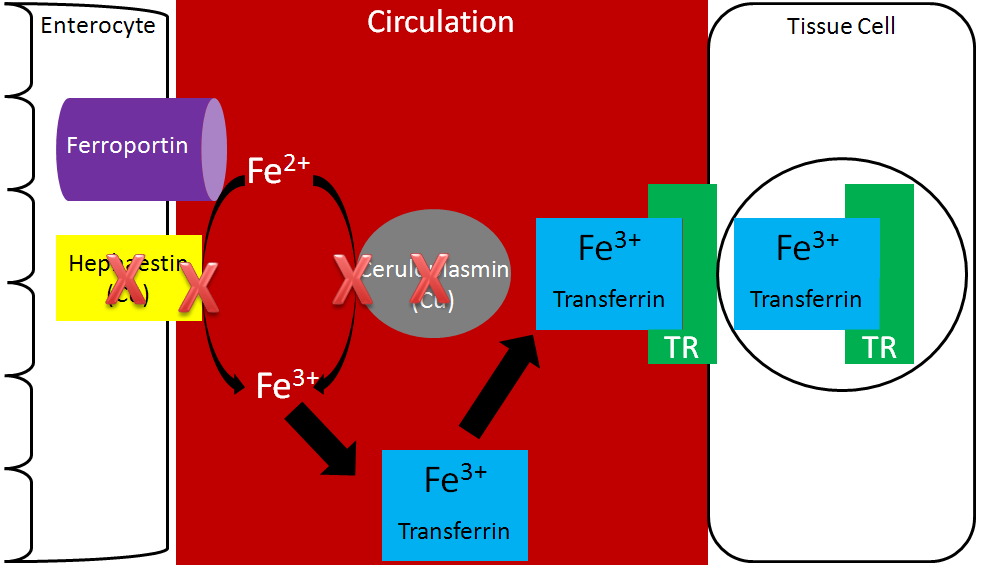
Without hephaestin and ceruloplasmin, Fe3+ is not formed from Fe2+. As a result Fe2+ is “trapped” in the enterocyte because it can’t bind to transferrin as shown below.
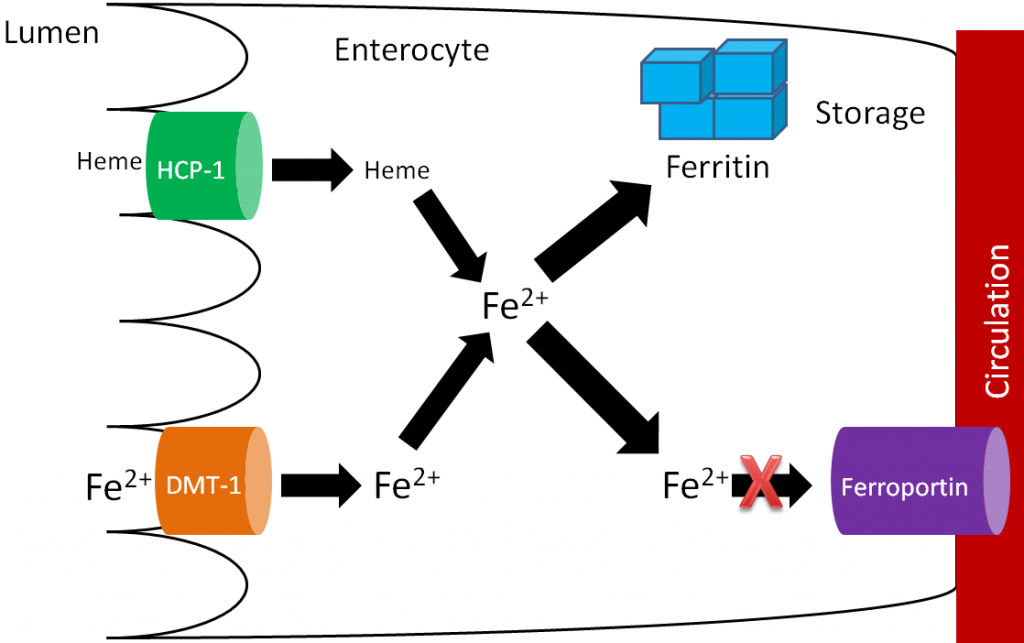
The enterocytes containing the “trapped” iron move up the crypt and are also sloughed off and excreted in feces. The iron consumed essentially is lost from the body through this process.

In summary, high zinc intake increases thionein production, which traps all copper; the lack of copper decreases circulating ceruloplasmin and hephaestin, which causes all iron to be trapped as well. This example illustrates the interconnectedness of zinc, copper, and iron.
No References

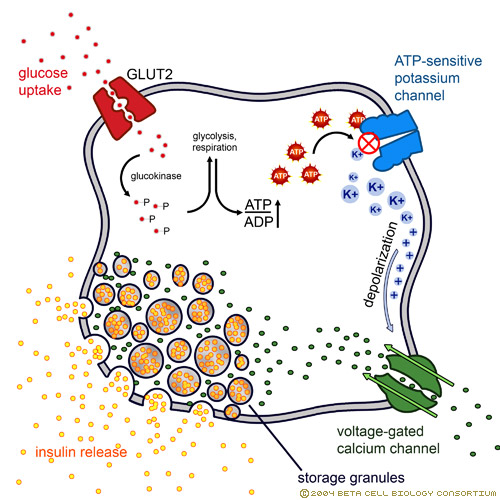