Main Body
Macronutrient & Alcohol Metabolism
Now that we have digested, taken up, absorbed, and transported the macronutrients, the next step is to learn how these macronutrients are metabolized. Alcohol is also included at the end of this chapter, even though it is not a macronutrient.
Sections:
6.1 Metabolism Basics
6.2 Carbohydrate Metabolism
6.3 Lipid Metabolism
6.4 Protein Metabolism
6.5 Alcohol Metabolism
6.1 Metabolism Basics
Metabolism consists of all the chemical processes that occur in living cells. These processes/reactions can generally be classified as either anabolic or catabolic. Anabolic means to build, catabolic means to breakdown. If you have trouble remembering the difference between the two, remember that anabolic steroids are what are used to build enormous muscle mass.
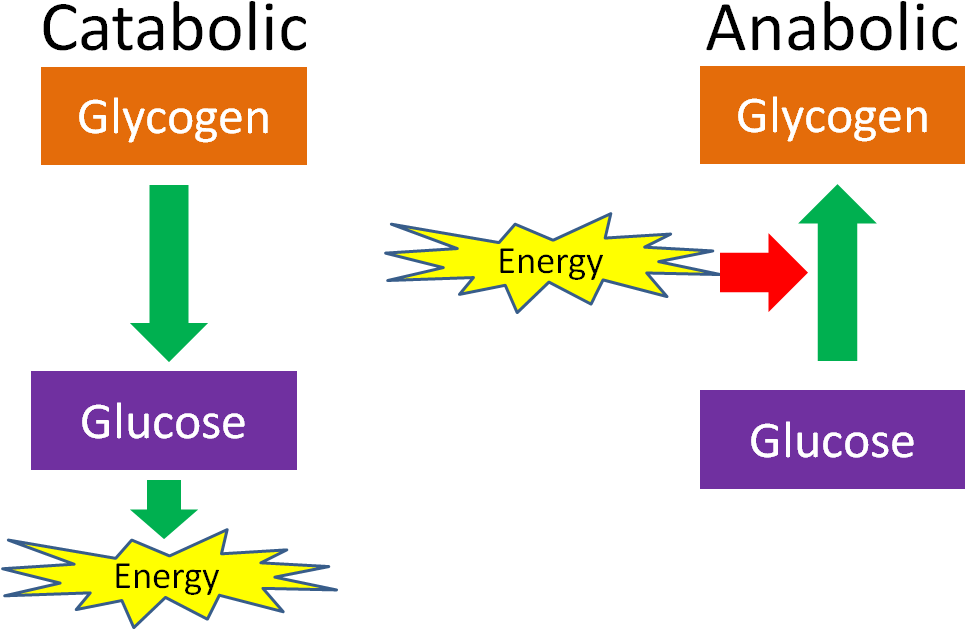
An anabolic reaction/pathway requires energy to build something. A catabolic reaction/pathway generates energy by breaking down something. This is shown in the example below of glucose and glycogen. The same is true for other macronutrients.
Anabolic and catabolic can also be used to describe conditions in the body. For instance, after a meal there is often a positive energy balance, or there is more energy and macronutrients than the body needs at that time. Thus, some energy needs to be stored and the macronutrients will be used for synthesis, such as amino acids being used for protein synthesis. However, after a fast, or a prolonged period without energy intake, the body is in negative energy balance and is considered catabolic. In this condition, macronutrients will be mobilized from their stores to be used to generate energy. For example, if prolonged enough, protein can be broken down, then the released amino acids can be broken down to be used as an energy source.
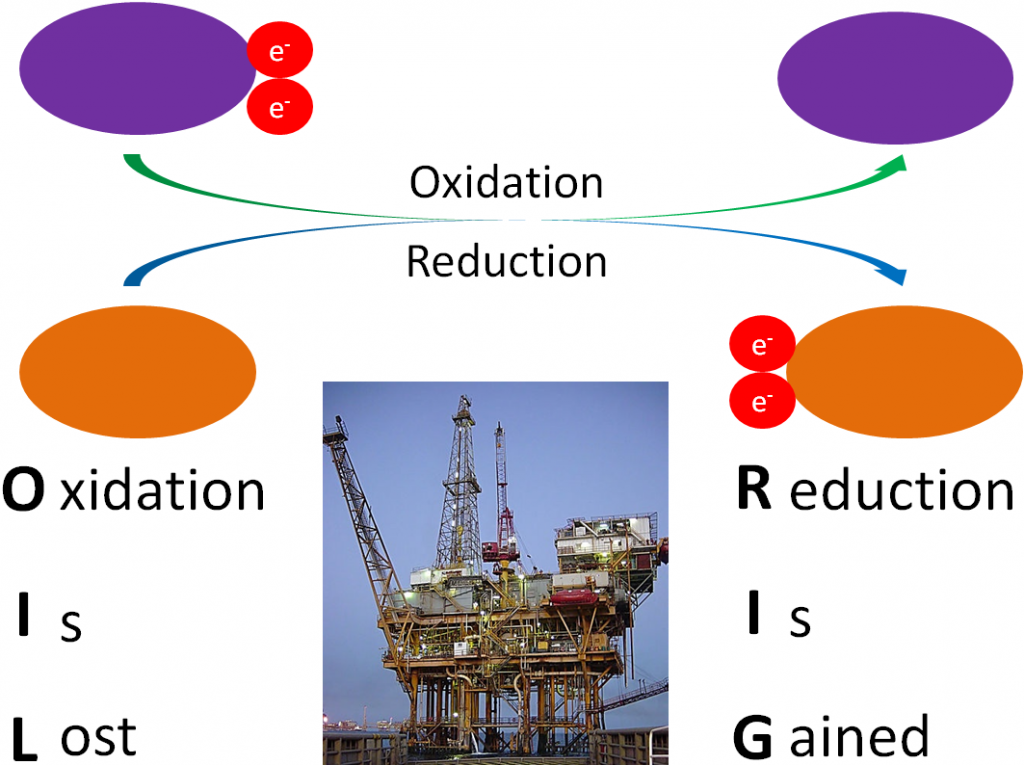
A number of the metabolic reactions oxidize or reduce compounds. A compound that is being oxidized loses at least one electron, while a compound that is reduced gains at least 1 electron. To remember the difference, a mnemonic device such as OIL (oxidation is lost), RIG (reduction is gained) is helpful. Oxidation-reduction reactions are illustrated in the figure below.
Another way to remember oxidation versus reduction is LEO goes GER (like a lion)
Lose Elections = Oxidize
Gain Elections = Reduce
Iron is a good example we can use to illustrate oxidation-reduction reactions. Iron commonly exists in two oxidation states (Fe3+ or Fe2+). It is constantly oxidized/reduced back and forth between the two states. The oxidation/reduction of iron is shown below.
\begin{align}
\ce{Fe^{3+} + e^- → Fe^{2+} Reduced}
\ce{Fe^{2+} → Fe^{3+} + e^- Oxidized}
\end{align}
However, some oxidation reduction reactions are not as easy to recognize. There are some simple rules to help you recognize less obvious oxidation/reduction reactions that are based upon the gain or loss of oxygen or hydrogen. These are as follows:
Oxidation: gains oxygen or loses hydrogen
Reduction: loses oxygen or gains hydrogen
References
- http://en.wikipedia.org/wiki/Image:Gulf_Offshore_Platform.jpg
6.11 Cofactors
A number of enzymes require cofactors to function. Some also require what other textbooks and resources refer to as coenzymes. But to keep things simple, we are going to include these coenzymes in our definition of cofactors. Thus, cofactors can be either organic or inorganic molecules that are required by enzymes to function. Many organic cofactors are vitamins or molecules derived from vitamins. Most inorganic cofactors are minerals. Cofactors can be oxidized or reduced for the enzymes to catalyze the reactions.
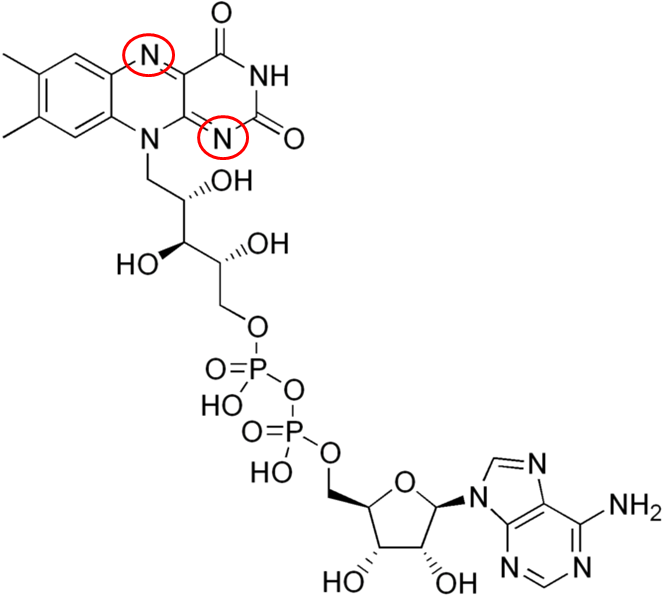
Two common cofactors that are derived from the B vitamins, niacin and riboflavin, are nicotinamide adenine dinucleotide (NAD) and flavin adenine dinucleotide (FAD), respectively. The structure of NAD and FAD are shown below.
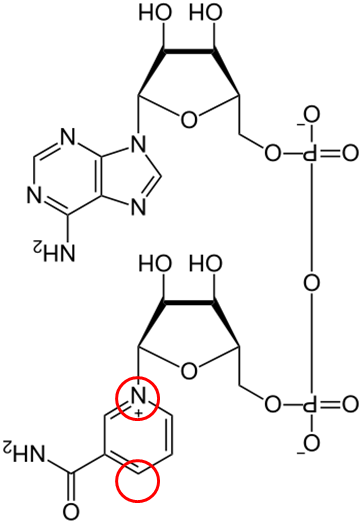
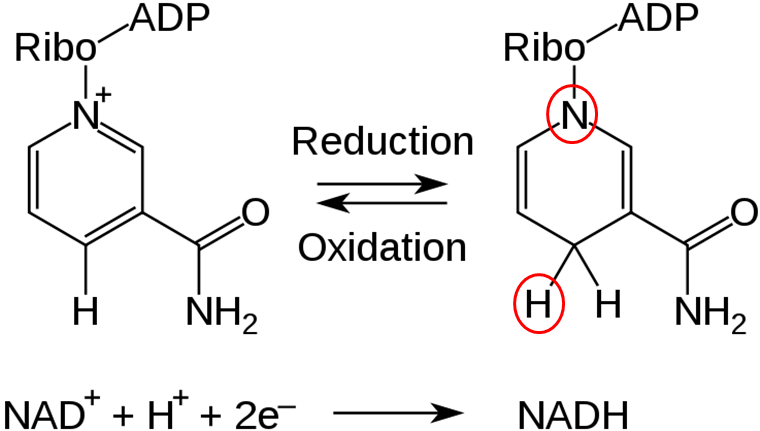
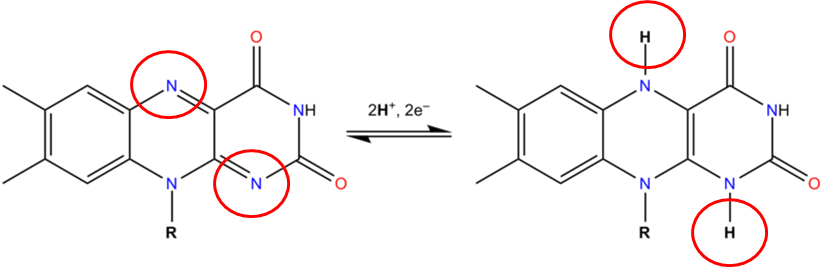
Both of these cofactors can be reduced; NAD is reduced to form NADH, while FAD is reduced to form FADH2 as shown in the 2 figures below.
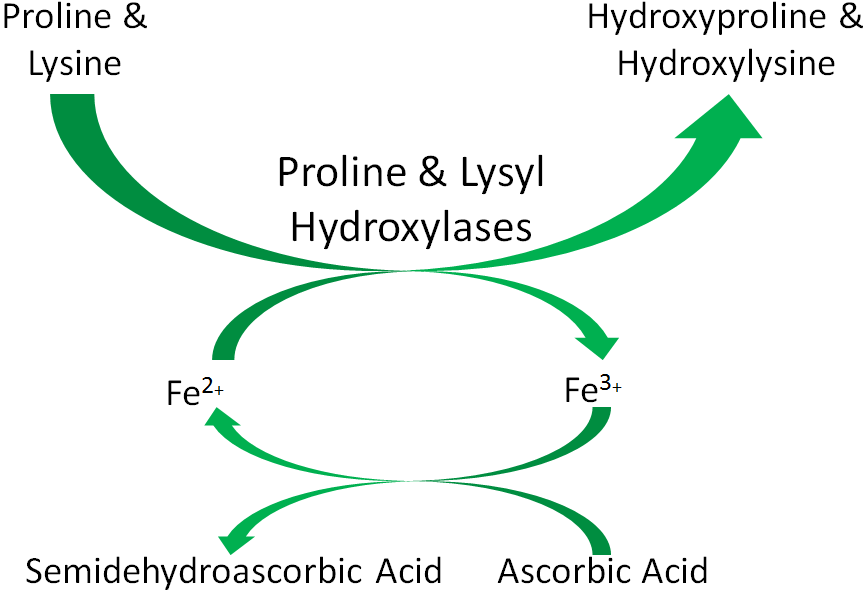
An example of a mineral that serves as a cofactor is Fe2+ for proline and lysyl hydroxylases. We will discuss later in detail why vitamin C (ascorbic acid) is needed to reduce iron to Fe2+ so that it can serve as a cofactor for proline and lysyl hydroxylases.
References & Links
- http://en.wikipedia.org/wiki/File:NAD%2B_phys.svg
- http://en.wikipedia.org/wiki/File:Flavin_adenine_dinucleotide.png
- http://en.wikipedia.org/wiki/File:NAD_oxidation_reduction.svg
- http://en.wikipedia.org/wiki/File:FAD_FADH2_equlibrium.png
6.2 Carbohydrate Metabolism Pathways
There are many metabolic pathways/cycles/processes/reactions that are involved in the synthesis or degradation of carbohydrates and compounds formed from them. Please note that most of these pathways aren’t specific to carbohydrates only. Gluconeogenesis will be covered in the protein section, because amino acids are a common substrate used for synthesizing glucose.
Carbohydrate Pathways/Cycles/Processes/Reactions:
Glycogenesis
-glycogen synthesis
Glycogenolysis
-glycogen breakdown
Gluconeogenesis
-synthesis of glucose from a non-carbohydrate source
Glycolysis
-breakdown of glucose to pyruvate
Transition Reaction
-conversion of pyruvate to acetyl-CoA
Citric Acid (Tricarboxylic acid (TCA), Kreb’s) Cycle
-acetyl-CoA combines with oxaloacetate to form citrate; ATP, NADH, and FADH2 are produced in the cycle
Electron Transport Chain
-oxidative phosphorylation, producing ATP from NADH and FADH2
Subsections:
6.21 Monosaccharide Metabolism
6.22 Glycogenesis & Glycogenolysis
6.23 Glycolysis
6.24 Transition Reaction
6.25 Citric Acid Cycle
6.26 Electron Transport Chain
6.27 Aerobic Glucose Metabolism Totals
6.28 Anaerobic Respiration
6.21 Monosaccharide Metabolism
Galactose and fructose metabolism is a logical place to begin looking at carbohydrate metabolism, before shifting focus to the preferred monosaccharide glucose. The figure below reminds you that in the liver, galactose and fructose have been phosphorylated.
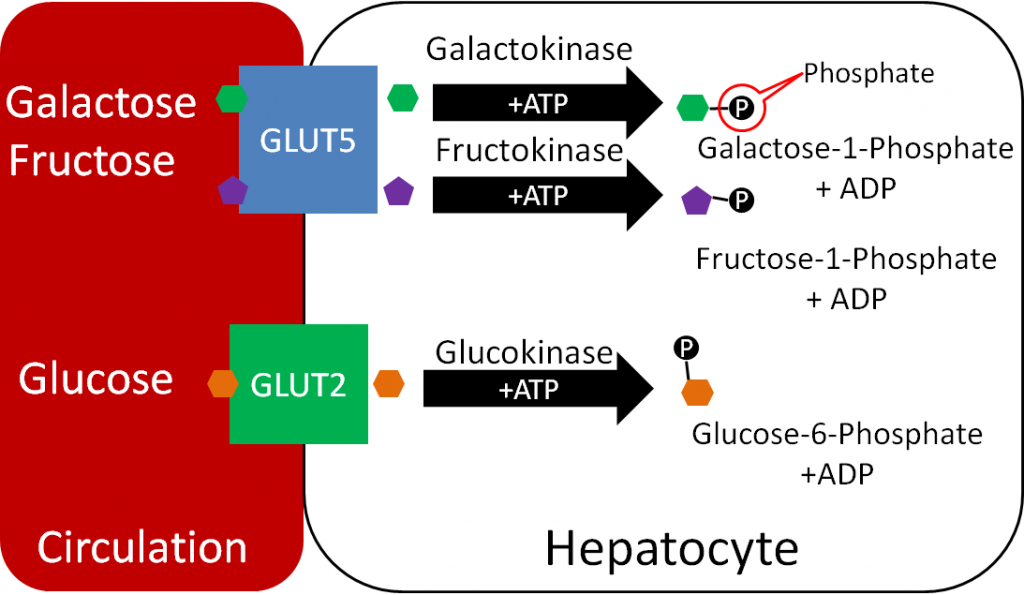
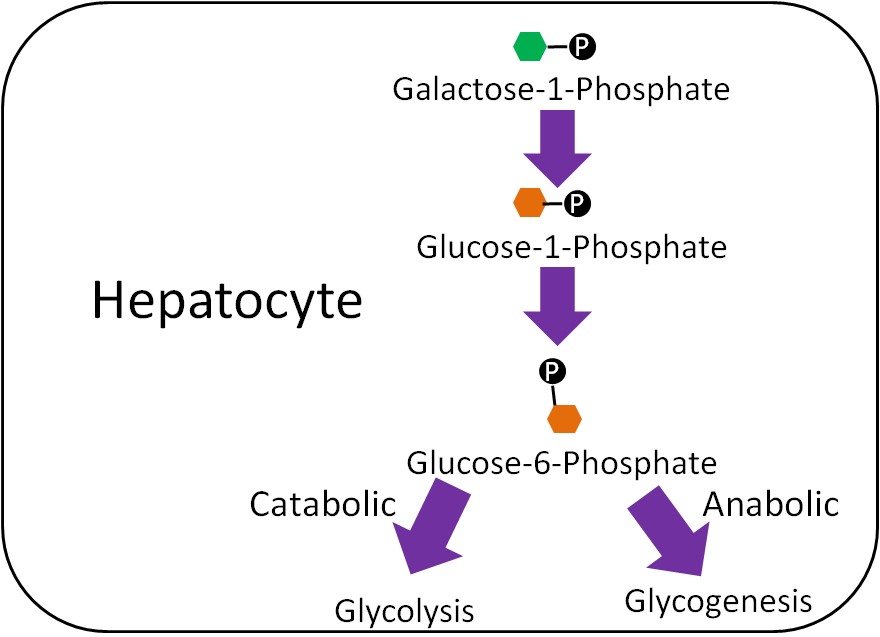
Galactose
In the liver, galactose-1-phosphate is converted to glucose-1-phosphate, before finally being converted to glucose-6-phosphate1. As shown below, glucose 6-phosphate can then be used in either glycolysis or glycogenesis, depending on the person’s current energy state.
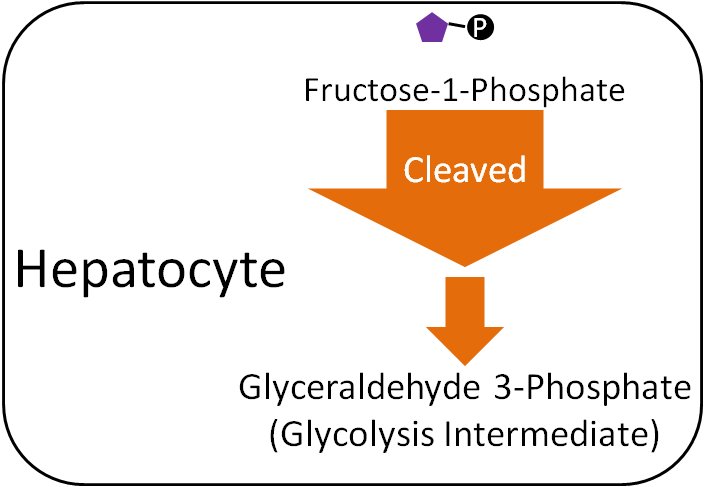
Fructose
Unlike galactose, fructose cannot be used to form phosphorylated glucose. Instead, fructose-1-phosphate is cleaved in the liver to form glyceraldehyde 3-phosphate, a glycolysis (pathway that breaks down glucose) intermediate . This occurs through multiple steps, as depicted below.
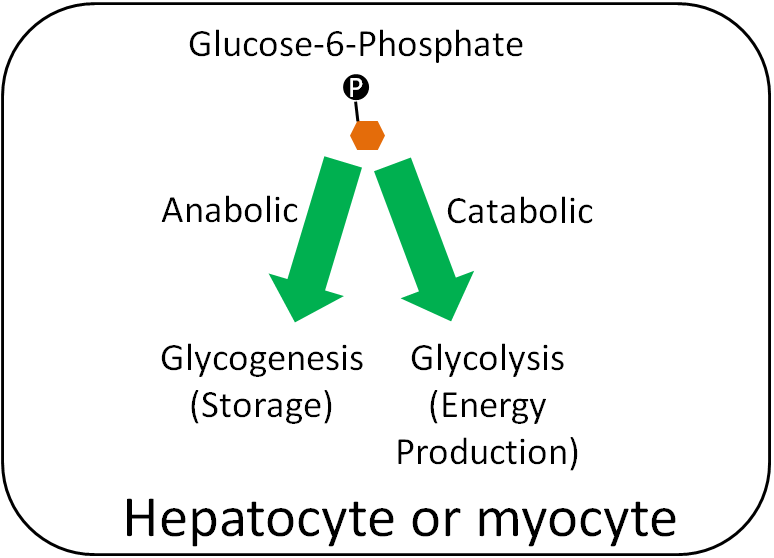
Glucose-6-Phosphate
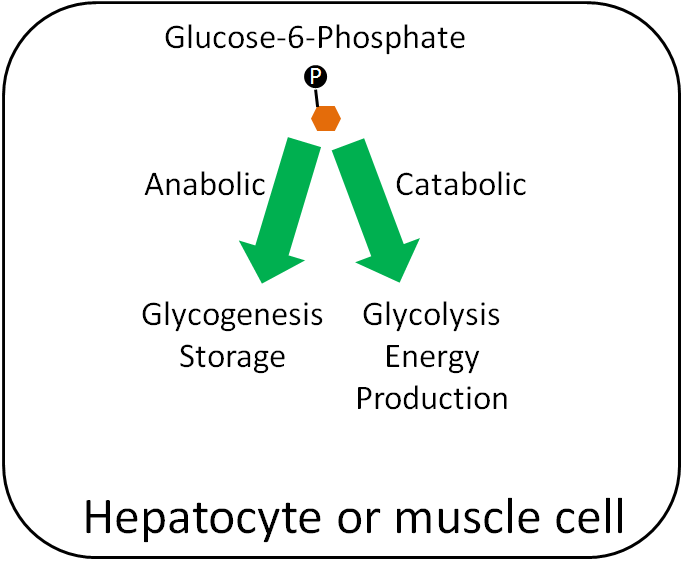
Within hepatocytes or myocytes (muscle cells), glucose-6-phosphate can be used either for glycogenesis (glycogen synthesis) or glycolysis (breakdown of glucose for energy production). If the person is in an anabolic state, they will use glucose-6-phosphate for storage. If they are in a catabolic state, they will use it for energy production.
References & Links
- Gropper SS, Smith JL, Groff JL. (2008) Advanced nutrition and human metabolism. Belmont, CA: Wadsworth Publishing.
6.22 Glycogenesis & Glycogenolysis
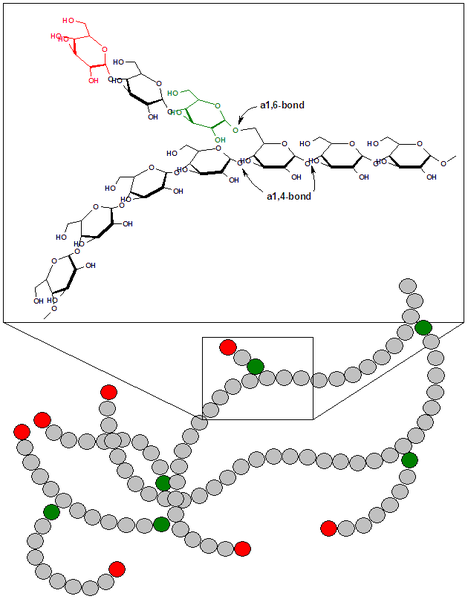
As discussed earlier, glycogen is the animal storage form of glucose. If a person is in an anabolic state, such as after consuming a meal, most glucose-6-phosphate within the myocytes (muscle cells) or hepatocytes (liver cells) is going to be stored as glycogen. The structure is shown below as a reminder.
Glycogen is mainly stored in the liver and the muscle. It makes up ~6% of the wet weight of the liver and only 1% of muscle wet weight. However, since we have far more muscle mass in our body, there is 3-4 times more glycogen stored in muscle than in the liver2. We have limited glycogen storage capacity. Thus, after a high-carbohydrate meal, our glycogen stores will reach capacity. After glycogen stores are filled, glucose will have to be metabolized in different ways for it to be stored in a different form.
Glycogenesis
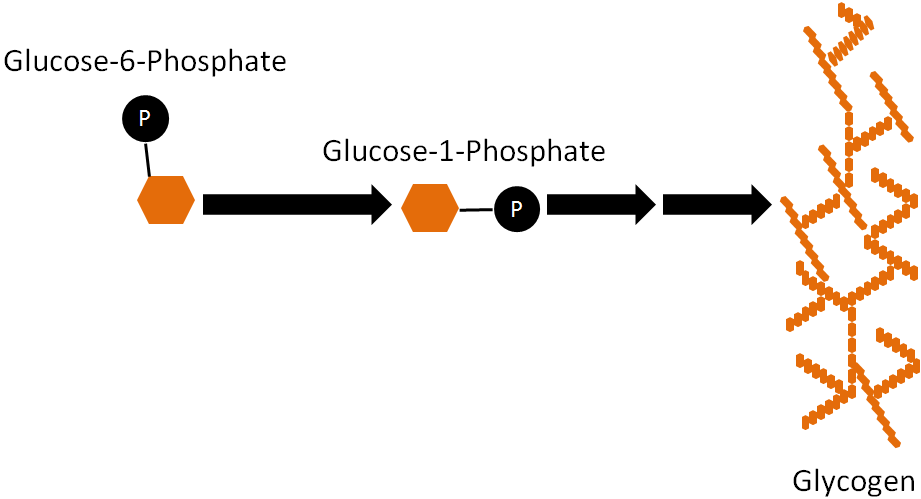
The synthesis of glycogen from glucose is a process known as glycogenesis. Glucose-6-phosphate is not inserted directly into glycogen in this process. There are a couple of steps before it is incorporated. First, glucose-6-phosphate is converted to glucose-1-phosphate and then converted to uridine diphosphate (UDP)-glucose. UDP-glucose is inserted into glycogen by either the enzyme, glycogen synthase (alpha-1,4 bonds), or the branching enzyme (alpha-1,6 bonds) at the branch points3.
Glycogenolysis
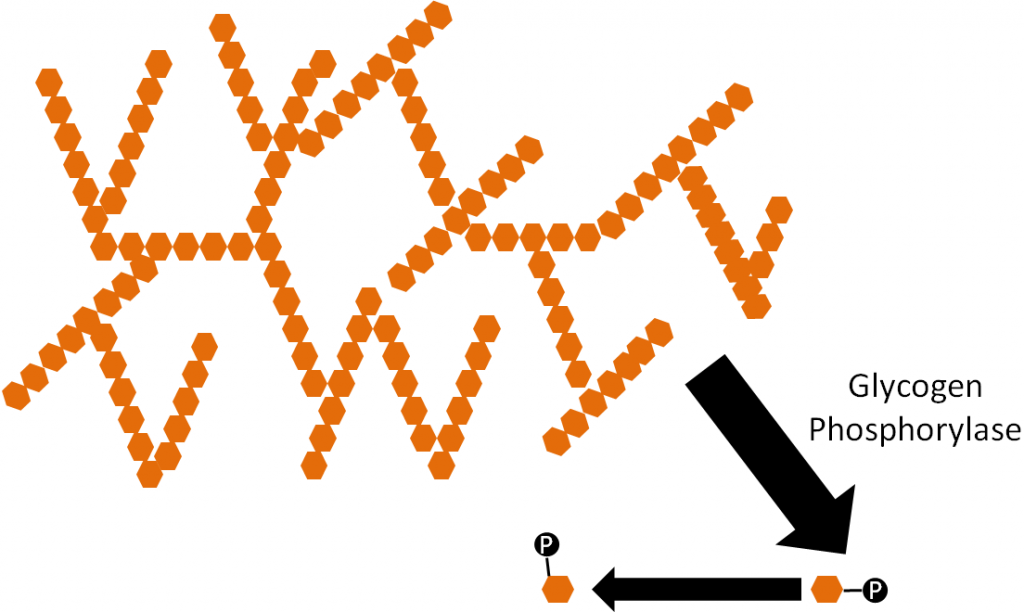
The process of liberating glucose from glycogen is known as glycogenolysis. This process is essentially the opposite of glycogenesis with two exceptions: (1) there is no UDP-glucose step, and (2) a different enzyme, glycogen phosphorylase, is involved. Glucose-1-phosphate is cleaved from glycogen by the enzyme, glycogen phosphorylase, which then can be converted to glucose-6-phosphate as shown below3.
References & Links
- http://en.wikipedia.org/wiki/File:Glycogen.png
- Shils ME, Shike M, Ross AC, Caballero B, Cousins RJ, editors. (2006) Modern nutrition in health and disease. Baltimore, MD: Lippincott Williams & Wilkins.
- Gropper SS, Smith JL, Groff JL. (2008) Advanced nutrition and human metabolism. Belmont, CA: Wadsworth Publishing.
6.23 Glycolysis
If a person is in a catabolic state or in need of energy, such as during fasting, most glucose-6-phosphate will be used for glycolysis.
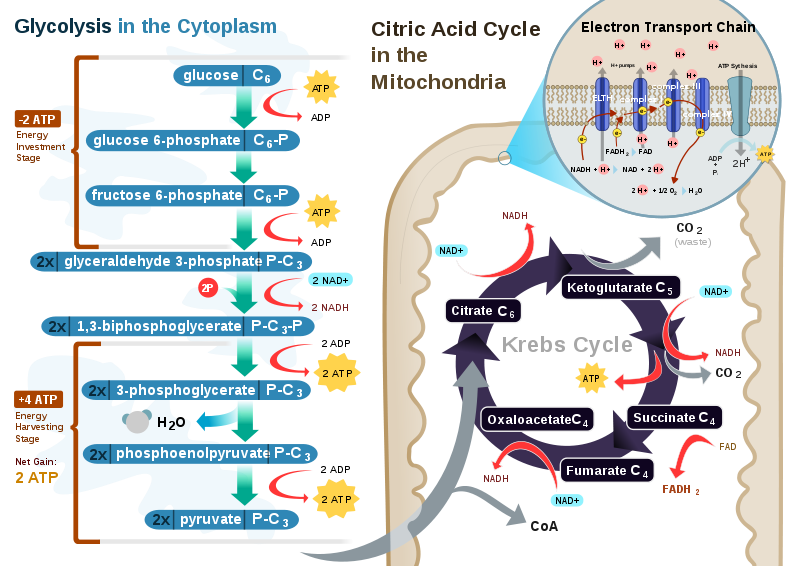
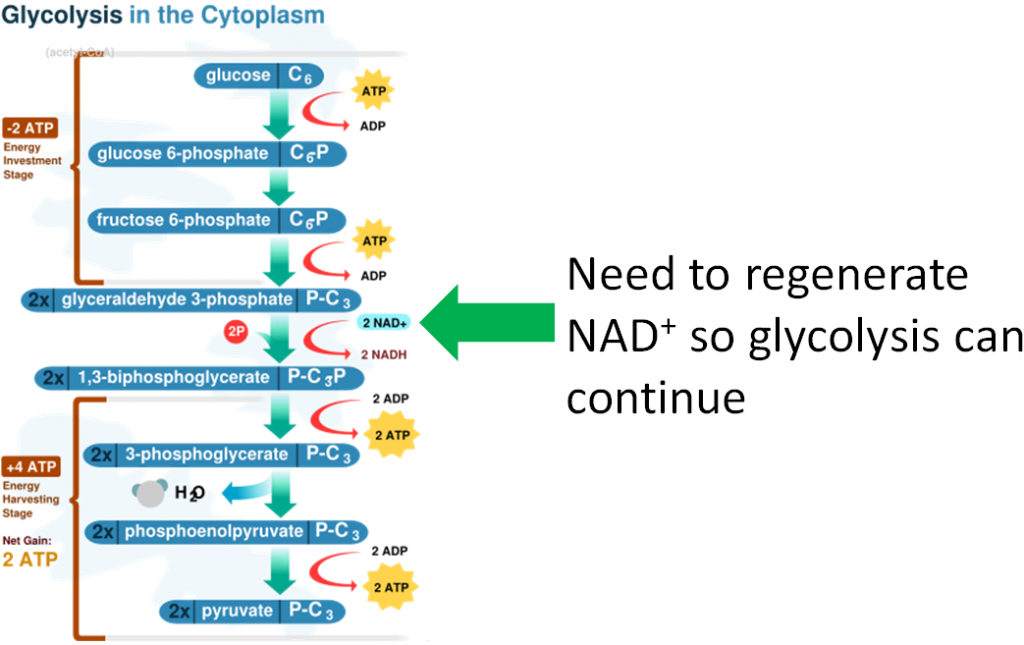
Glycolysis is the breaking down of one glucose molecule (6 carbons) into two pyruvate molecules (3 carbons). During the process, a net of two ATPs and two NADHs are also produced.
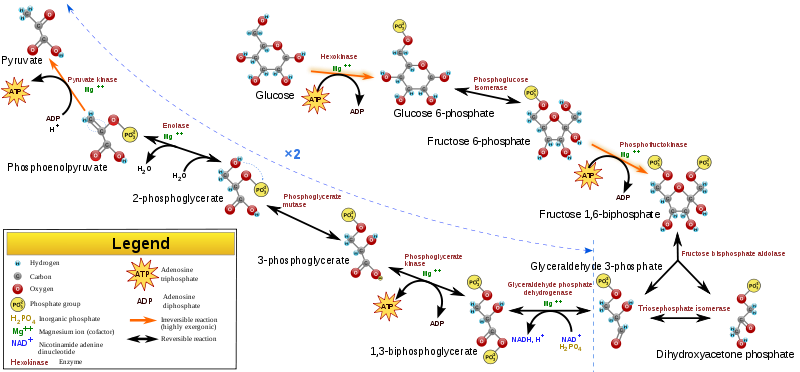
The following animation, using ball-and-stick models, allows you to control the 3 steps of glycolysis.
| Web Links |
3 steps of Glycolysis
- Energy investment step – 2 ATP are added to the 6 carbon molecule.
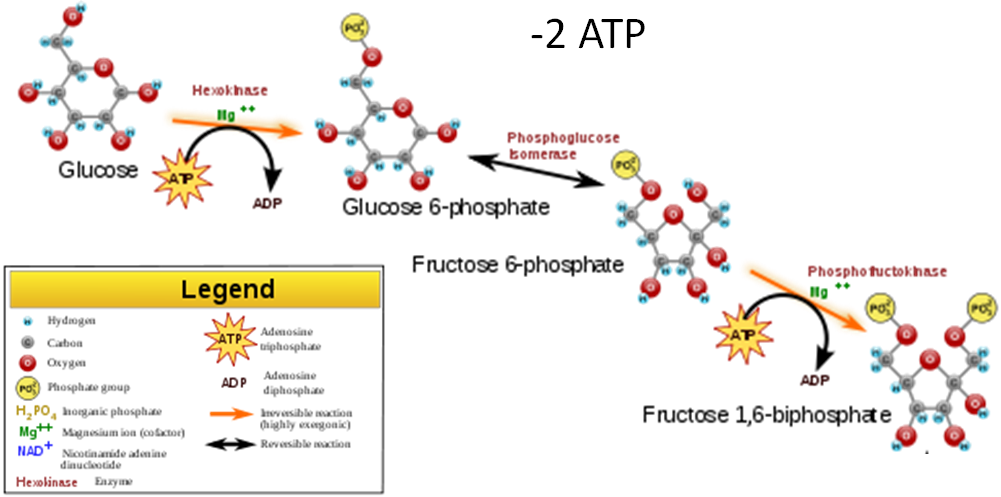
- Glucose Split – The 6 carbon molecule is split into two 3 carbon molecules.
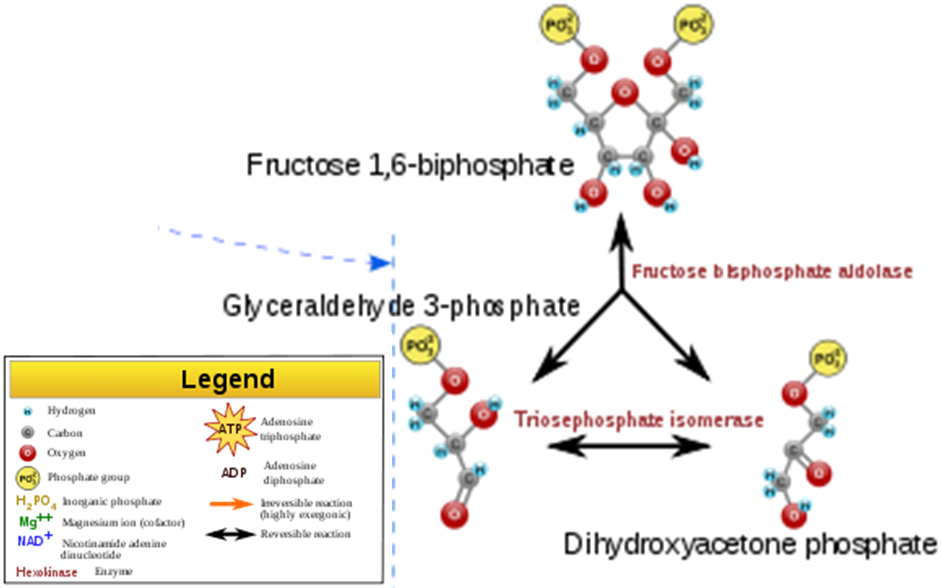
- Energy harvesting step – 1 NADH and 2 ATPs are produced from each 3 carbon molecule (there are two 3 carbon molecules formed from each glucose).
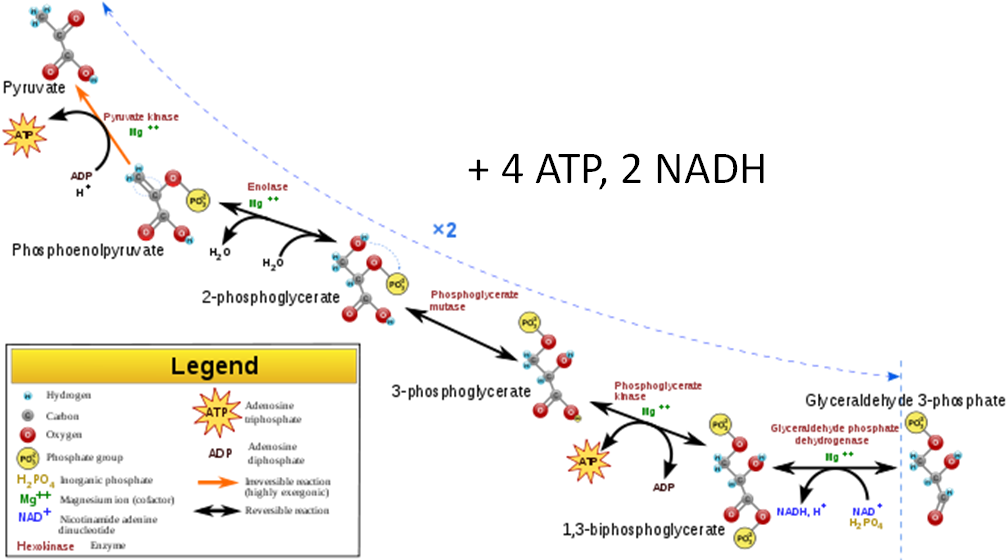
Thus, from a molecule of glucose, the harvesting step produces a total of four ATPs and two NADHs. Subtracting the harvesting from the investment step, the net output from one molecule of glucose is two ATPs and two NADHs.
The figure below shows the stages of glycolysis, as well as the transition reaction, citric acid cycle, and electron transport chain that are utilized by cells to produce energy. They are also the focus of the next 3 sections.

References & Links
- http://en.wikipedia.org/wiki/File:Glycolysis.svg
- http://en.wikipedia.org/wiki/File:CellRespiration.svg
Links
Glycolysis Animation – http://www.science.smith.edu/departments/Biology/Bio231/glycolysis.html
6.24 Transition Reaction
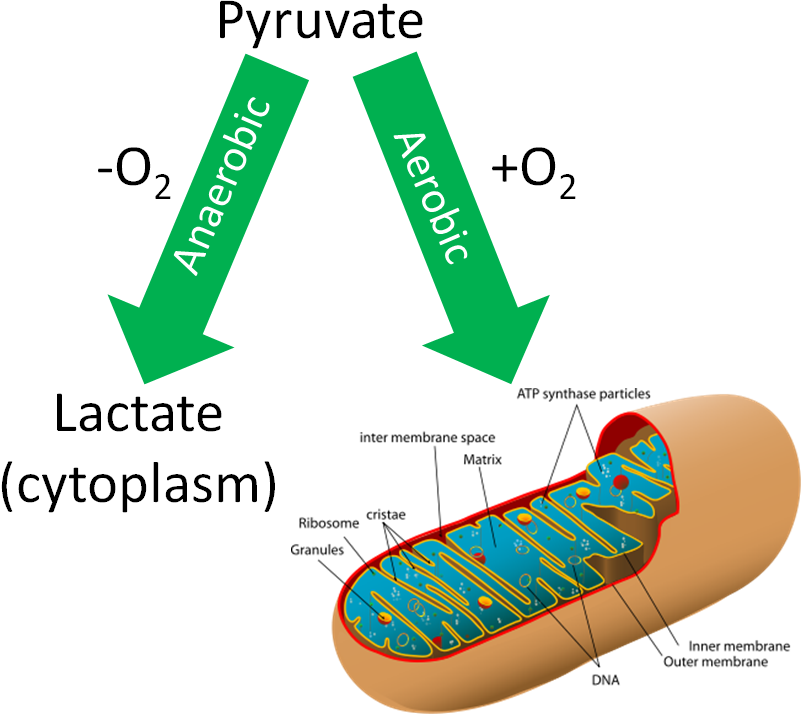
If a person is in a catabolic state, or needs energy, how pyruvate will be used depends on whether adequate oxygen levels are present. If there are adequate oxygen levels (aerobic conditions), pyruvate moves from the cytoplasm, into the mitochondria, and then undergoes the transition reaction. If there are not adequate oxygen levels (anaerobic conditions), pyruvate will instead be used to produce lactate in the cytoplasm. We are going to focus on the aerobic pathway to begin with, then we will address what happens under anaerobic conditions in the anaerobic respiration section.

The transition reaction is the transition between glycolysis and the citric acid cycle. The transition reaction converts pyruvate (3 carbons) to acetyl CoA (2 carbons), producing carbon dioxide (CO2) and a NADH as shown below. The figure below shows the transition reaction with CoA and NAD entering, and acetyl-CoA, CO2, and NADH being produced.
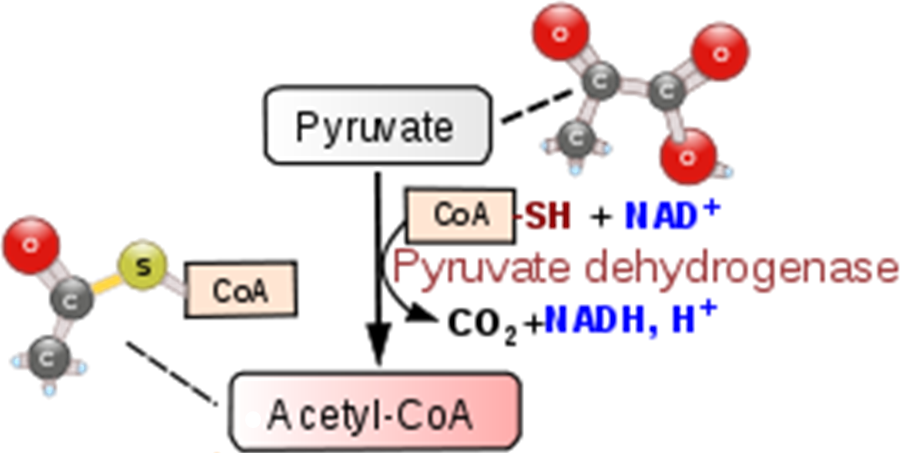
The acetyl is combined with coenzyme A (CoA) to form acetyl-CoA. The structure of CoA is shown below.

Thus, for one molecule of glucose, the transition reaction produces 2 acetyl-CoAs, 2 molecules of CO2, and 2 NADHs.
References & Links
- https://simple.wikipedia.org/wiki/Mitochondria#/media/File:Animal_mitochondrion_diagram_en_(edit).svg
- http://en.wikipedia.org/wiki/Image:Citric_acid_cycle_with_aconitate_2.svg
- http://en.wikipedia.org/wiki/Image:Coenzym_A.svg
6.25 The Citric Acid Cycle
Acetyl-CoA is a central point in metabolism, meaning there are a number of ways that it can be used. We’re going to continue to consider its use in an aerobic, catabolic state (need energy). Under these conditions, acetyl-CoA will enter the citric acid cycle (aka Krebs Cycle, TCA Cycle). The following figure shows the citric acid cycle.
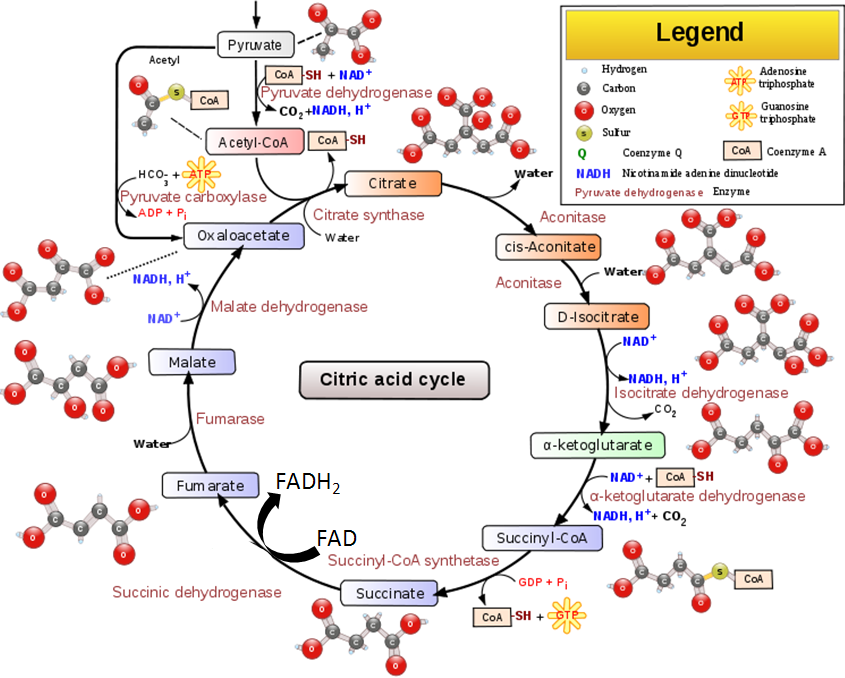
The citric acid cycle begins by acetyl-CoA (2 carbons) combining with oxaloacetate (4 carbons) to form citrate (aka citric acid, 6 carbons). A series of transformations occur before a carbon is given off as carbon dioxide and NADH is produced. This leaves alpha-ketoglutarate (5 carbons). Another carbon is given off as CO2 to form succinyl CoA (4 carbons) and produce another NADH. In the next step, one guanosine triphosphate (GTP) is produced as succinyl-CoA is converted to succinate. GTP is readily converted to ATP, thus this step is essentially the generation of 1 ATP. In the next step, an FADH2 is produced along with fumarate. Then, after more steps, another NADH is produced as oxaloacetate is regenerated.
Thus, the net output from one cycle is:
2 CO2
3 NADH
1 FADH2
1 GTP (converted to ATP)
The two carbons that are given off as CO2 originally came from acetyl-CoA.
The first video and the animation do a good job of explaining and illustrating how the cycle works. The second video is an entertaining rap about the cycle.
| Web Links
Video: Citric acid cycle (0:44) Citric acid cycle animation |
There are two acetyl-CoAs produced from one glucose, so the net from one glucose is the amount generated from two cycles:
4 CO2
6 NADH
2 FADH2
2 GTP (converted to ATP)
Through glycolysis, the transition reaction, and the citric acid cycle, multiple NADH and FADH2 molecules are produced. Under aerobic conditions, these molecules will enter the electron transport chain to be used to generate energy through oxidative phosphorylation as described in the next section.
References & Links
- http://en.wikipedia.org/wiki/Image:Citric_acid_cycle_with_aconitate_2.svg
- http://en.wikipedia.org/wiki/File:CellRespiration.svg
Link
Citric Acid Cycle Animation – http://www.wiley.com/college/boyer/0470003790/animations/tca/tca.htm
Video
Citric acid cycle – http://www.youtube.com/watch?v=hw5nWB0xN0Y
TCA (Kreb’s) Cycle Rap – http://www.youtube.com/watch?v=aMBIs_Iw0kE
6.26 Electron Transport Chain
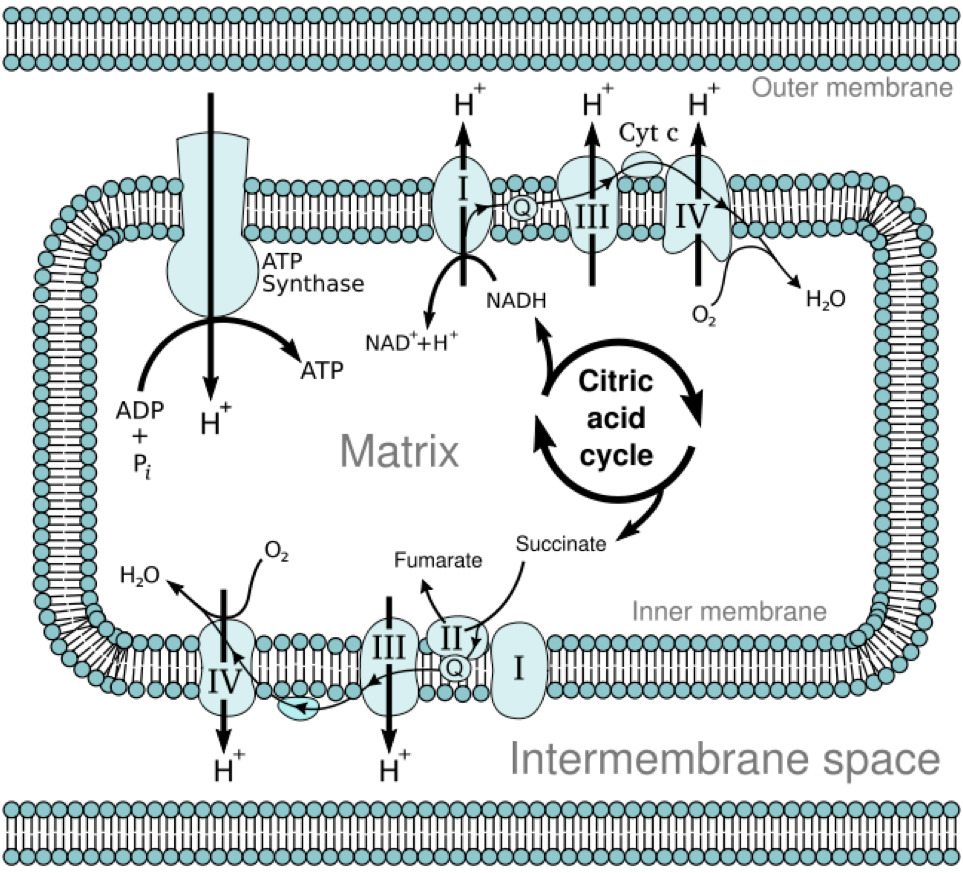
The electron transport chain is located on the inner membrane of the mitochondria, as shown below.

The electron transport chain contains a number of electron carriers. These carriers take the electrons from NADH and FADH2, pass them down the chain of complexes and electron carriers, and ultimately produce ATP. More specifically, the electron transport chain takes the energy from the electrons on NADH and FADH2 to pump protons (H+) into the intermembrane space. This creates a proton gradient between the intermembrane space (high) and the matrix (low) of the mitochondria. ATP synthase uses the energy from this gradient to synthesize ATP. Oxygen is required for this process because it serves as the final electron acceptor, forming water. Collectively this process is known as oxidative phosphorylation. The following figure and animation do a nice job of illustrating how the electron transport chain functions.
| Web Link |
2.5 ATP/NADH and 1.5 ATP/FADH2 are produced in the electron transport chain. Some resources will say 3 ATP/NADH and 2 ATP/FADH2, but these values are generally less accepted now.
For one molecule of glucose, the preceding pathways produce:
Glycolysis: 2 NADH
Transition Reaction: 2 NADH
Citric Acid Cycle: 6 NADH, 2 FADH2
Total 10 NADH, 2 FADH2
Multiply that by the amount of ATP per NADH or FADH2 to yield:
10 NADH X 2.5 ATP/NADH = 25 ATP
2 FADH2 X 1.5 ATP/FADH2 = 3 ATP
Total 28 ATP
The first video does a nice job of illustrating and reviewing the electron transport chain. Note that it uses 3 ATP/NADH and 2 ATP/FADH2 so the totals from each cycle are different from those listed above. The second video is a great rap video explaining the steps of glucose oxidation.
| Web Links
Video: Electron Transport (1:43) Video: Oxidate it or Love it/Electron to the Next One (3:23) |
References & Links
- http://en.wikipedia.org/wiki/File:CellRespiration.svg
- http://en.wikipedia.org/wiki/File:Mitochondrial_electron_transport_chain%E2%80%94Etc4.svg
Link
ETC Animation – http://www.science.smith.edu/departments/Biology/Bio231/etc.html
Videos
Electron Transport Chain – http://www.youtube.com/watch?v=1engJR_XWVU&feature=related
Oxidate it or Love it/Electron to the Next One – http://www.youtube.com/watch?v=VCpNk92uswY&feature=response_watch
6.27 Aerobic Glucose Metabolism Totals
The table below shows the ATP generated from one molecule of glucose in the different metabolic pathways.
Table. 6.271 ATP generated from one molecule of glucose.
| Metabolic Pathway | ATP Generated |
| Glycolysis | 2 |
| Citric Acid Cycle | 2 |
| Electron Transport Chain | 28 |
| Total | 32 |
Notice that the vast majority of ATP is generated by the electron transport chain. If we do the math, 28/32 X 100 = 87.5% of the ATP from a molecule of glucose is generated by the electron transport chain. Remember that this is aerobic and requires oxygen to be the final electron acceptor. If 3 ATP/NADH and 2 ATP/FADH2 are used instead of 2.5 ATP/NADH and 1.5 ATP/FADH2 that were used above, total ATP and percentage of ATP produced by the electron transport chain would be different. But the takeaway message remains the same. The electron transport chain by far produces the most ATP from one molecule of glucose.
No References
6.28 Anaerobic Respiration
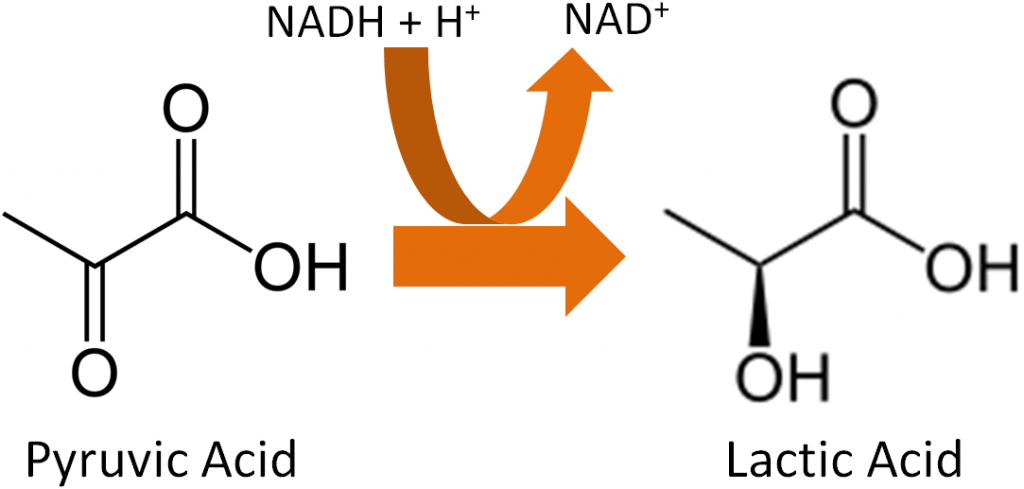
Conditions without oxygen are referred to as anaerobic. In this case, the pyruvate will be converted to lactate in the cytoplasm of the cell as shown below.
What happens if oxygen isn’t available to serve as the final electron acceptor? As shown in the following video, the ETC becomes backed up with electrons and can’t accept them from NADH and FADH2.
| Web Link |
This leads to a problem in glycolysis because NAD is needed to accept electrons, as shown below. Without the electron transport chain functioning, all NAD has been reduced to NADH and glycolysis cannot continue to produce ATP from glucose.
Thus, there is a workaround to regenerate NAD by converting pyruvate (pyruvic acid) to lactate (lactic acid) as shown below.
However, anaerobic respiration only produces 2 ATP per molecule of glucose, compared to 32 ATP for aerobic respiration. The biggest producer of lactate is the muscle. Through what is known as the Cori cycle, lactate produced in the muscle can be sent to the liver. In the liver, through a process known as gluconeogenesis, glucose can be regenerated and sent back to the muscle to be used again for anaerobic respiration forming a cycle as shown below.
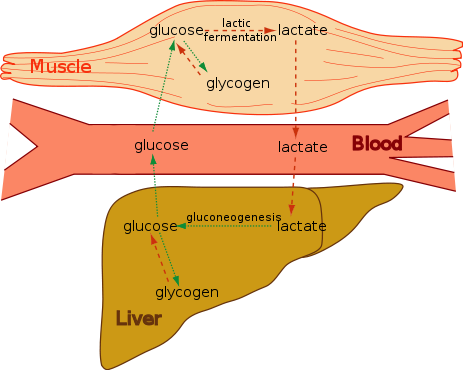
It is worth noting that the Cori cycle also functions during times of limited glucose (like fasting) to spare glucose by not completely oxidizing it.
References & Links
- https://simple.wikipedia.org/wiki/Mitochondria#/media/File:Animal_mitochondrion_diagram_en_(edit).svg
- http://en.wikipedia.org/wiki/File:CellRespiration.svg
- https://en.wikipedia.org/wiki/Pyruvic_acid#/media/File:Pyruvic-acid-2D-skeletal.png
- https://en.wikipedia.org/wiki/Lactic_acid#/media/File:Lactic-acid-skeletal.svg
- https://commons.wikimedia.org/wiki/File:CoriCycle-noLang.svg#/media/File:CoriCycle-eng.svg
Video
What happens when your run out of oxygen? – http://www.youtube.com/watch?v=StXlo1W3Gvg
6.3 Lipid Metabolism Pathways
Five lipid metabolic pathways/processes will be covered in the following subsections:
6.31 Lipolysis (Triglyceride Breakdown)
-Breakdown of triglycerides to glycerol and free fatty acids.
6.32 Fatty Acid Oxidation (Beta-Oxidation)
-Breakdown of fatty acids to acetyl-CoA
6.33 De Novo Lipogenesis (Fatty Acid & Triglyceride Synthesis)
-Synthesis of fatty acids from acetyl-CoA and esterification into triglycerides
6.34 Ketogenesis (Ketone Body Synthesis)
-Synthesis of ketone bodies from acetyl-CoA
6.35 Cholesterol Synthesis
6.31 Lipolysis (Triglyceride Breakdown)
Lipolysis is the cleavage of triglycerides to glycerol and fatty acids, as shown below.
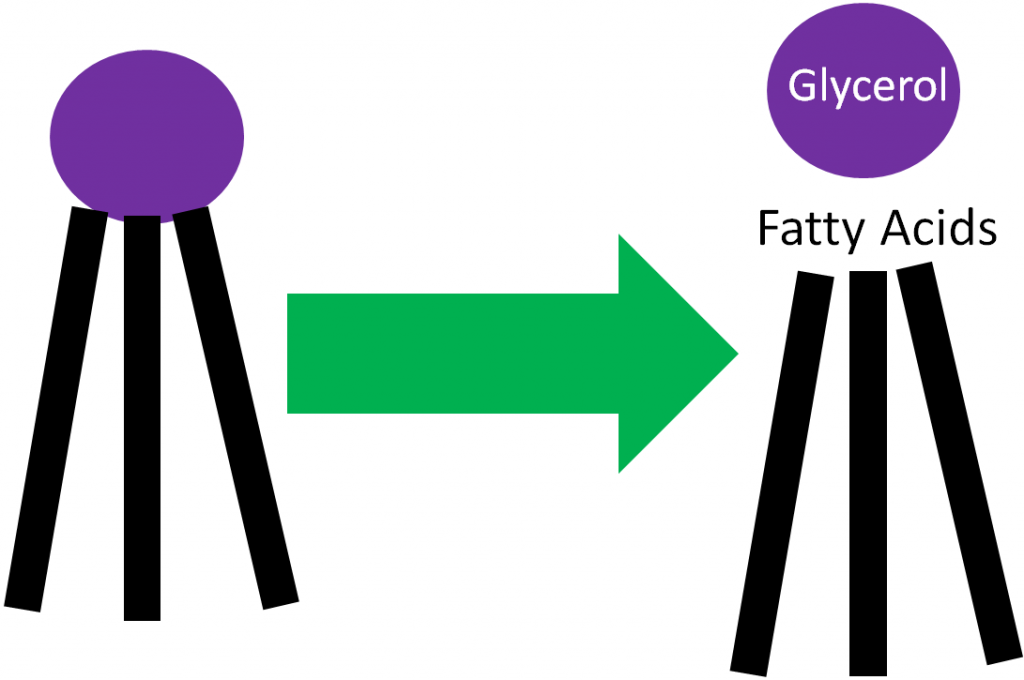
There are two primary lipolysis enzymes:
- Lipoprotein lipase (LPL)
- Hormone-sensitive lipase (HSL)
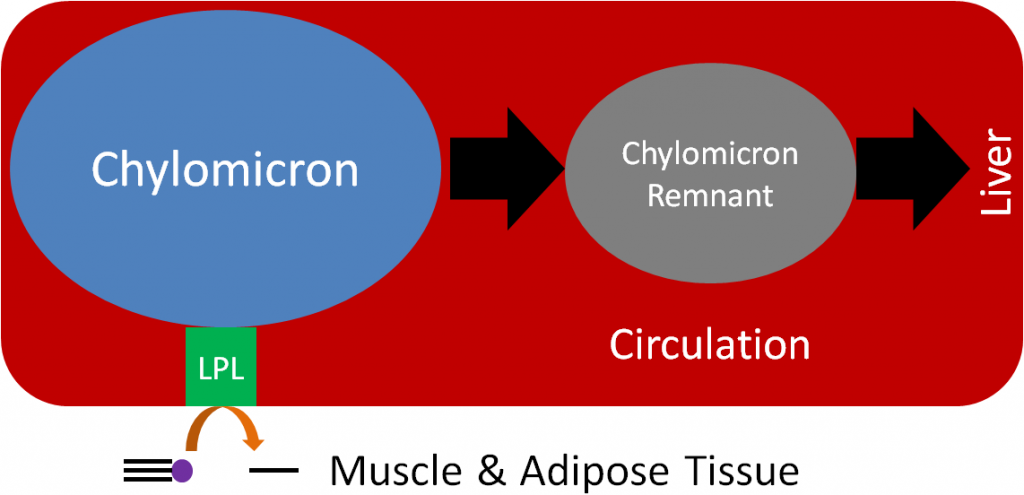
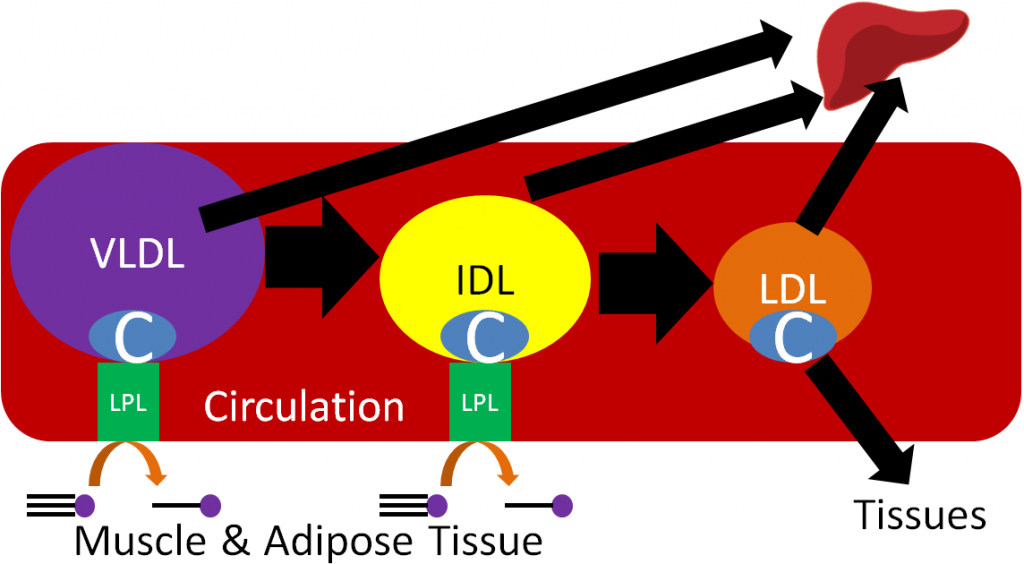
Despite performing the same function, at the adipose level, the enzymes are primarily active for seemingly opposite reasons. In the fed state, LPL on the endothelium of blood vessels cleaves lipoprotein triglycerides into fatty acids so that they can be taken up into adipocytes, for storage as triglycerides, or myocytes where they are primarily used for energy production. This action of LPL on lipoproteins is shown in the two figures below.
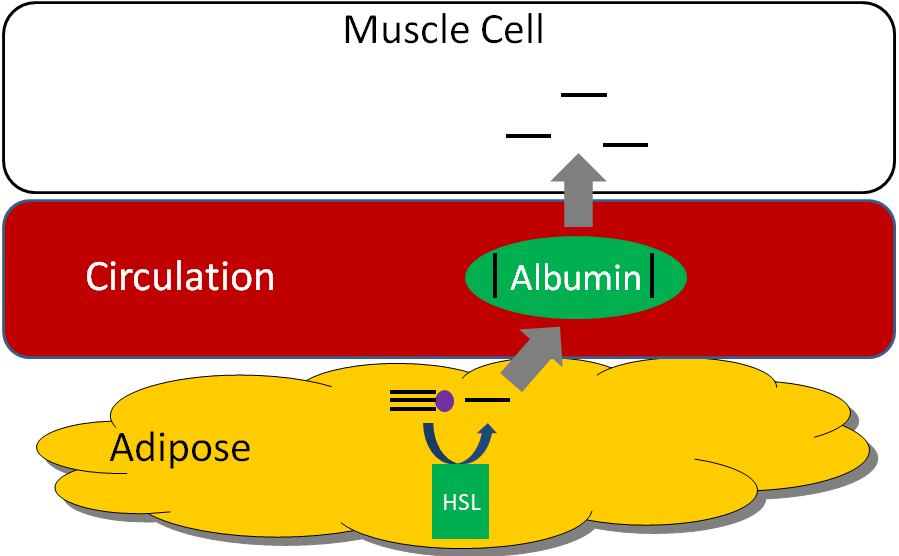
HSL is an important enzyme in adipose tissue, which is a major storage site of triglycerides in the body. HSL activity is increased by glucagon and epinephrine (“fight or flight” hormone), and decreased by insulin. Thus, in hypoglycemia (such as during a fast) or a “fight or flight” response, triglycerides in the adipose are cleaved, releasing fatty acids into circulation that then bind with the transport protein albumin. Thus, HSL is important for mobilizing fatty acids so they can be used to produce energy. The figure below shows how fatty acids can be taken up and used by tissues such as the muscle for energy production1.
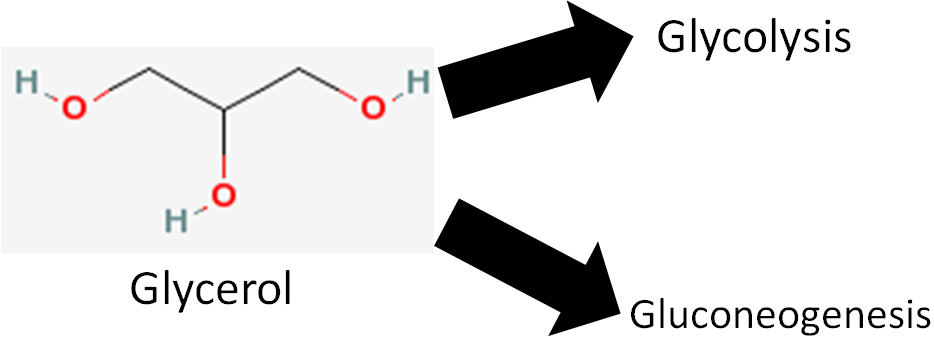
We are not going to focus on glycerol, but it does have two metabolic fates.
- It can be broken down in glycolysis
- It can be used to synthesize glucose (gluconeogenesis)
References & Links
- Byrd-Bredbenner C, Moe G, Beshgetoor D, Berning J. (2009) Wardlaw’s perspectives in nutrition. New York, NY: McGraw-Hill.
6.32 Fatty Acid Oxidation (Beta-oxidation)
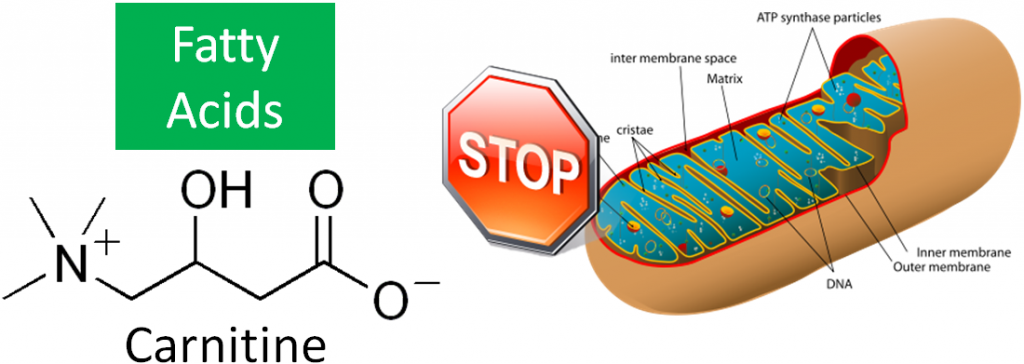
To generate energy from fatty acids, they must be oxidized. This process occurs in the mitochondria, but long chain fatty acids cannot diffuse across the mitochondrial membrane (similar to absorption into the enterocyte). Carnitine, an amino acid-derived compound, helps shuttle long-chain fatty acids into the mitochondria. The structure of carnitine is shown below.
Fatty Acid Shuttling
As shown below, there are two enzymes involved in this process: carnitine palmitoyltransferase I (CPTI) and carnitine palmitoyltransferase II (CPTII). CPTI is located on the outer mitochondrial membrane, CPTII is located on the inner mitochondrial membrane. The fatty acid is first activated by addition of a CoA (forming acyl-CoA), then CPTI adds carnitine. Acyl-Carnitine is then transported into the mitochondrial matrix with the assistance of the enzyme translocase. In the matrix, CPTII removes carnitine from the activated fatty acid (acyl-CoA). Carnitine is recycled back into the cytosol to be used again, as shown in the figure and animation below.
| Web Link |
Fatty Acid Activation
As shown below, the first step of fatty acid oxidation is activation. A CoA molecule is added to the fatty acid to produce acyl-CoA, converting ATP to AMP in the process. Note that in this step, the ATP is converted to AMP, not ADP. Thus, activation uses the equivalent of 2 ATP molecules4.
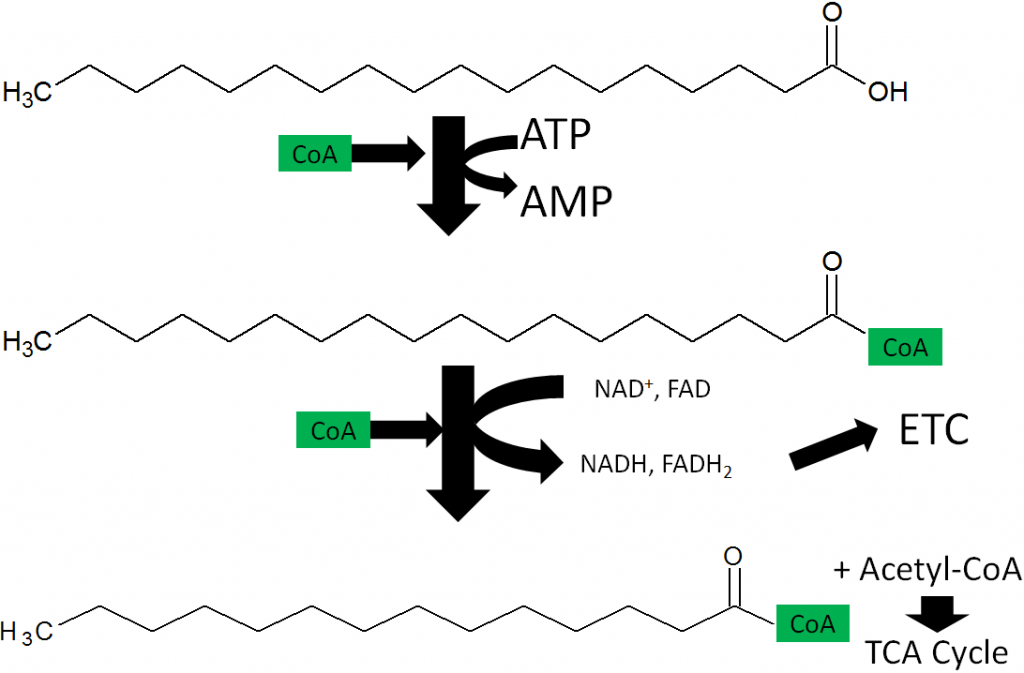
Fatty Acid Oxidation
Fatty acid oxidation is also referred to as beta-oxidation because 2 carbon units are cleaved off at the beta-carbon position (2nd carbon from the acid end) of an activated fatty acid. The cleaved 2 carbon unit forms acetyl-CoA and produces an activated fatty acid (acyl-CoA) with 2 fewer carbons, acetyl-CoA, NADH, and FADH2.
To completely oxidize the 18-carbon fatty acid above, 8 cycles of beta-oxidation have to occur. This will produce:
9 acetyl-CoAs
8 NADH
8 FADH2
Those 9 acetyl-CoAs can continue into the citric acid cycle, where they can produce:
9 GTP
9 FADH2
27 NADH
The products of the complete oxidation of a fatty acid are shown below.
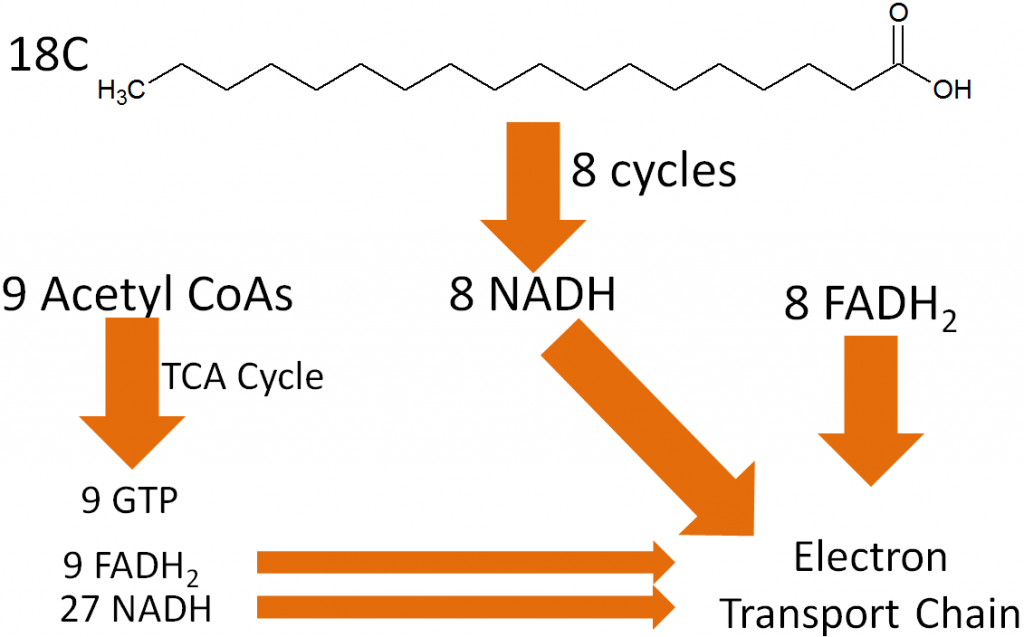
Adding up the NADH and FADH2, the electron transport chain ATP production from beta-oxidation and the citric acid cycle looks like this:
NADH
8 (beta-oxidation) + 27 (TCA) = 35 NADH X 2.5 ATP/NADH = 87.5 ATP
FADH2
8 (beta-oxidation) + 9 (TCA) = 17 FADH2 X 1.5 ATP/FADH2 = 25.5 ATP
GTP
9 GTP = 9 ATP
Total ATP from complete oxidation of an 18 carbon fatty acid:
87.5 + 25.5 + 9 = 122 ATP
Subtract 2 ATP (ATP–>AMP) required for activation of the fatty acid:
122-2 = 120 Net ATP
Compared to glucose (32 ATP) you can see that there is far more energy stored in a fatty acid. This is because fatty acids are in a more reduced form and thus, they yield 9 kcal/g instead of 4 kcal/g like carbohydrates4.
The following animation reviews lipolysis and beta-oxidation.
| Web Link |
References & Links
- http://en.wikipedia.org/wiki/File:Carnitine_structure.png
- https://simple.wikipedia.org/wiki/Mitochondria#/media/File:Animal_mitochondrion_diagram_en_(edit).svg
- https://en.wikipedia.org/wiki/Carnitine_palmitoyltransferase_I#/media/File:Acyl-CoA_from_cytosol_to_the_mitochondrial_matrix.svg
- Berg JM, Tymoczko JL, Stryer L. (2002) Biochemistry. New York, NY: W.H. Freeman and Company.
Links
Fatty acid transfer from cytoplasm to mitochondrian – http://brookscole.cengage.com/chemistry_d/templates/student_resources/shared_resources/animations/carnitine/carnitine1.html
Fatty Acid Metabolism – http://www.wiley.com/legacy/college/boyer/0470003790/animations/fatty_acid_metabolism/fatty_acid_metabolism.htm
6.33 De novo Lipogenesis (Fatty Acid Synthesis)
De novo in Latin means “from the beginning.” Thus, de novo lipogenesis is the synthesis of fatty acids, beginning with acetyl-CoA. Acetyl-CoA has to first move out of the mitochondria, where it is then converted to malonyl-CoA (3 carbons). Malonyl-CoA then is combined with another acetyl-CoA to form a 4 carbon fatty acid (1 carbon is given off as CO2). The addition of 2 carbons is repeated through a similar process 7 times to produce a 16 carbon fatty acid1.
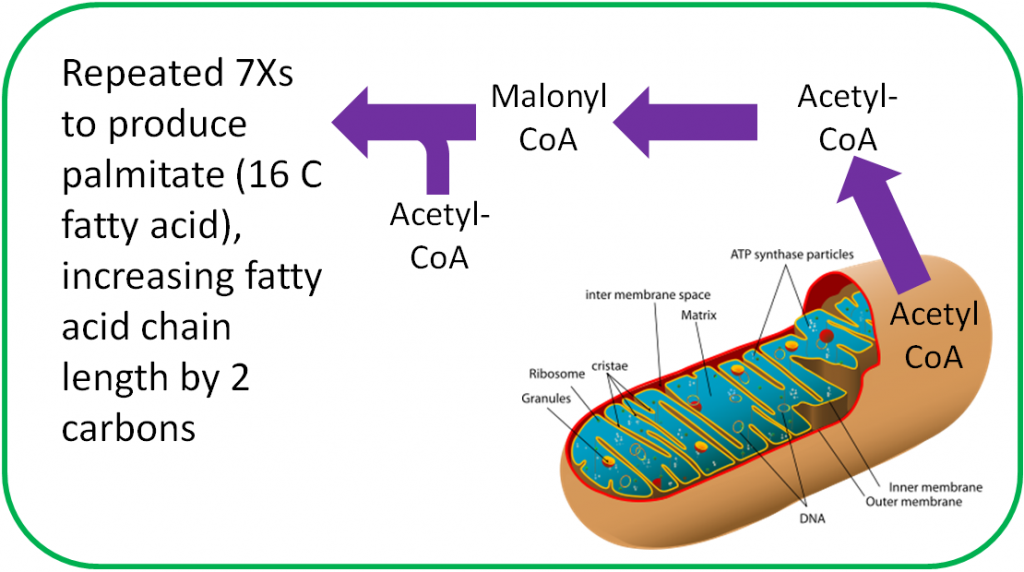
Most fatty acids synthesized will be esterified into triglycerides for storage.
References
- Gropper SS, Smith JL, Groff JL. (2008) Advanced nutrition and human metabolism. Belmont, CA: Wadsworth Publishing.
- http://en.wikipedia.org/wiki/Mitochondrion
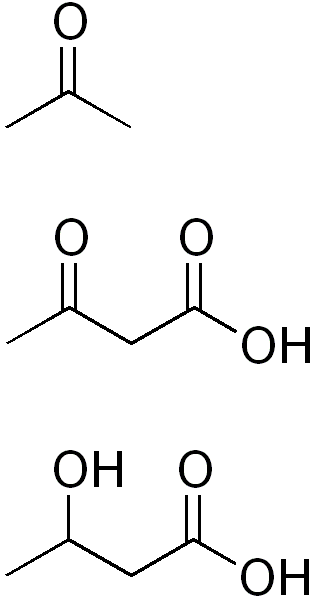
6.34 Ketone Body Synthesis
In cases where there is not enough glucose available for the brain (very low carbohydrate diets, starvation), the liver can use acetyl-CoA, primarily from fatty acids (but also certain amino acids), to synthesize ketone bodies (ketogenesis). The structures of the three ketone bodies; acetone, acetoacetic acid, and beta-hydroxybutyric acid, are shown below.
After they are synthesized in the liver, ketone bodies are released into circulation where they can travel to the brain. The brain converts the ketone bodies to acetyl-CoA that can then enter the citric acid cycle for ATP production, as shown below.
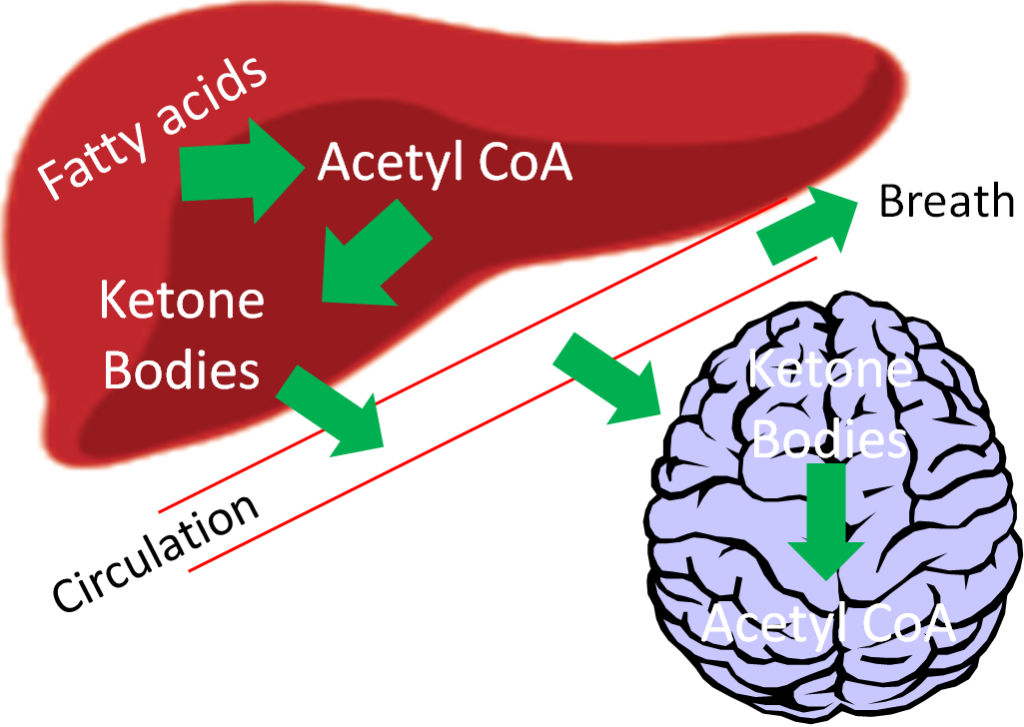
If there are high levels of ketones secreted, it results in a condition known as ketosis or ketoacidosis. The high level of ketones in the blood decreases the blood’s pH, meaning it becomes more acidic. It is debatable whether mild ketoacidosis is harmful, but severe ketoacidosis can be lethal. One symptom of this condition is fruity or sweet smelling breath, which is due to increased acetone exhalation.
References & Links
- http://en.wikipedia.org/wiki/File:Ketone_bodies.png
- http://commons.wikimedia.org/wiki/File:Liver.svg
6.35 Cholesterol Synthesis
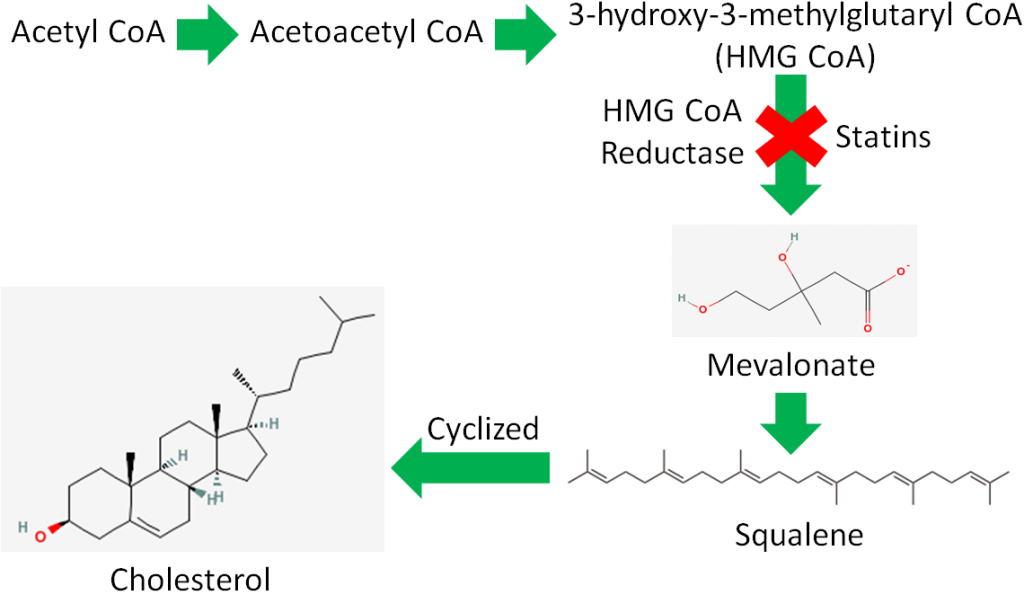
Acetyl-CoA is also used to synthesize cholesterol. As shown below, there are a large number of reactions and enzymes involved in cholesterol synthesis.
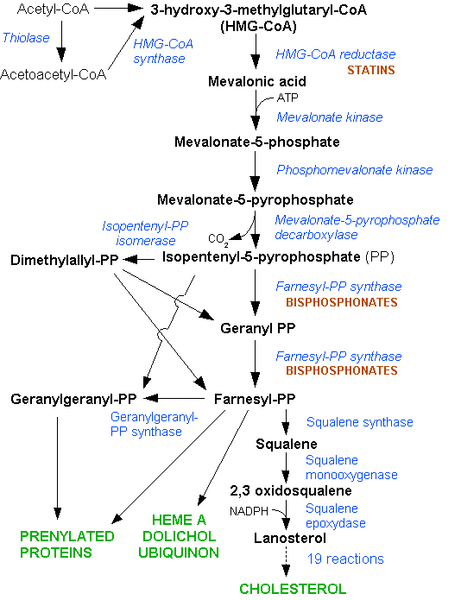
Simplifying this, acetyl-CoA is converted to acetoacetyl-CoA (4 carbons) before forming 3-hydroxy-3-methylglutaryl-CoA (HMG-CoA). HMG-CoA is converted to mevalonate by the enzyme HMG-CoA reductase. This enzyme is important because it is the rate-limiting enzyme in cholesterol synthesis.
A rate-limiting enzyme is like a bottleneck in a highway, as shown below, that determines the flow of traffic past it.
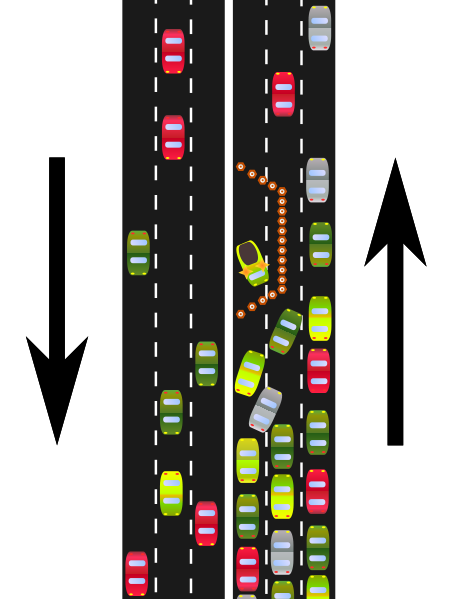
Rate-limiting enzymes limit the rate at which a metabolic pathway proceeds. The pharmaceutical industry has taken advantage of this knowledge to lower people’s LDL levels with drugs known as statins. These drugs inhibit HMG-CoA reductase and thus decrease cholesterol synthesis. Less cholesterol leads to lower LDL levels, and hopefully a lower risk of cardiovascular disease.
The brand name of the statins approved for use in the US are4:
Lipitor
Lescol
Mevacor
Pravachol
Crestor
Zocor
Livalo
The cholesterol guidelines have changed dramatically from the previous focus on LDL and HDL target levels. Now statins are prescribed at set therapeutic doses based on assessed cardiovascular risk rather than based off LDL and HDL target levels. It is also recommended that only statins that have been shown to decrease cardiovascular disease risk be used, some have only been shown to improve LDL/HDL levels. The link below is to the online calculator that can be used to estimate individual’s risk. The third link talks about a drug that was effective at lowering LDL, increasing HDL, but did not improve cardiovascular disease outcomes. This finding is consistent with the new cholesterol guidelines deemphasizing HDL and LDL target levels. The fourth link below describes some new cholesterol lowering drugs, which have shown some promising preliminary results.
| Web Link |
The body synthesizes approximately 1 gram of cholesterol a day, whereas it is recommended that we consume less than 0.3 gram a day. A number of tissues synthesize cholesterol, with the liver accounting for ~20% of synthesis. The intestine is believed to be the most active among the other tissues that are responsible for the other 80% of cholesterol synthesis5.
References & Links
- https://en.wikipedia.org/wiki/Statin#/media/File:HMG-CoA_reductase_pathway.png
- http://en.wikipedia.org/wiki/File:Squalene.svg
- http://en.wikipedia.org/wiki/File:Bottleneck.svg
- http://www.medicinenet.com/statins/page3.htm
- Gropper SS, Smith JL, Groff JL. (2008) Advanced nutrition and human metabolism. Belmont, CA: Wadsworth Publishing.
Links
Check.Change.Control Heart Attack & Stroke Risk Calculator – https://ccccalculator.ccctracker.com/
6.4 Protein Metabolism
Section 2.22 described how proteins are synthesized. Thus, this section will focus on how proteins and amino acids are broken down. There are four protein metabolic pathways that will be covered in this section:
Transamination
-transfer of an amino group from one amino acid to another
Deamination
-removal of an amino group, normally from an amino acid.
Gluconeogenesis
-synthesis of glucose from a non-carbohydrate source.
Protein Turnover/Degradation
-liberation of amino acids from proteins.
Subsections:
6.41 Transamination, Deamination, & Ammonia Removal as Urea
6.42 Gluconeogenesis
6.43 Protein Turnover/Degradation
6.41 Transamination, Deamination & Ammonia Removal as Urea
The first step in catabolizing, or breaking down, an amino acid is the removal of its amine group (-NH3). Amine groups can be transferred or removed through transamination or deamination, respectively.
Transamination
Transamination is the transfer of an amine group from an amino acid to a keto acid (amino acid without an amine group), thus creating a new amino acid and keto acid as shown below.

Keto acids and/or carbon skeletons are what remains after amino acids have had their nitrogen group removed by deamination or transamination. Transamination is used to synthesize nonessential amino acids.
Deamination
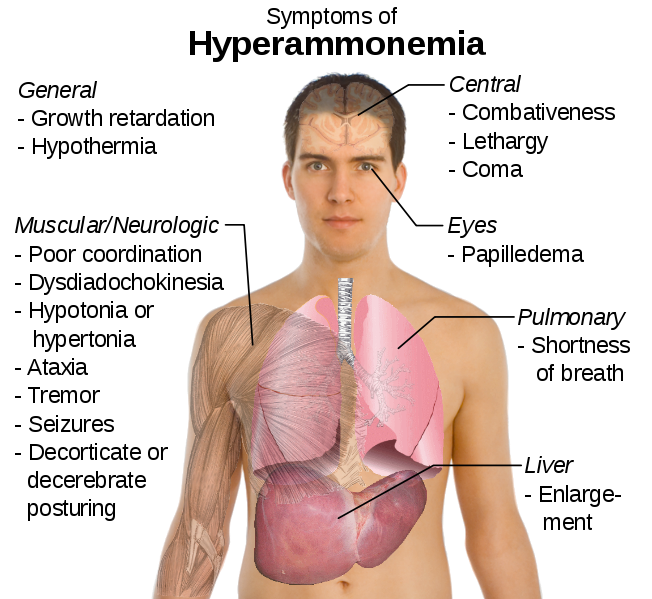
Deamination is the removal of the amine group as ammonia (NH3), as shown below.

The potential problem with deamination is that too much ammonia is toxic, causing a condition known as hyperammonemia. The symptoms of this condition are shown in the following figure.
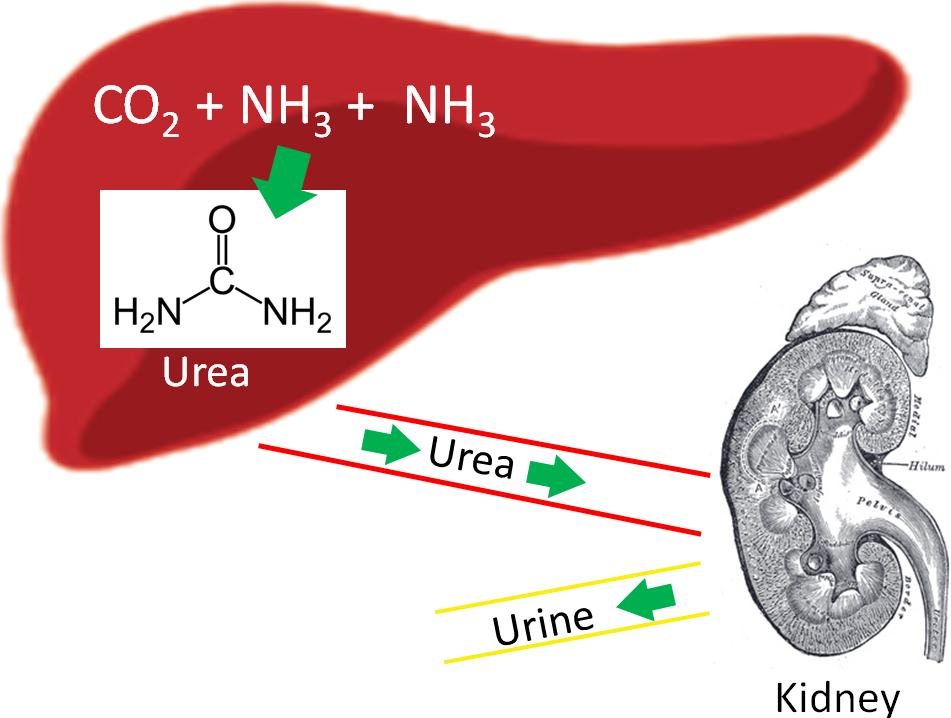
Our body has a method to safely package ammonia in a less toxic form to be excreted. This safer compound is urea, which is produced by the liver using 2 molecules of ammonia (NH3) and 1 molecule of carbon dioxide (CO2). Most urea is then secreted from the liver and incorporated into urine in the kidney to be excreted from the body, as shown below.
References
- http://en.wikipedia.org/wiki/File:Transaminierung.svg
- http://en.wikipedia.org/wiki/File:DesaminierungCtoU.png
- http://en.wikipedia.org/wiki/File:Symptoms_of_hyperammonemia.svg
- http://commons.wikimedia.org/wiki/File:Liver.svg
- http://upload.wikimedia.org/wikipedia/commons/b/b0/Kidney_section.jpg
- http://en.wikipedia.org/wiki/File:Urea.png
6.42 Gluconeogenesis
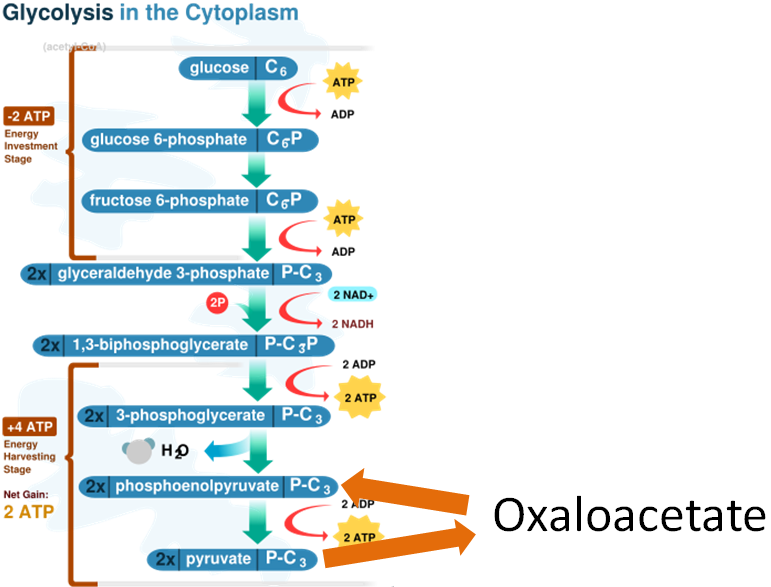
Gluconeogenesis is the synthesis of glucose from noncarbohydrate sources. Certain amino acids can be used for this process, which is the reason that this section is included here instead of the carbohydrate metabolism section. Gluconeogenesis is glycolysis in reverse with an oxaloacetate workaround, as shown below. Remember oxaloacetate is also an intermediate in the citric acid cycle.
Not all amino acids can be used for gluconeogenesis. The ones that can be used are termed glucogenic (red), and can be converted to either pyruvate or a citric acid cycle intermediate. Other amino acids can only be converted to either acetyl-CoA or acetoacetyl-CoA, which cannot be used for gluconeogenesis. However, acetyl-CoA or acetoacetyl-CoA can be used for ketogenesis to synthesize the ketone bodies, acetone and acetoacetate. Thus, these amino acids are instead termed ketogenic (green).
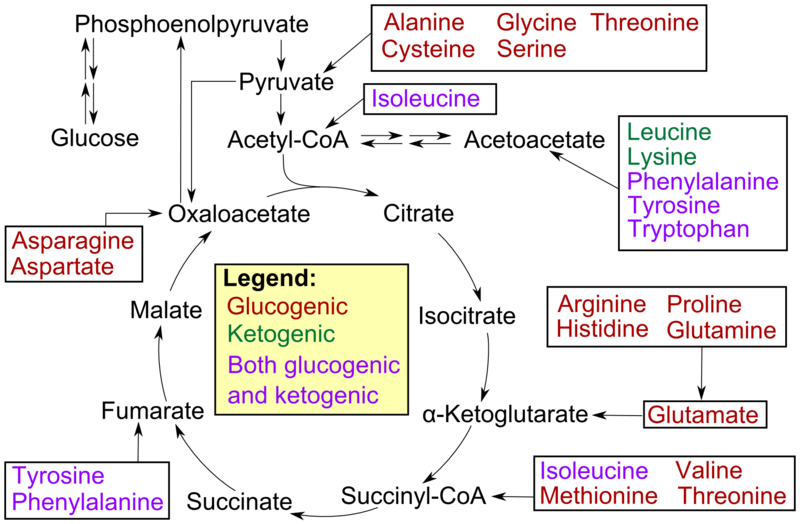
Fatty acids and ketogenic amino acids cannot be used to synthesize glucose. The transition reaction is a one-way reaction, meaning that acetyl-CoA cannot be converted back to pyruvate. As a result, fatty acids can’t be used to synthesize glucose, because beta-oxidation produces acetyl-CoA. Even if acetyl-CoA enters the citric acid cycle, the carbons from it will eventually be completely oxidized and given off as CO2. The net result is that these carbons are not readily available to serve as keto-acids or carbon skeletons for amino acid synthesis. Some amino acids can be either glucogenic or ketogenic, depending on how they are metabolized. These amino acids are referred to as glucogenic and ketogenic (pink).
References
- http://en.wikipedia.org/wiki/File:CellRespiration.svg
- http://en.wikipedia.org/wiki/File:Amino_acid_catabolism.png
6.43 Protein Turnover/Degradation
Proteins serve a number of functions in the body, but what happens when cells, enzymes, etc. have completed their lifespan? They are recycled.
Proteins are broken down to amino acids that can be used to synthesize new proteins. There are 3 main systems of protein degradation:
- Ubiquitin-proteasome degradation
- Lysosome degradation
- Calpain degradation
- Ubiquitin-Proteasome Degradation
Proteins that are damaged or abnormal are tagged with the protein ubiquitin. There are multiple protein subunits involved in the process (E1-E3), but the net result is the production of a protein (substrate) with a ubiquitin tail, as shown below.
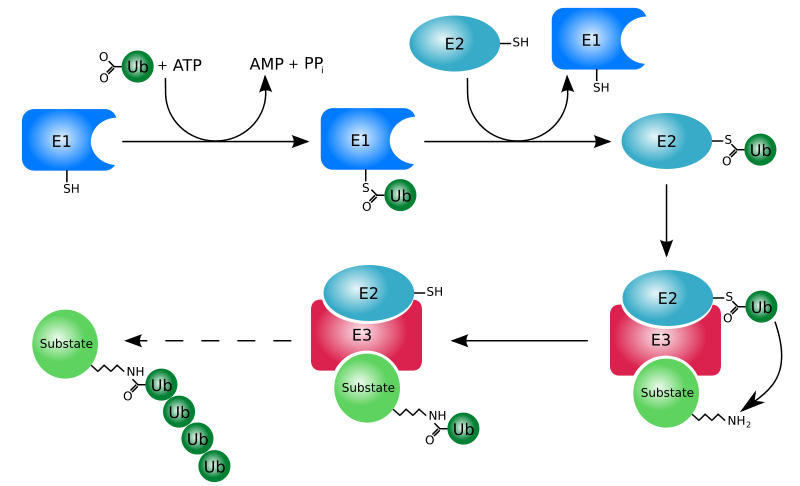
This protein then moves to the proteasome for degradation. Think of the proteasome like a garbage disposal. The ubiquitinated “trash” protein is inserted into the garbage disposal where it is broken down into its component parts (primarily amino acids). The following video illustrates this process nicely.
| Web Link |
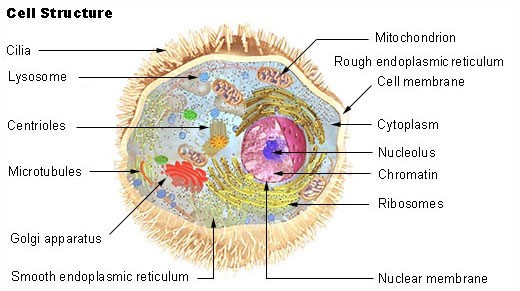
- Lysosome Degradation
The lysosomes are organelles that are found in cells. They contain a number of proteases that degrade proteins.
- Calpain Degradation
The last degradation system is the calpain system, which is not as well understood, but does require calcium.
References & Links
- http://en.wikipedia.org/wiki/File:Recycling_symbol.svg
- http://en.wikipedia.org/wiki/File:Ubiquitylation.svg
- http://en.wikipedia.org/wiki/File:Illu_cell_structure.jpg
Video
Proteasome Degradation – https://www.youtube.com/watch?v=w2Qd6v-4IIc
6.5 Alcohol Metabolism
The other energy source is alcohol. The alcohol we consume contains two carbons and is known as ethanol.

Ethanol is passively absorbed by simple diffusion into the enterocyte. Ethanol metabolism occurs primarily in the liver, but 10-30% is estimated to occur in the stomach2. For the average person, the liver can metabolize the amount of ethanol in one drink (1/2 ounce) per hour3. There are three ways that alcohol is metabolized in the body.
- Catalase – an enzyme that we will cover again in the antioxidants section. Catalase is estimated to metabolize less than 2% of ethanol, so it is not shown below or discussed further4.
- Alcohol dehydrogenase (ADH) – This is the major ethanol-metabolizing enzyme that converts ethanol and NAD to acetaldehyde and NADH, respectively. Aldehyde dehydrogenase (ALDH) uses NAD, CoA, and acetaldehyde to create acetyl-CoA and to produce another NADH. The action of ADH is shown in the figure below.
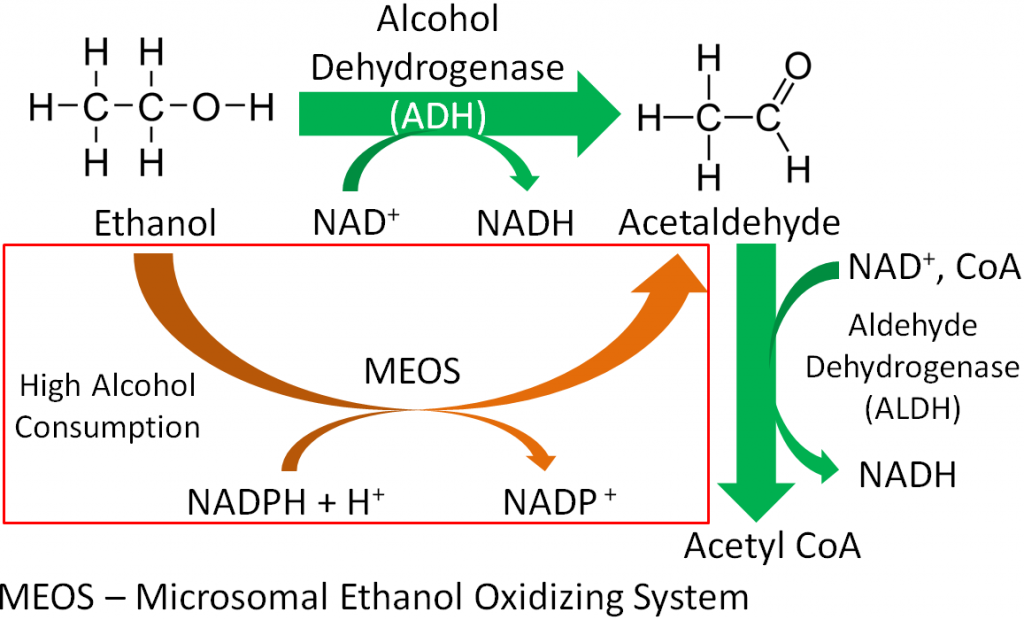
- Microsomal ethanol oxidizing system (MEOS) – When a person consumes a large amount of alcohol the MEOS, is the overflow pathway, that also metabolizes ethanol to acetaldehyde. It is estimated that the MEOS metabolizes 20% of ethanol3, and it differs from ADH in that it uses ATP to convert reduced nicotinamide adenine dinucleotide phosphate (NADPH + H+) to NADP+. The action of the MEOS is shown in the figure above.
At high intakes or with repeated exposure, there is increased synthesis of MEOS enzymes resulting in more efficient metabolism, also known as increased tolerance. ADH levels do not increase based on alcohol exposure. MEOS also metabolizes a variety of other compounds (drugs, fatty acids, steroids) and alcohol competes for the enzyme’s action. This can cause the metabolism of drugs to slow and potentially reach harmful levels in the body3.
Females have lower stomach ADH activity and body H2O concentrations. As a result, a larger proportion of ethanol reaches circulation, thus, in general, females have a lower tolerance for alcohol. About 50% of Taiwanese, Han Chinese, and Japanese populations have polymorphisms in ALDH which cause the enzyme to have low activity6. This leads to buildup of acetaldehyde and undesirable symptoms such as: flushing, dizziness, nausea, and headaches2. The following short video explains what happens when the MEOS system gets involved in alcohol metabolism.
| Web Link |
References & Links
- http://en.wikipedia.org/wiki/File:Ethanol_flat_structure.png
- Byrd-Bredbenner C, Moe G, Beshgetoor D, Berning J. (2009) Wardlaw’s perspectives in nutrition. New York, NY: McGraw-Hill.
- Whitney E, Rolfes SR. (2008) Understanding nutrition. Belmont, CA: Thomson Wadsworth.
- Gropper SS, Smith JL, Groff JL. (2008) Advanced nutrition and human metabolism. Belmont, CA: Wadsworth Publishing.
- https://en.wikipedia.org/wiki/Acetaldehyde#/media/File:Acetaldehyde-2D-flat.svg
- Zakhari, S. (2006) Overview: How Is Alcohol Metabolized by the Body? (2006) Alcohol Research and Health. 29 (4) 245-254.
Video
MEOS Overflow Pathway – http://nutrition.jbpub.com/resources/animations.cfm?id=20&debug=0
