Main Body
Macronutrient Uptake, Absorption & Transport
The term absorption can have a number of different meanings. Not everything that is taken up into the enterocyte from the lumen will be absorbed, so the term uptake refers to compounds being transported into the enterocyte. Absorption means that a compound is transported from the enterocyte into circulation. Under most circumstances, compounds that are taken up will then be absorbed. After this chapter, hopefully this distinction between these terms will be clear. After later micronutrient chapters, hopefully you will understand the reason for emphasizing this distinction.
Sections:
4.1 Crypts of Lieberkuhn & Enterocyte Maturation
4.2 Absorptive Lineup & Cell Membranes
4.3 Types of Cell Uptake/Transport
4.4 Carbohydrate Uptake, Absorption, Transport & Liver Uptake
4.5 Protein Uptake, Absorption, Transport & Liver Uptake
4.6 Lipid Uptake, Absorption & Transport
4.7 Glycemic Response, Insulin & Glucagon
4.1 Crypts of Lieberkuhn & Enterocyte Maturation
There are some additional anatomical and physiological features of the small intestine that are important to understand before before defining uptake and absorption. Crypts of Lieberkuhn are pits between villi as pointed out by the green arrow in the figure below.
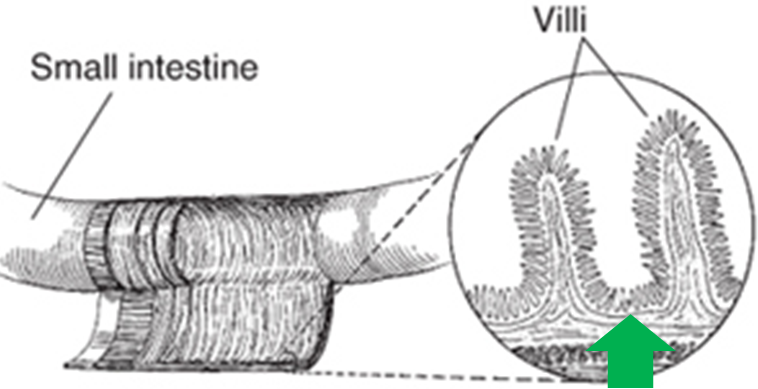
The crypts of Lieberkuhn (often referred to simply as crypts) are similar to the gastric pits in the stomach. The crypts contain stem cells that can produce a number of different cell types, including enterocytes2. From these stem cells in the crypt, immature enterocyte cells are formed that mature as they rise, or migrate up, the villi. Thus, the tips at the top of villi are where the mature, fully functioning enterocytes are located, as represented by the purple cells in the figure below3.
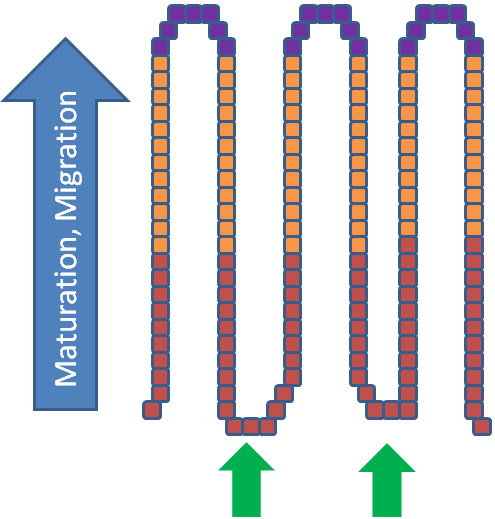
This maturation and migration is a continuous process. The life cycle of an enterocyte is 72 hours once it enters the villus from the crypt2. At the top, enterocytes are sloughed off, and, unless they are digested (contain proteins and lipid) and components are taken up by enterocytes still on villi, they will be excreted in feces as depicted in the figure below.
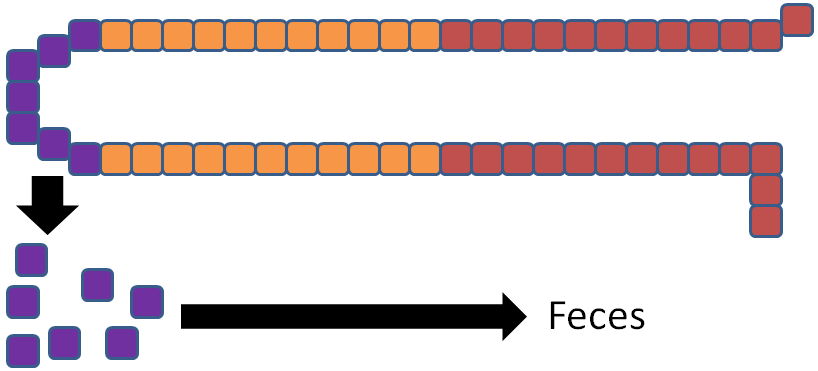
Thus, we define absorption as reaching body circulation, because compounds taken up into enterocytes might not make it into body circulation, and thus are not necessarily absorbed.
References & Links
- http://digestive.niddk.nih.gov/ddiseases/pubs/celiac/
- Stipanuk MH. (2006) Biochemical, physiological, & molecular aspects of human nutrition. St. Louis, MO: Saunders Elsevier.
- Gropper SS, Smith JL, Groff JL. (2008) Advanced nutrition and human metabolism. Belmont, CA: Wadsworth Publishing.
4.2 Uptake Lineup & Cell Membranes
Having completed digestion in the small intestine, a number of compounds are ready for uptake into the enterocyte. The figure below shows the macronutrient uptake lineup, or what is ready to be taken up into the enterocyte.
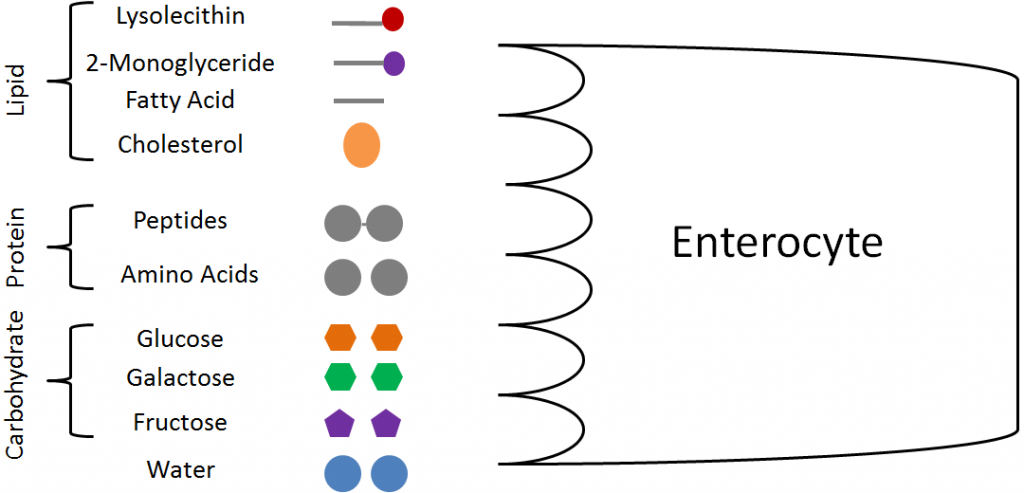
From lipids, we have the lysolecithin (from phospholipid), 2-monoglyceride (from triglycerides), fatty acids, and cholesterol. From protein, there are small peptides (di- and tripeptides) and amino acids. From carbohydrates, only the monosaccharides glucose, galactose, and fructose will be taken up. The other macronutrient, water, has not been discussed so far because it does not undergo digestion.
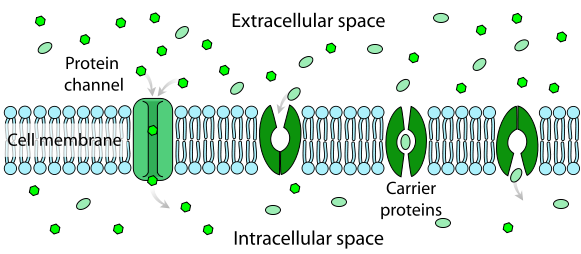
However, these compounds must now cross the plasma (cell) membrane, which is a phospholipid bilayer. In the cell membrane, the hydrophilic heads of the phospholipids point into the lumen as well as towards the interior of the cell, while the tails are on the interior of the plasma membrane as shown below.
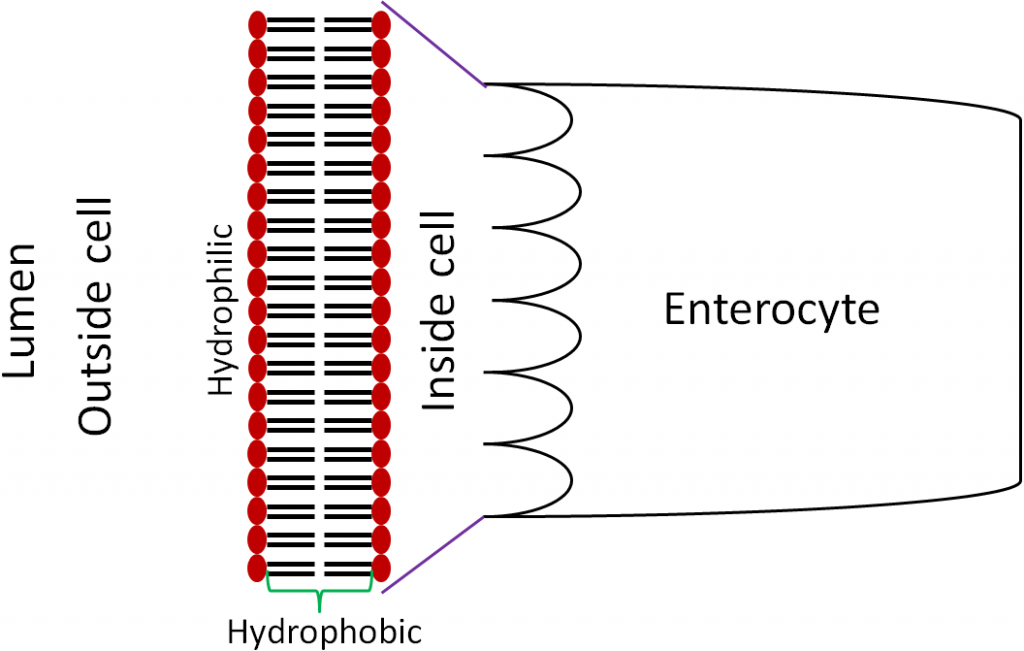
The plasma membrane contains proteins, cholesterol, and carbohydrates in addition to the phospholipids. Membrane proteins, such as channels and pumps, are important for the transport of some compounds across the cell membrane. The figure and two videos below do a nice job of illustrating the components of the cell membrane.
Figure 4.23 Cell membrane1
| Web Links |
References & Links
- http://en.wikipedia.org/wiki/File:Cell_membrane_detailed_diagram_4.svg
Videos
Cell Membrane – http://www.youtube.com/watch?v=owEgqrq51zY
Voyage Inside the Cell: Membrane – http://www.youtube.com/watch?v=GW0lqf4Fqpg
4.3 Types of Cell Uptake/Transport
There are a number of different forms of uptake/transport utilized by your body. These can be classified as passive or active. The difference between the two is whether energy is required and whether (from a solute perspective) they move with or against a concentration gradient. Passive transport does not require energy to move with a concentration gradient. Active transport requires energy to move against the concentration gradient.
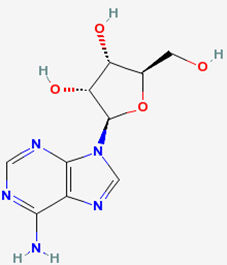
The energy for active uptake/transport is provided by adenosine triphosphate (ATP), which is the energy currency in the body. The structures of adenosine and phosphate are shown below.
 |
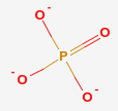 |
Figure 4.31 Structures of adenosine (left) and phosphate (right)
Tri- means three, thus ATP is adenosine with three phosphate groups bonded to it, as shown below.
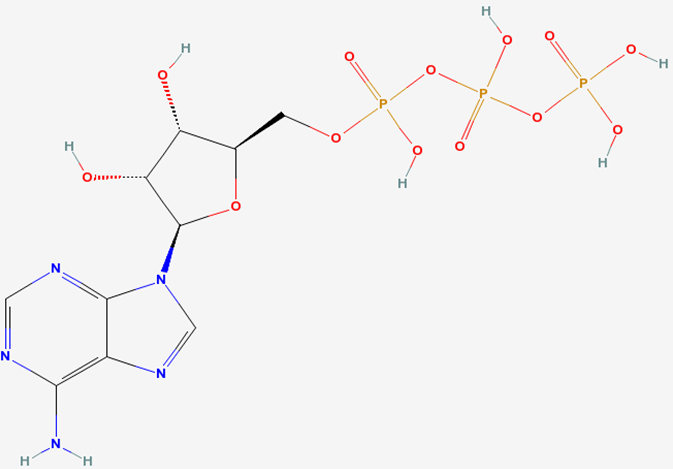
Phosphorylation is the formation of a phosphate bond. Dephosphorylation is removal of a phosphate bond. Overall phosphorylation is a process that require energy. The net effect of dephosphorylation is the release of energy. Thus, energy is required to add phosphates to ATP, energy is released through removing phosphates from ATP.
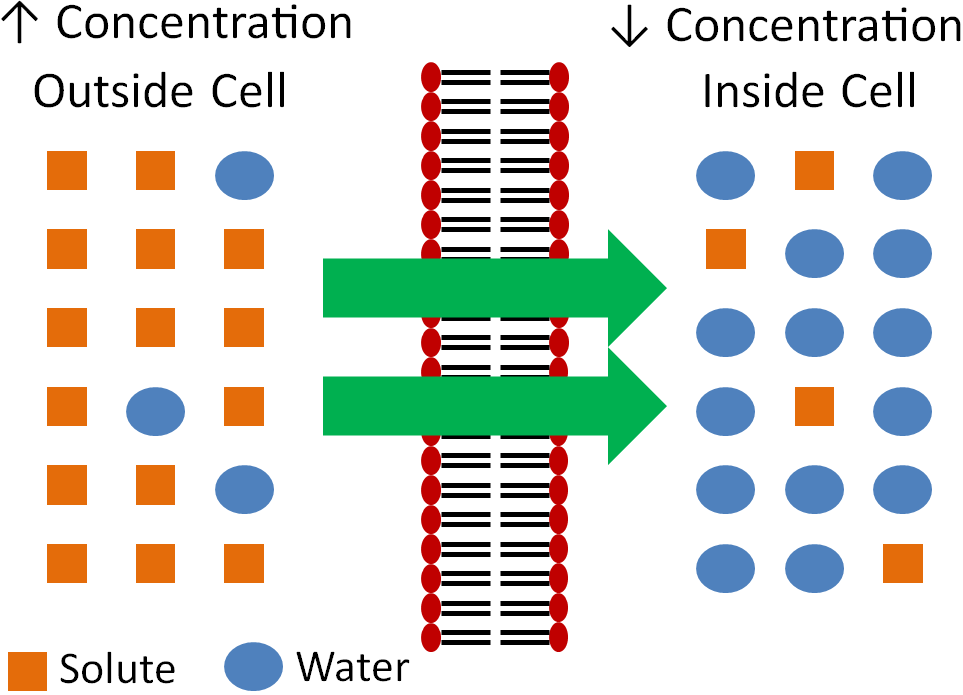
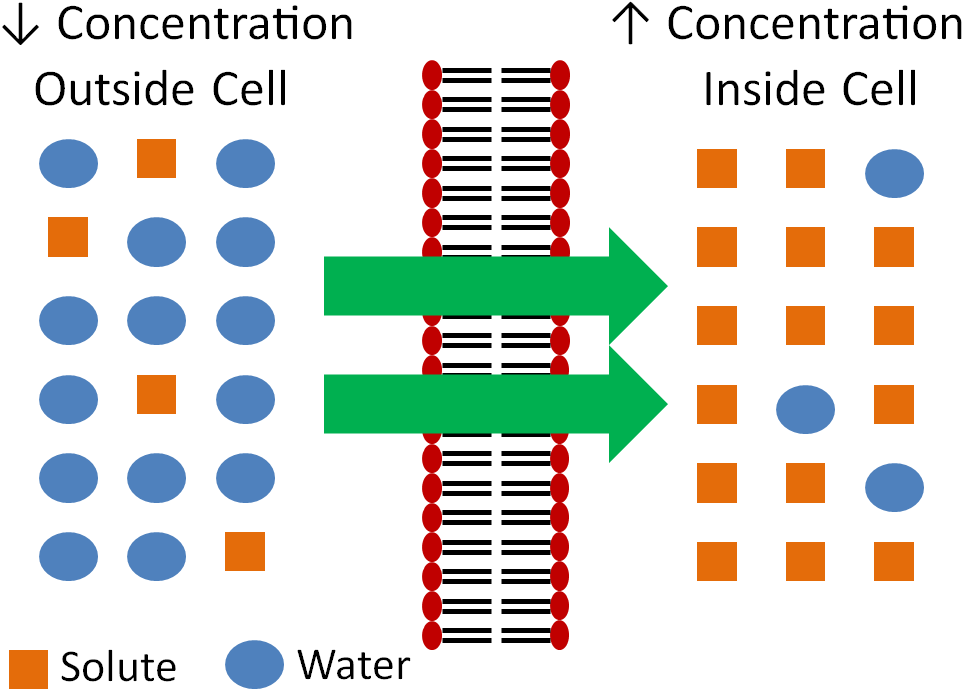
The concentration gradient is a way to describe the difference between the concentration of the solute outside of a cell versus the concentration inside of a cell. A solute is what is dissolved in a solvent in a solution; the more solute the higher the concentration. Moving with the gradient is typically moving of solute from a region of higher concentration to an area of lower concentration. The exception is osmosis, which moves solvent instead of solute to have the same effect of equalizing concentrations on both sides of the membrane. Moving against the gradient is moving solute from an area of lower concentration to an area of higher concentration.
Subsections:
4.31 Passive Uptake/Transport
4.32 Active Uptake/Transport
4.31 Passive Uptake/Transport
There are three forms of passive uptake/transport:
- Simple Diffusion
- Osmosis
- Facilitated Diffusion
Below is more information of each type of uptake/transport.
- Simple Diffusion
Simple diffusion is the movement of solutes from an area of higher concentration (with the concentration gradient) to an area of lower concentration without the help of a protein, as shown below.
- Osmosis
Osmosis is similar to simple diffusion, but water moves instead of solutes. In osmosis water molecules move from an area of lower concentration to an area of higher concentration of solute as shown below. The effect of this movement is to dilute the area of higher concentration.
The following videos do a nice job of illustrating osmosis.
| Web Links |
Another example illustrating osmosis is the red blood cells in different solutions shown below.
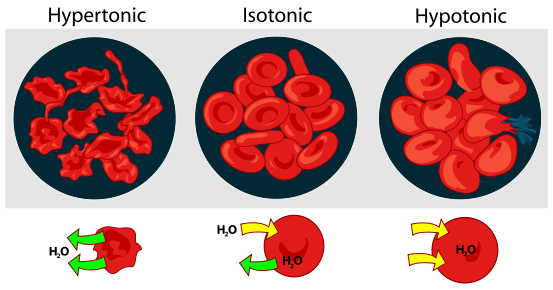
We will consider the simple example of salt as the solute. If the solution is hypertonic, that means that there is a greater concentration of salt outside (extracellular) the red blood cells than within them (intracellular). Water will then move out of the red blood cells to the area of higher salt concentration, resulting in the shriveled red blood cells depicted. Isotonic means that there is no difference between concentrations. There is an equal exchange of water between intracellular and extracellular fluids. Thus, the cells are normal, functioning red blood cells. A hypotonic solution contains a lower extracellular concentration of salt than the red blood cell intracellular fluid. As a result, water enters the red blood cells, possibly causing them to burst.
- Facilitated Diffusion
The last form of passive absorption is similar to diffusion in that it follows the concentration gradient (higher concentration to lower concentration). However, it requires a carrier protein to transport the solute across the membrane. The following figure and video do a nice job of illustrating facilitated diffusion.
| Web Link |
References & Links
- http://en.wikipedia.org/wiki/File:Osmotic_pressure_on_blood_cells_diagram.svg
- https://en.wikipedia.org/wiki/Facilitated_diffusion#/media/File:Scheme_facilitated_diffusion_in_cell_membrane-en.svg
Videos
Osmosis – http://www.youtube.com/watch?v=sdiJtDRJQEc
Osmosis in the Kitchen – http://www.youtube.com/watch?v=H6N1IiJTmnc&NR=1&feature=fvwp
Facilitated Diffusion – http://www.youtube.com/watch?v=s0p1ztrbXPY
4.32 Active Uptake/Transport
There are two forms of active uptake/transport:
- Active Carrier Transport
- Endocytosis
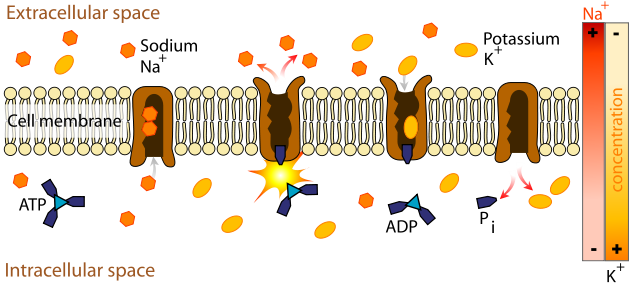
- Active Carrier Transport
Active carrier transport is similar to facilitated diffusion in that it utilizes a protein (carrier). However, energy is also used to move compounds against their concentration gradient. The following figure and video do a nice job of illustrating active carrier transport.
| Web Link |
- Endocytosis
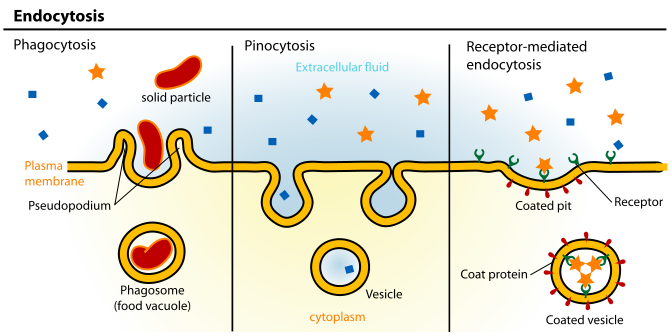
Endocytosis is the engulfing of particles, or fluids, to be taken up into the cell. If a particle is endocytosed, this process is referred to as phagocytosis. If a fluid is endocytosed, this process is referred to as pinocytosis as shown below.
The following video does a really nice job of showing how endocytosis occurs.
| Web Link |
References & Links
- https://en.wikipedia.org/wiki/File:Scheme_sodium-potassium_pump-en.svg
- http://commons.wikimedia.org/wiki/File:Endocytosis_types.svg
Videos
Active Transport – http://www.youtube.com/watch?v=STzOiRqzzL4
Endocytosis – http://www.youtube.com/watch?v=4gLtk8Yc1Zc
4.4 Carbohydrate Uptake, Absorption, Transport & Liver Uptake
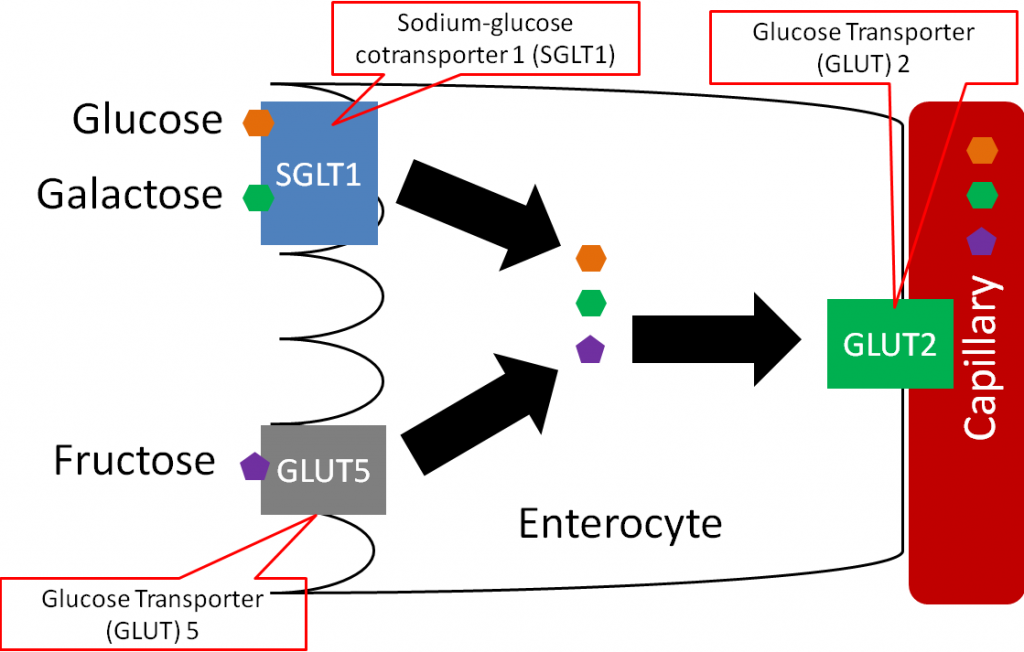
Monosaccharides are taken up into the enterocyte. Glucose and galactose are taken up by the sodium-glucose cotransporter 1 (SGLT1, active carrier transport). The cotransporter part of the name of this transporter means that it also transports sodium along with glucose or galactose. Fructose is taken up by facilitated diffusion through glucose transporter (GLUT) 5. There are 12 glucose transporters that are named GLUT 1-12, and all use facilitated diffusion to transport monosaccharides. The different GLUTs have different functions and are expressed at high levels in different tissues. Thus, the intestine might be high in GLUT5, but not in GLUT12. Moving back to monosaccharides, inside the enterocyte, all three are then transported out of the enterocyte into the capillary (absorbed) through GLUT2 as shown below1.
Inside of each villus there are capillaries and lacteals as shown below. Capillaries are the smallest blood vessels in the body, lacteals are also small vessels but are part of the lymphatic system, as will be described further in a later subsection.

The following video does a nice job of illustrating capillaries and lacteal and provides some basic detail on uptake and absorption.
| Web Link |
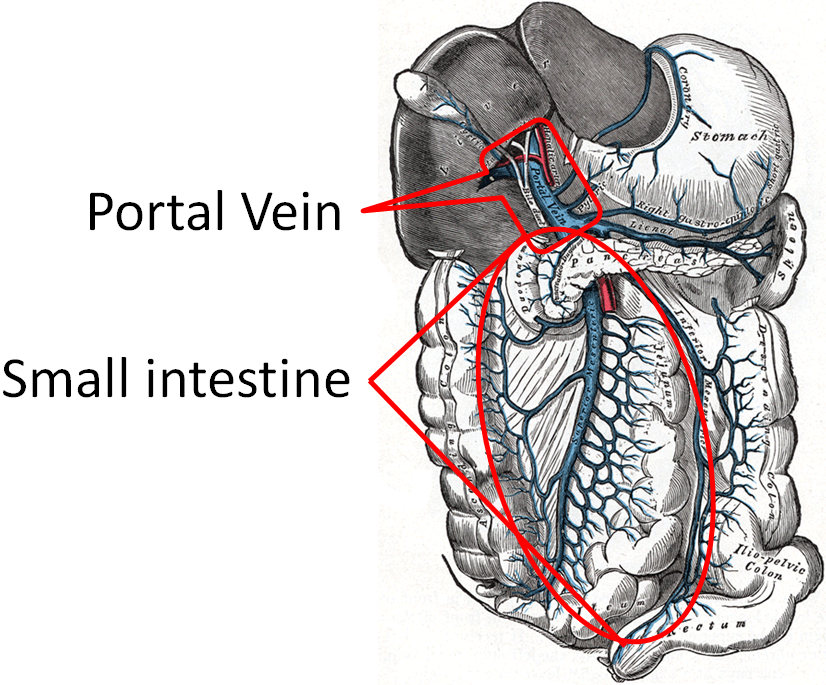
The capillaries in the small intestine join to the portal vein, which transports monosaccharides directly to the liver. The figure below shows the portal vein and all the smaller vessels from the stomach, small intestine, and large intestine that feed into it.
At the liver, galactose and fructose are completely taken up through GLUT5, while only 30-40% of glucose is taken up through GLUT2. After the monosaccharides are taken up, they are phosphorylated by their respective kinase enzymes forming galactose-1-phosphate, fructose-1-phosphate, and glucose-6-phosphate as shown below.
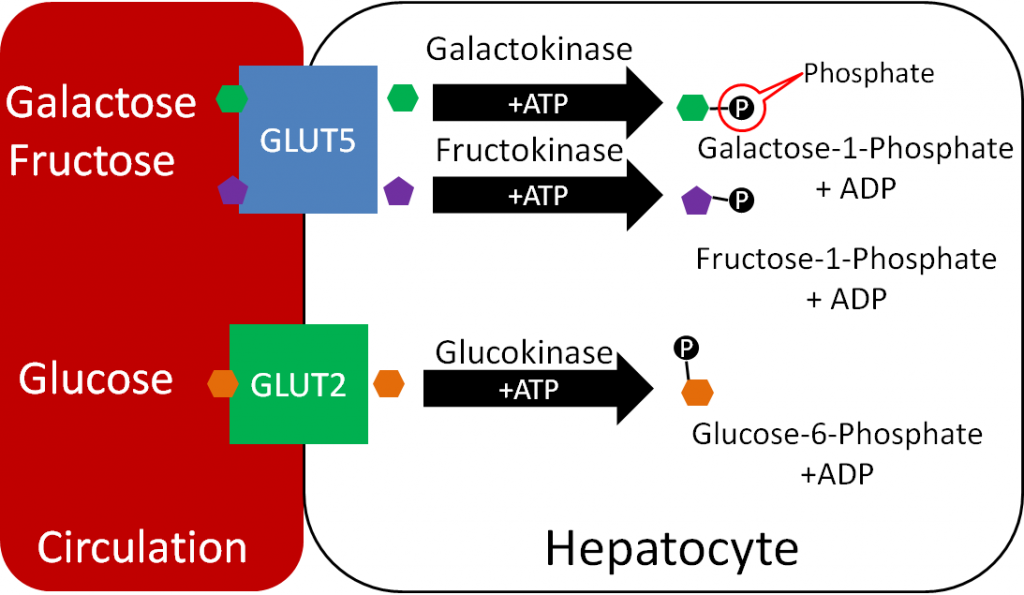
Kinase enzymes normally phosphorylate substrates. Phosphorylation of the monosaccharides is important for maintaining the gradient (by keeping unphosphorylated monosaccharide levels within hepatocytes low) needed for facilitated diffusion through the GLUT transporters3.
References & Links
- Stipanuk MH. (2006) Biochemical, physiological, & molecular aspects of human nutrition. St. Louis, MO: Saunders Elsevier.
- http://en.wikipedia.org/wiki/File:Intestinal_villus_simplified.svg
- https://commons.wikimedia.org/wiki/File:Gray591.png
Video
Absorption in the Small Intestine – http://www.youtube.com/watch?v=P1sDOJM65Bc
4.5 Glycemic Response, Insulin, & Glucagon
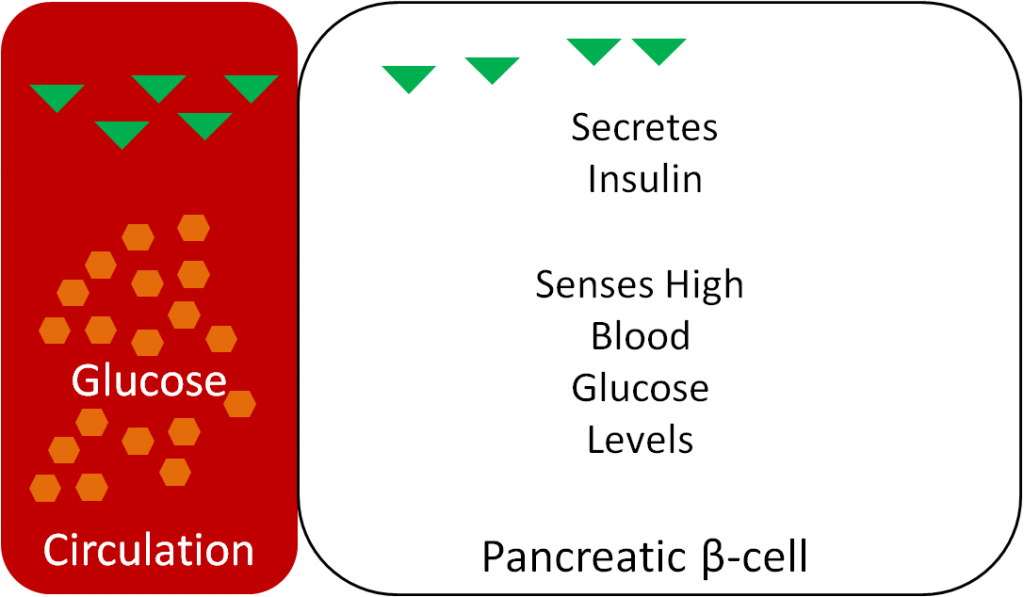
If only 30-40% of glucose is being taken up by the liver, then what happens to the rest? How the body handles the rise in blood glucose after a meal is referred to as the glycemic response. The pancreas senses the blood glucose levels and responds appropriately. After a meal, the pancreatic beta-cells sense that glucose levels are high and secrete the hormone insulin, as shown below1.
Thus, as can be seen in the following figure, blood insulin levels peak and drop with blood glucose levels over the course of a day.
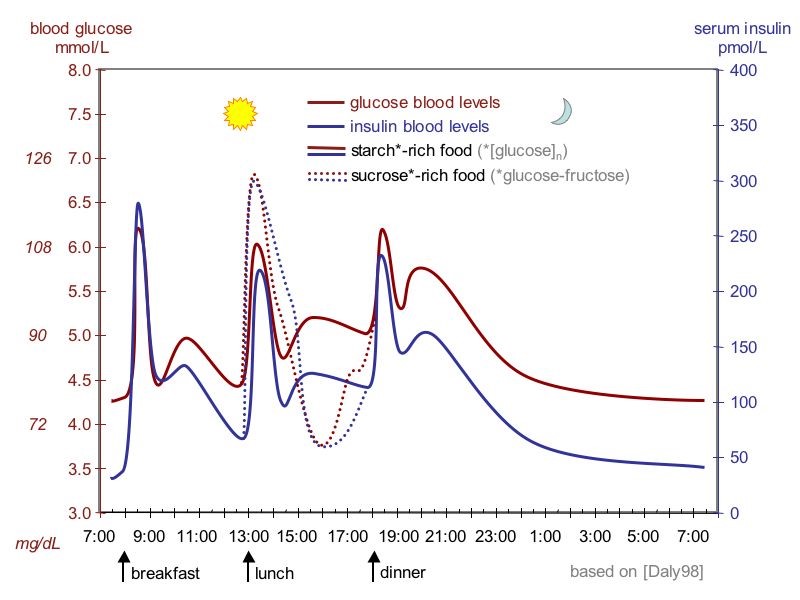
Blood glucose and insulin levels rise following carbohydrate consumption, and they drop after tissues have taken up the glucose from the blood (described below). Higher than normal blood sugar levels are referred to as hyperglycemia, while lower than normal blood sugar levels are known as hypoglycemia.
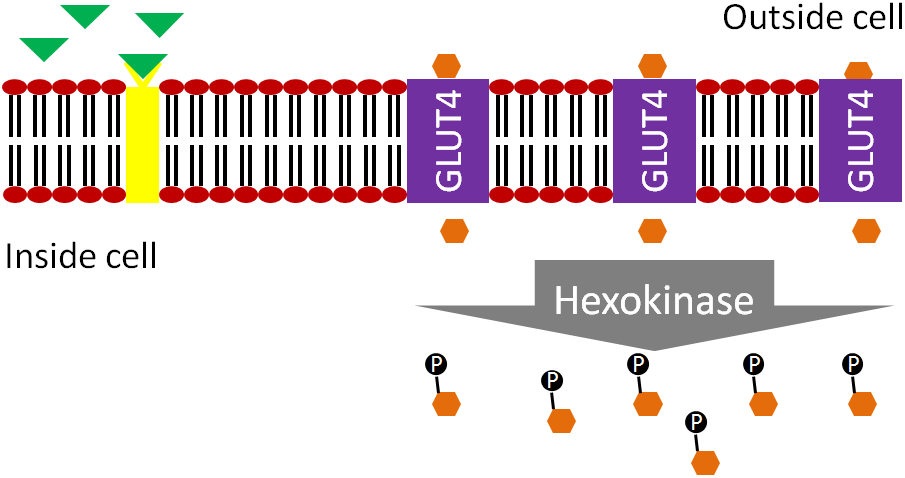
Insulin travels through the bloodstream to the muscle and adipose cells. There, insulin binds to the insulin receptor. This causes GLUT4 transporters that are in vesicles inside the cell to move to the cell surface as shown below.
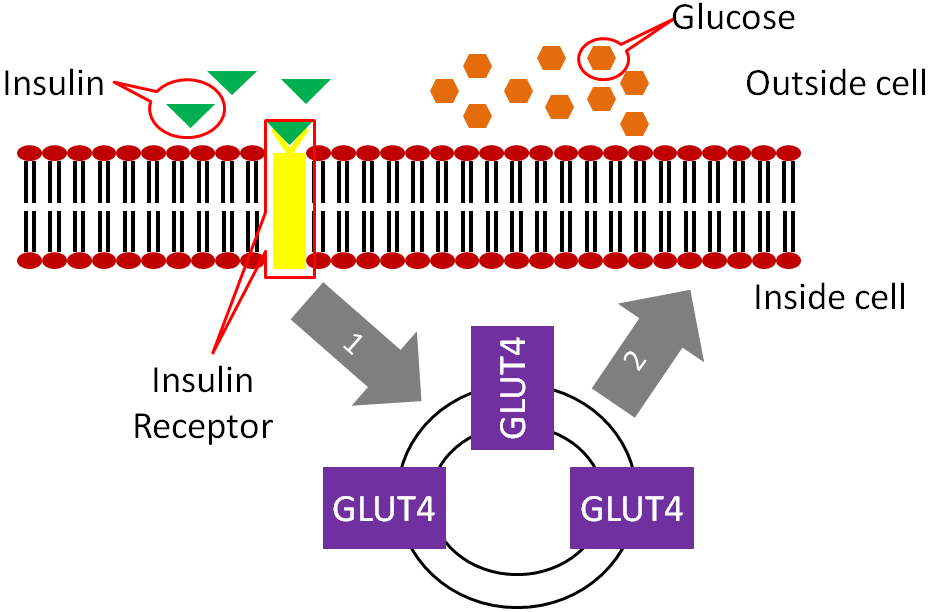
The movement of the GLUT4 to the cell surface allows glucose to enter the muscle and adipose cells. The glucose is phosphorylated to glucose-6-phosphate by hexokinase (different enzyme but same function as glucokinase in liver) to maintain gradient.
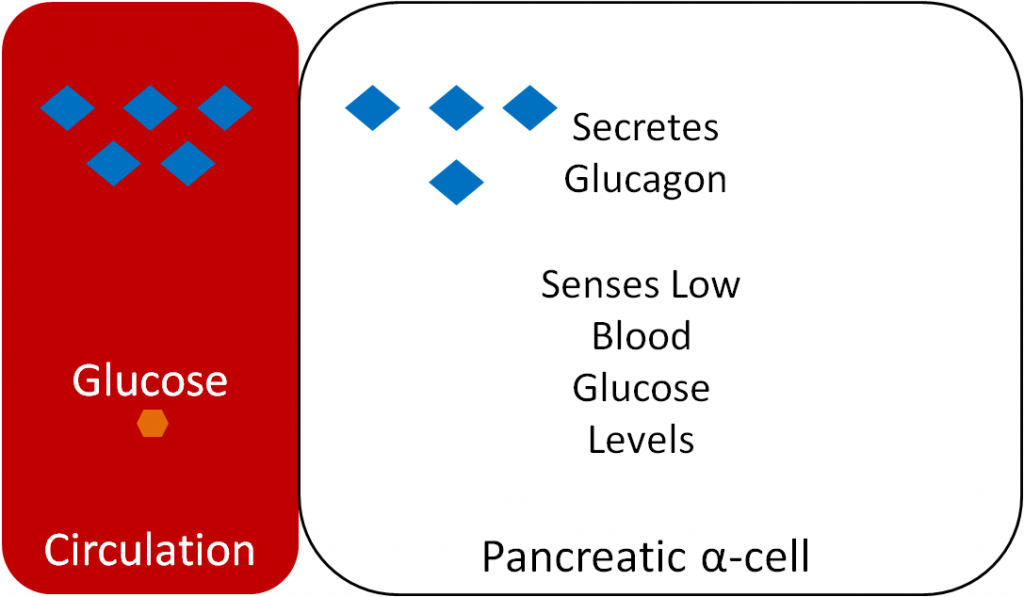
Glucagon is a hormone that has the opposite action of insulin. Glucagon is secreted from the alpha-cells of the pancreas when they sense that blood glucose levels are low, as shown below.
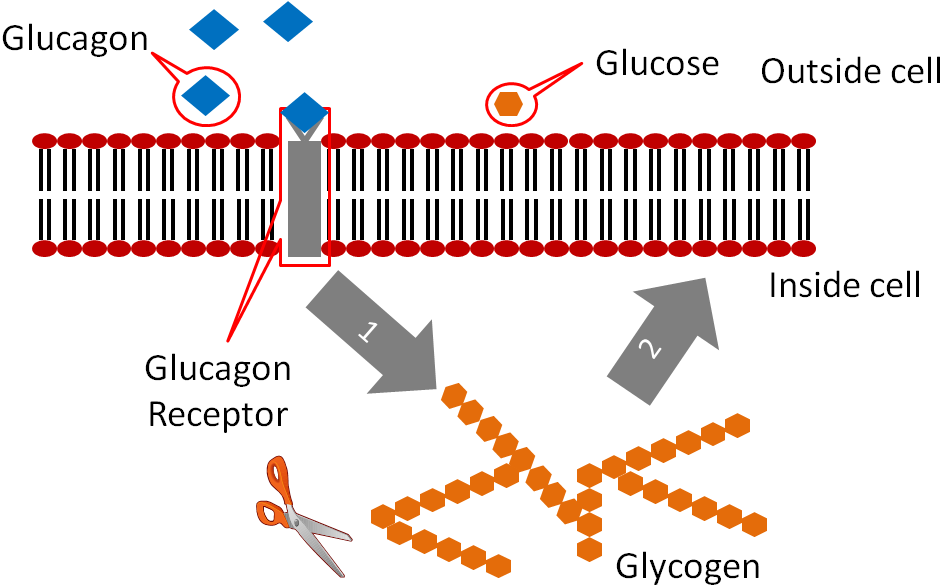
Glucagon binds to the glucagon receptor in the liver, which causes the breakdown of glycogen to glucose as illustrated below..
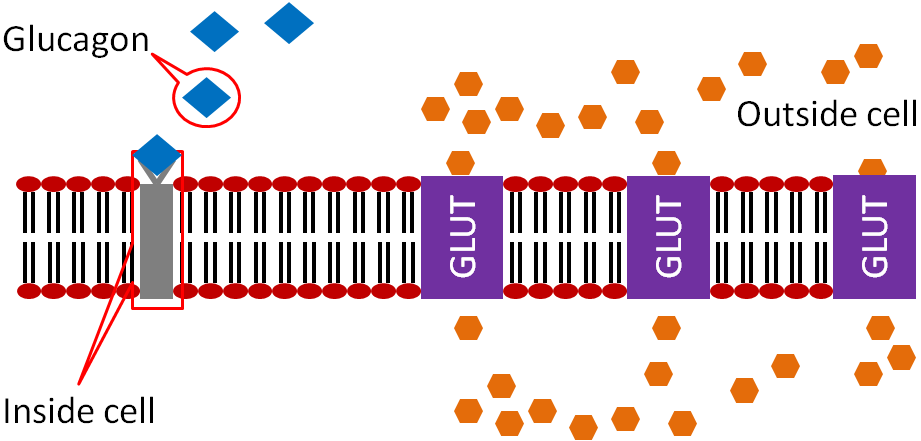
This glucose is then released into circulation to raise blood glucose levels as shown below.
Subsections:
4.51 Diabetes
4.52 Glycemic Index
4.53 Glycemic Load
References & Links
- Webb , Akbar , Zhao , Steiner . (2001) Expression profiling of pancreatic beta-cells: Glucose regulation of secretory and metabolic pathway genes. Diabetes 50 Suppl 1: S135.
- http://en.wikipedia.org/wiki/File:Suckale08_fig3_glucose_insulin_day.jpg
4.51 Diabetes
Diabetes is a condition of chronically high blood sugar levels. The prevalence of diabetes in the US has been rapidly increasing; the link below provides some statistics about prevalence.
| Web Link |
There are 2 forms of diabetes, type 1 and type 2.
In type 1 diabetes, not enough insulin is produced, as shown in the figure below.
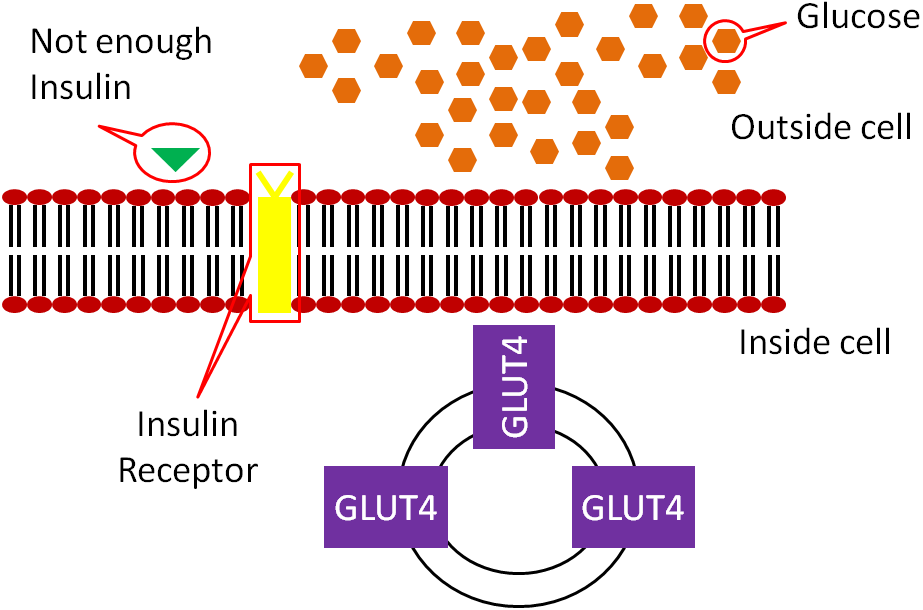
As a result, GLUT4 does not make it to the surface of muscle and adipose cells, meaning glucose is not taken up into these cells.
Type 1 diabetes was previously known as juvenile-onset, or insulin-dependent diabetes and is estimated to account for 5-10% of diabetes cases1. Type 1 diabetics receive insulin through injections or pumps to manage their blood sugar.
In type 2 diabetes, the body produces enough insulin, but the person’s body is resistant to it. In type 2 diabetics the binding of insulin to its receptor does not cause GLUT4 to move to the surface of the muscle and adipose cells, thus no glucose is taken up.
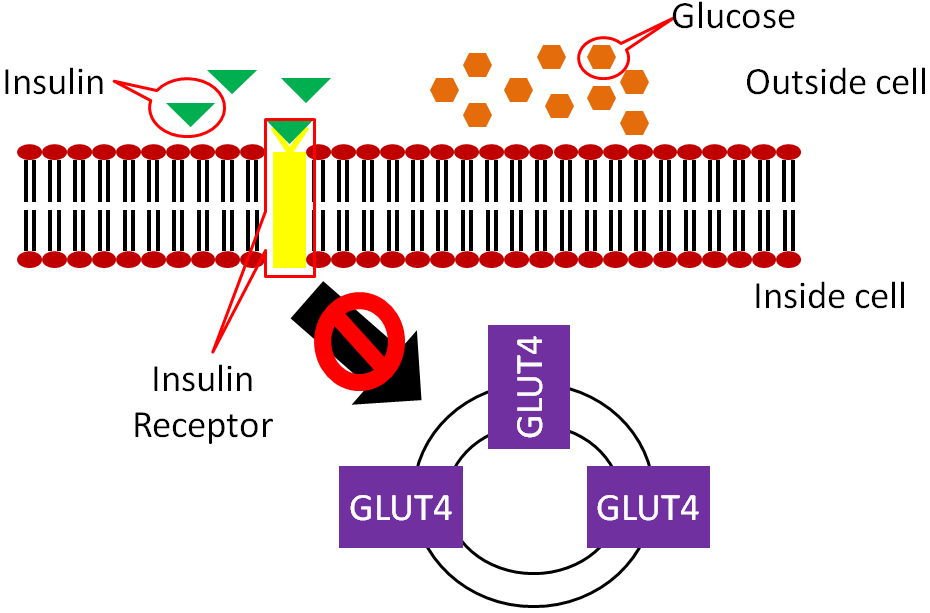
Type 2 diabetes accounts for 90-95% of diabetes cases and was once known as non-insulin-dependent diabetes or adult-onset diabetes1. However, with the increasing rates of obesity, many younger people are being diagnosed with type 2, making the latter definition no longer appropriate. Some people with type 2 diabetes can control their condition with a diet and exercise regimen. This regimen improves their insulin sensitivity, or their response to the body’s own insulin. Others with type 2 diabetes must receive insulin. These individuals are producing enough insulin, but are so resistant to it that more is needed for glucose to be taken up by their muscle and adipose cells.
The video below illustrates type 2 diabetes. However, I do not agree, nor do I teach, that type 2 diabetics have decreased insulin levels as described in the video.
| Web Link |
References & Links
- http://diabetes.niddk.nih.gov/dm/pubs/statistics/#what
Link
Diabetes Statisitics – http://www.diabetes.org/diabetes-basics/statistics/
Video
Diabetes Mellitus – http://www.youtube.com/watch?v=VLiTbb6MaEU
4.52 Glycemic Index
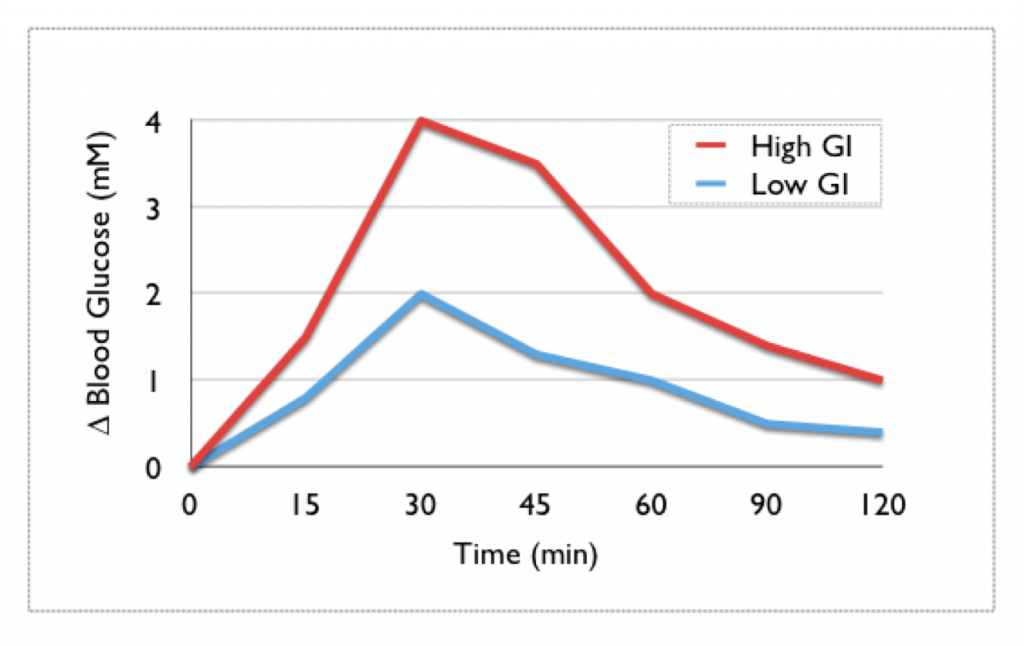
Research has indicated that hyperglycemia is associated with chronic diseases and obesity. As a result, measures of the glycemic response to food consumption have been developed so that people can choose foods with a smaller glycemic response. The first measure developed for this purpose was the glycemic index. The glycemic index is the relative change in blood glucose after consumption of 50 g of carbohydrate in a test food compared to 50 g of carbohydrates of a reference food (white bread or glucose). Thus, a high glycemic index food will produce a greater rise in blood glucose concentrations compared to a low glycemic index food, as shown below.
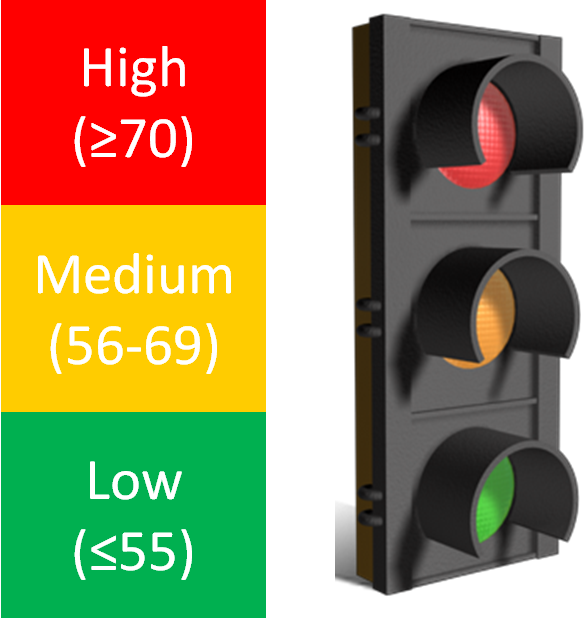
As a general guideline, a glycemic index that is 70 or greater is high, 56-69 is medium, and 55 and below is low. A stop light graphical presentation has been designed to emphasize the consumption of the low glycemic index foods while cautioning against the consumption of too many high glycemic index foods2.
The main problem with the glycemic index is that it does not take into account serving sizes. Let’s take popcorn (glycemic index 89-127) as an example. A serving size of popcorn is 20 g, 11 g of which is carbohydrate3. This is equal to approximately 2.5 cups of popcorn4. Thus, a person would have to consume over 11 cups of popcorn to consume 50 g of carbohydrate needed for the glycemic index measurement. Another example is watermelon, which has a glycemic index of 103, with a 120 g serving containing only 6 g of carbohydrates3. To consume the 50 g needed for glycemic index measurement, a person would need to consume over 1000 g (1 kg) of watermelon. Assuming this is all watermelon flesh (no rind), this would be over 6.5 cups of watermelon4.
The website glycemicindex.com (link provided below) contains a database where you can search to see the food’s glycemic index and glycemic load (covered in the next section). The database contains detail on how the measurement was done and more information on the product itself. The top link below will take you to this website. The second link is to another database that contains the same information that might be easier for some people to use. However, please note that in the second link the glycemic loads are calculated using 100 g serving sizes for all foods. This might not be the actual serving size for all foods, which is what is typically used, so it is important to keep this in mind.
| Web Links |
References & Links
- http://upload.wikimedia.org/wikipedia/commons/e/ec/Glycemic.png
- www.glycemicindex.com
- Foster-Powell K, Holt SHA, Brand-Miller J. (2002) International table of glycemic index and glycemic load values: 2002. Am J Clin Nutr 76(1): 5.
- USDA National Nutrient Database – http://www.nal.usda.gov/fnic/foodcomp/search/
Links
Glycemicindex.com – http://www.glycemicindex.com/
Glycemic Index & Glycemic Load of Foods – http://dietgrail.com/gid/
4.53 Glycemic Load
To incorporate serving size into the calculation, another measure known as the glycemic load has been developed. It is calculated as shown below:
Glycemic Load = (Glycemic Index X (g) Carbs/serving)/100
Thus, for most people, the glycemic load is a more meaningful measure of the glycemic impact of different foods. Considering the two examples from the glycemic index section, their glycemic loads would be:
Popcorn
(89-127 X 11 g Carbs/Serving)/100= 10-14
Watermelon
(103 X 6 g Carbs/Serving)/100 = 6.18
As a general guideline for glycemic loads of foods : 20 or above is high, 11-19 is medium, and 10 or below is low1,2.
Putting it all together, popcorn and watermelon have high glycemic indexes, but medium and low glycemic loads, respectively.
You can also use the top two links below to find the glycemic loads of foods. However, please note that in the second link the glycemic loads are calculated using 100g serving sizes for all foods. This might not be the actual serving size for all foods, which is what is typically used, so it is important to keep this in mind. The third link is to the NutritionData estimated glycemic load tool that is pretty good at estimating the glycemic loads of foods, even if actual glycemic indexes have not been measured.
| Web Links |
References & Links
- http://www.mendosa.com/gilists.htm
- http://www.nutritiondata.com/help/estimated-glycemic-load
Links
Glycemicindex.com – http://www.glycemicindex.com/
Glycemic Index & Glycemic Load of Foods – http://dietgrail.com/gid/
Estimated Glycemic Load – http://www.nutritiondata.com/help/estimated-glycemic-load
4.6 Protein Uptake, Absorption, Transport & Liver Uptake
There are a number of similarities between carbohydrate and protein uptake, absorption, transport, and uptake by the liver. Hopefully after this section you will understand these similarities.
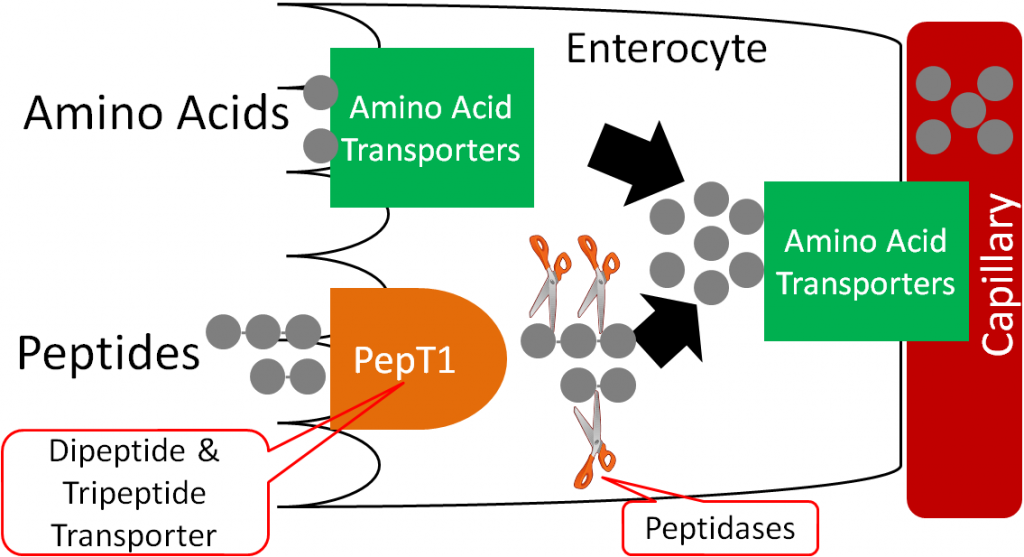
Over 60% of all amino acids are taken up into the enterocyte as di- and tripeptides through the PepT1 transporter. Individual amino acids are taken up through a variety of amino acid transporters. Once inside the enterocyte, peptidases cleave the peptides to individual amino acids. These cleaved amino acids, along with those that were taken up as individual amino acids, are moved into the capillary by another variety of amino acid transporters (some are the same as on the brush border, some are different).
The capillary inside a villus is shown below.

Like monosaccharides, amino acids are transported directly to the liver through the portal vein.

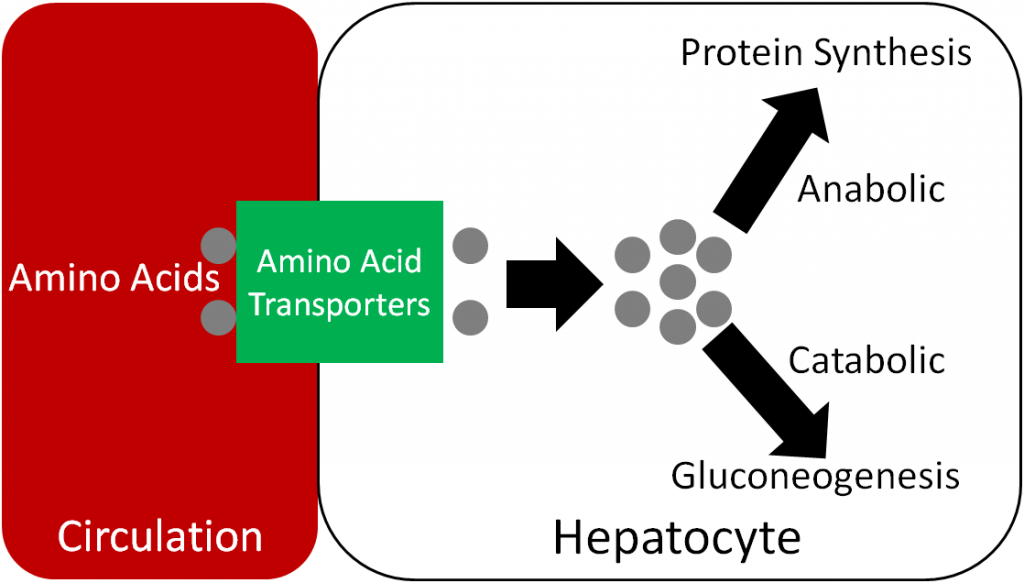
Amino acids are taken up into the hepatocyte through a variety of amino acid transporters. The amino acids can then be used to either make proteins or are broken down to produce glucose, as will be described in chapter 6.
References & Links
- http://en.wikipedia.org/wiki/File:Intestinal_villus_simplified.svg
- https://commons.wikimedia.org/wiki/File:Gray591.png
Videos
Absorption in the Small Intestine – http://www.youtube.com/watch?v=P1sDOJM65Bc
4.7 Lipid Uptake, Absorption & Transport
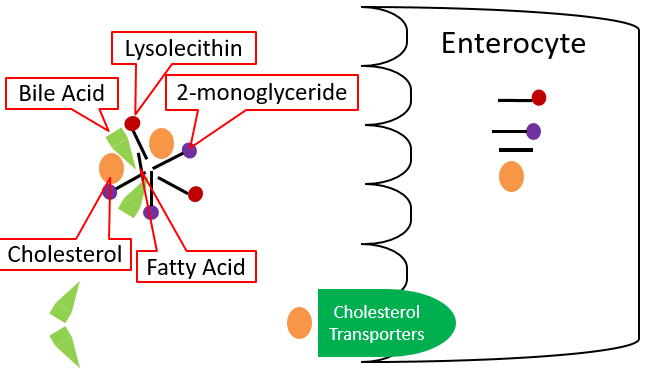
Once mixed micelles reach the brush border of the enterocyte, two different lipid uptake mechanisms are believed to occur, but lipid uptake is not completely understood. One mechanism is that individual components of micelles may diffuse across the enterocyte. Otherwise, it is believed that some components may be taken up through unresolved transporters. For example, cholesterol transporters have been identified, but their overall mechanism of absorption is not well understood. The individual compounds are taken up as shown below.
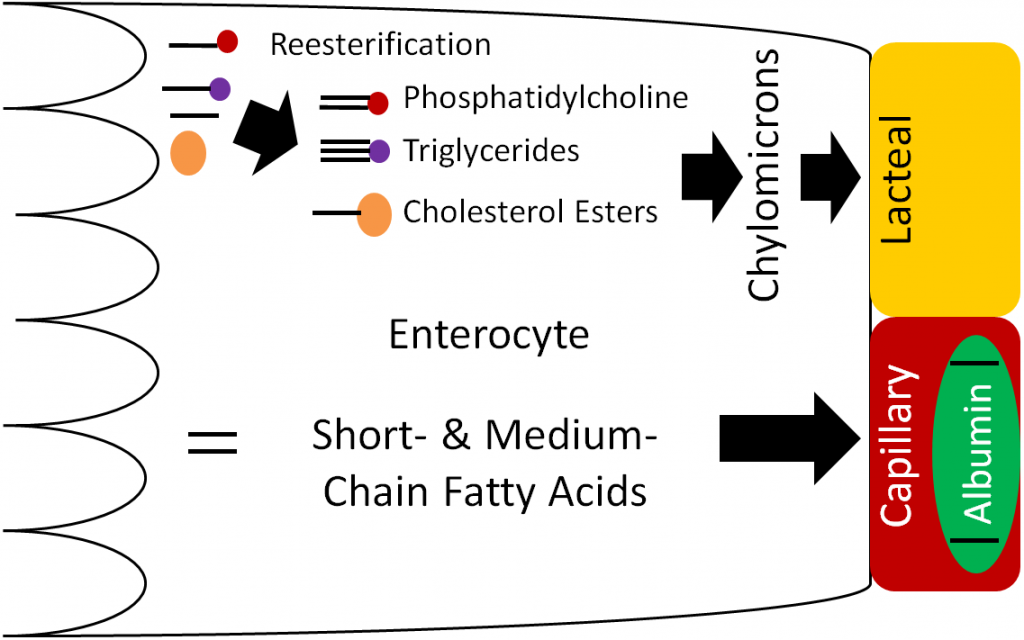
Once inside the enterocyte, there are different fates for fatty acids, depending on their length. Short- and medium-chain fatty acids move through the enterocyte and enter circulation through the capillaries; they are transported by the protein albumin. They will be carried to the liver by the portal vein, like monosaccharides and amino acids. Long-chain fatty acids, 2-monoglyceride, lysolecithin, and cholesterol will be re-esterified forming triglycerides, phosphatidylcholine, and cholesterol esters, respectively. These re-esterified lipids are then packaged into chylomicrons, which are lipoproteins, that are described in further detail in the next section. These chylomicrons are too large to fit through the pores in the capillaries, but they can fit through the larger fenestrations (openings) in the lacteal.
Lacteals (shown below) are small vessels that feed into the lymphatic system. Thus, the chylomicrons enter the lacteals and enter into lymphatic circulation.
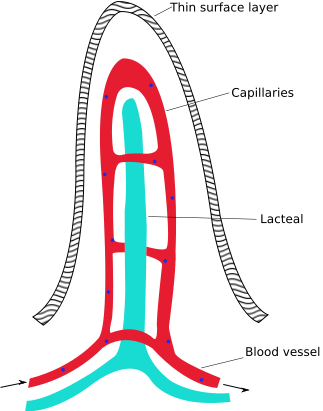
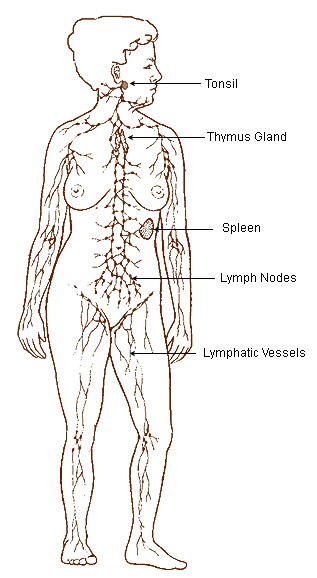
The lymphatic system is a system similar to the circulatory system in that it contains vessels that transport fluid. However, instead of blood, the lymphatic system contains a clear fluid known as lymph. There are a number of lymph nodes (small glands) within the lymphatic system that play a key role in the body’s immune system. The figure below shows the lymphatic system.
The following videos describe and illustrate how the lymphatic system and lymph functions.
| Web Links |
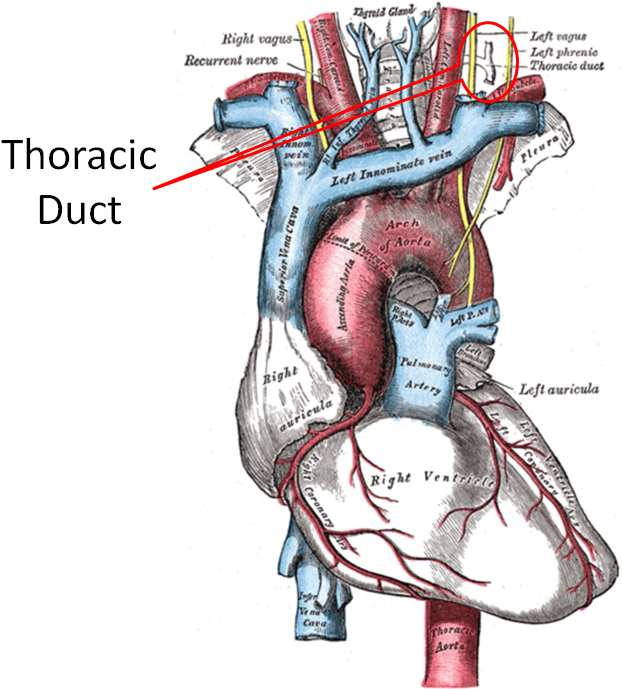
The lymphatic system enters general circulation through the thoracic duct that enters the left subclavian vein as shown below. General in this case means that it is not directed to the liver like other components that have been absorbed.
The animation below is an overview of lipid digestion, uptake, and initial transport.
| Web Links |
Subsection:
4.71 Lipoproteins
References & Links
- http://en.wikipedia.org/wiki/File:Intestinal_villus_simplified.svg
- http://en.wikipedia.org/wiki/File:Illu_lymphatic_system.jpg
- http://en.wikipedia.org/wiki/File:Gray505.png
Link
http://www.wiley.com/college/grosvenor/0470197587/animations/Animation_Lipid_Digestion_and_Absorption/Energy/media/content/dig/anima/dig5a/frameset.htm
Videos
Lymphatic system – http://www.youtube.com/watch?v=qTXTDqvPnRk
Lymph Movement – https://www.youtube.com/watch?v=ZdYxx4CHb-A
4.71 Lipoproteins
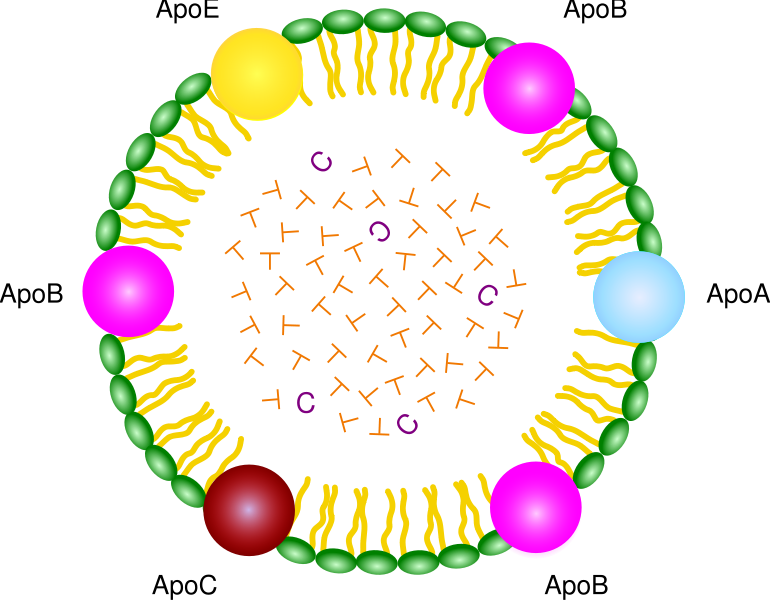
Lipoproteins, as the name suggests, are complexes of lipids and protein. The proteins within a lipoprotein are called apolipoproteins (aka apoproteins). There are a number of different apolipoproteins that are abbreviated apo-, then an identifying letter (i.e. Apo A) as shown in the chylomicron below.
The following video does a nice job of illustrating the different lipoprotein components.
| Web Link |
There are a number of lipoproteins in the body. They differ by the apolipoproteins they contain, size (diameter), density, and composition. The table below shows the difference in density and diameter of different lipoproteins. Notice that as diameter decreases, density increases.
Table 4.711 The density and diameter of different lipoproteins2
| Lipoprotein | Density (g/dL) | Diameter (nm) |
| Chylomicrons | 0.95 | 75-1200 |
| VLDL (very low-density lipoproteins) | 0.95-1.006 | 30-80 |
| IDL (intermediate-density lipoproteins) | 1.006-1.019 | 25-35 |
| LDL (low-density lipoproteins) | 1.019-1.063 | 18-25 |
| HDL (high-density lipoproteins) | 1.063-1.21 | 5-12 |
This inverse relationship is a result of the larger lipoproteins being composed of a higher percentage of triglyceride and a lower percentage of protein as shown below.
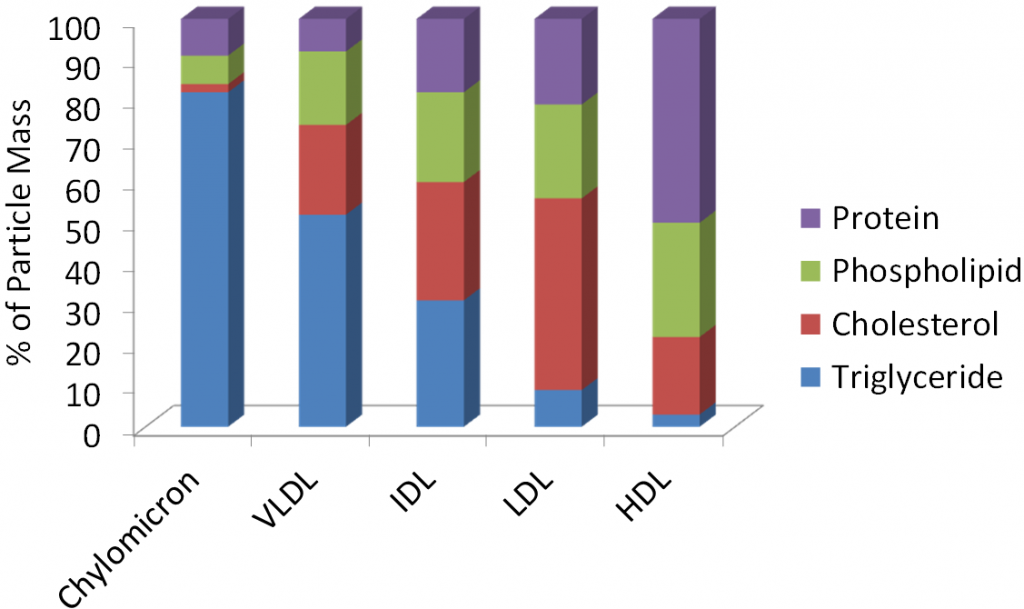
Protein is more dense than triglyceride (why muscle weighs more than fat), thus the higher protein/lower triglyceride composition, the higher the density of the lipoprotein. Many of the lipoproteins are named based on their densities (i.e. very low-density lipoproteins).
As described in the last subsection, the lipoproteins released from the small intestine are chylomicrons. The video below does a nice job of showing, describing, and illustrating how chylomicrons are constructed and function.
| Web Link |
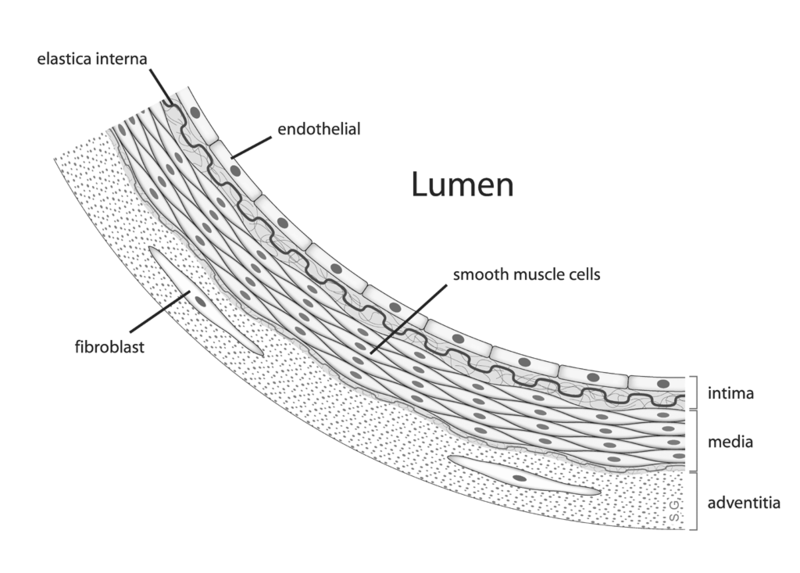
The endothelial cells that line blood vessels, especially in the muscle and adipose tissue, contain the enzyme lipoprotein lipase (LPL). LPL cleaves the fatty acids from lipoprotein triglycerides so that the fatty acids can be taken up into tissues. The figure below illustrates how endothelial cells are in contact with the blood that flows through the lumen of blood vessels.
LPL cleaves fatty acids from the triglycerides in the chylomicron, decreasing the amount of triglyceride in the lipoprotein. This lipoprotein with less triglycerides becomes what is known as a chylomicron remnant, as shown below.
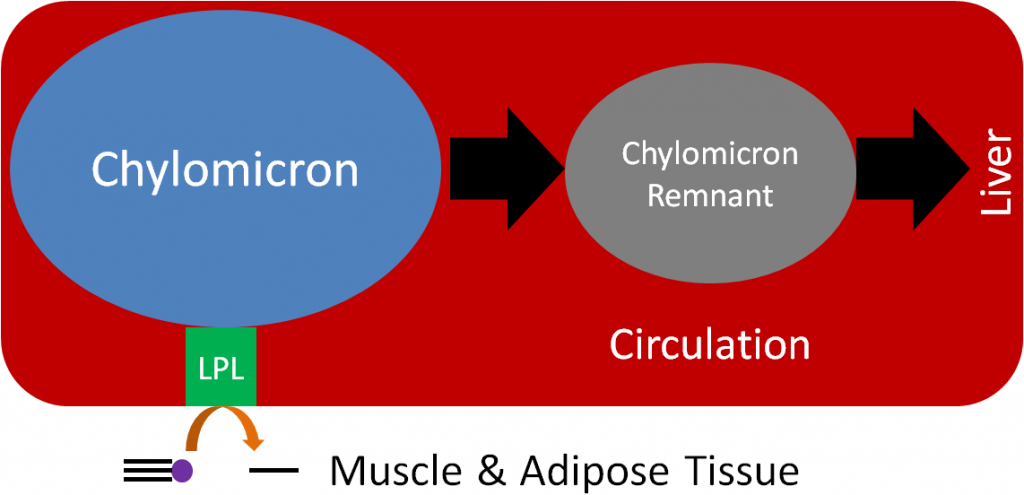
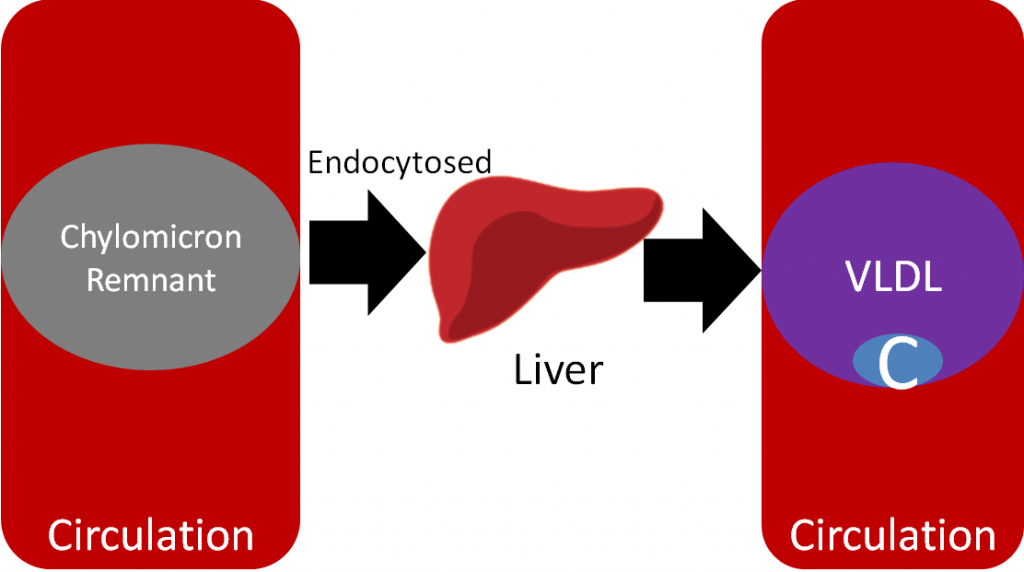
Now in the form of a chylomicron remnant, the digested lipid components originally packaged into the chylomicron are directed to the liver where the chylomicron remnant is endocytosed. This process of clearing chylomicrons from the blood takes 2-10 hours after a meal2. This is why people must fast 12 hours before having their blood lipids (triglycerides, HDL, LDL etc.) measured. This fast allows all the chylomicrons and chylomicron remnants to be cleared before blood is taken. However, whether patients should be asked ot fast has been questioned as described in the link below.
| Web Link |
After the chylomicron remnant is endocytosed, it is broken down to its individual components (triglycerides, cholesterol, protein etc.). In the liver, VLDL are produced, similar to how chylomicrons are produced in the small intestine. The individual components are packaged into VLDL and secreted into circulation as shown below.
Like it does to chylomicrons, LPL cleaves fatty acids from triglycerides in VLDL, forming the smaller IDL (aka VLDL remnant). Further action of LPL on IDL results in the formation of LDL. The C in Figures 4.715 and 4.716 represents cholesterol, which is not increasing; rather, since triglyceride is being removed, it constitutes a greater percentage of particle mass of lipoproteins. As a result, LDL is composed mostly of cholesterol, as depicted in the figure below.
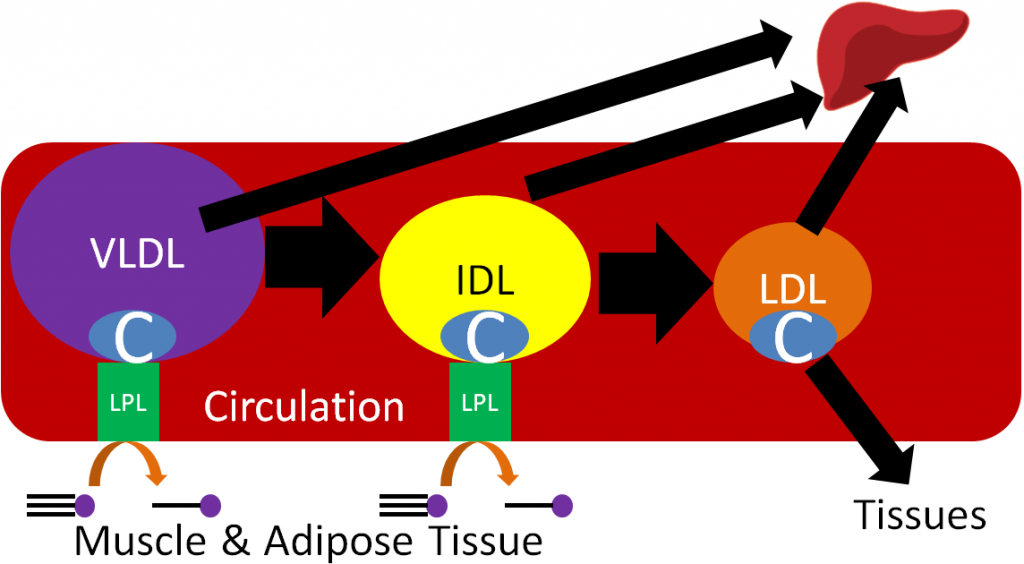
LDL contains a specific apolipoprotein (Apo B100) that binds to LDL receptors on the surface of target tissues. The LDL are then endocytosed into the target tissue and broken down to cholesterol and amino acids.
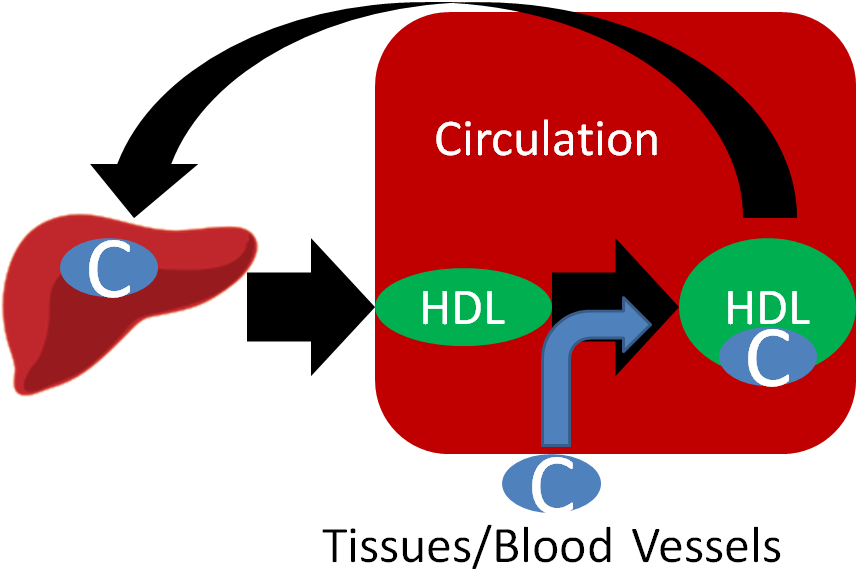
HDL are made up of mostly protein and are derived from the liver and intestine. HDL participates in reverse cholesterol transport, which is the transport of cholesterol back to the liver. HDL picks up cholesterol from tissues/blood vessels and returns it to the liver itself or transfers it to other lipoproteins returning to the liver.
The animation under the transport button in the following link does a really nice job of going through the process of lipoprotein transport.
| Web Link |
You are probably familiar with HDL and LDL being referred to as “good cholesterol” and “bad cholesterol,” respectively. This is an oversimplification to help the public interpret their blood lipid values, because cholesterol is cholesterol; it’s not good or bad. LDL and HDL are lipoproteins, and as a result you can’t consume good or bad cholesterol, you consume cholesterol. A more appropriate descriptor for these lipoproteins would be HDL “good cholesterol transporter” and LDL “bad cholesterol transporter.”
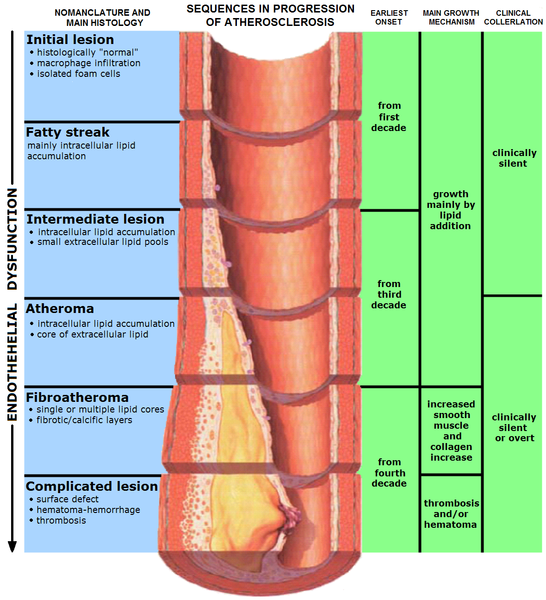
What’s so bad about LDL? LDL enters the endothelium where it is oxidized. This oxidized LDL is engulfed by white blood cells (macrophages), leading to the formation of what are known as foam cells. The foam cells eventually accumulate so much LDL that they die and accumulate, forming a fatty streak. From there the fatty streak, which is the beginning stages of a lesion, can continue to grow until it blocks the artery. This can result in a myocardial infarction (heart attack) or a stroke. HDL is good in that it scavenges cholesterol from other lipoproteins or cells and returns it to the liver. The figure below shows the formation of the fatty streak and how this can progress to a point where it greatly alters blood flow.
The video below does an excellent job of illustrating this process. However there are two caveats to point out. First, it incorrectly refers to cholesterol (LDL-C etc.), and second, it is clearly made by a drug company, so keep these factors in mind. The link below is the American Heart Association’s simple animation of how atherosclerosis develops.
| Web Link |
Despite what you learned above about HDL, a recent study questions its importance in preventing cardiovascular disease. It found that people who have genetic variations that lead to higher HDL levels were not at decreased risk of developing cardiovascular disease. You can read more about this interesting finding in the first link below. In addition, another recent study is questioning whether saturated fat is associated with an increased risk of cardiovascular disease.
| Web Link |
The following video gives a general overview of macronutrient digestion, uptake, and absorption.
| Web Link |
References & Links
- http://en.wikipedia.org/wiki/File:Chylomicron.svg
- Byrd-Bredbenner C, Moe G, Beshgetoor D, Berning J. (2009) Wardlaw’s perspectives in nutrition. New York, NY: McGraw-Hill.
- Gropper SS, Smith JL, Groff JL. (2008) Advanced nutrition and human metabolism. Belmont, CA: Wadsworth Publishing.
- http://en.wikipedia.org/wiki/File:Anatomy_artery.png
- 7. Erdman JW Jr., MacDonald IA, Zeisel SH, editors. (2012) Present knowledge in nutrition – 10th ed. Ames, IA: Wiley-Blackwell.
- http://en.wikipedia.org/wiki/File:Endo_dysfunction_Athero.PNG
Links
Ask Well: Should you fast before a cholesterol test – http://well.blogs.nytimes.com/2016/05/24/ask-well-should-you-fast-before-a-cholesterol-test/
Lipoprotein Animation – http://www.wiley.com/legacy/college/boyer/0470003790/animations/cholesterol/cholesterol.swf
Cholesterol and CAD – http://watchlearnlive.heart.org/CVML_Player.php?moduleSelect=chlcad
Doubt Cast on the ‘Good’ in ‘Good Cholesterol’ – http://www.nytimes.com/2012/05/17/health/research/hdl-good-cholesterol-found-not-to-cut-heart-risk.html
Study Questions Fat and Heart Disease Link – http://well.blogs.nytimes.com/2014/03/17/study-questions-fat-and-heart-disease-link/
Videos
Lipoproteins – https://www.youtube.com/watch?v=x-4ZQaiZry8
Chylomicrons – http://www.youtube.com/watch?v=hRx_i9npTDU
LDL Receptor – http://www.youtube.com/watch?v=XPguYN7dcbE
Atherosclerosis – http://www.youtube.com/watch?v=fLonh7ZesKs&feature=rec-HM-r2
Small Intestine – http://www.youtube.com/watch?v=P1sDOJM65Bc
