8 A New Application: The NGSS Explorer
The NGSS as a Network
In the time elapsed between the first edition of this text (2017) and the current one (2022) numerous changes have been made to TeachEngineering (2.0). One of those is the addition of a new tool for exploring the Next Generation Science Standards; the NGSS Explorer tool.
At several locations in the previous chapters, we have referred to ‘educational standards;’ learning outcomes or ‘performance expectations’ that express knowledge and skills that USA K-12 students are meant to master as they progress through their education. In chapter 1 we mentioned that in the USA the formulation of these standards is the prerogative of the individual states. We also mentioned, that these standards are frequently updated and reformulated and that efforts have been made to harmonize standards between states. One of those efforts resulted in the Next Generation Science Standards or NGSS (NSTA, 2022); a set of K-12 science and engineering standards which at the time of this writing (July 2022) has been adopted by 20 states (ibid.)
The NGSS are constructed in a hierarchical, three-dimensional manner in that they are broken up into 12 so-called Topics. Examples of topics are Energy, Engineering Design, Matter and its Interactions, etc. Topics apply at one or more grade levels. For each topic, one or more performance expectations (PEs) exist. For instance, one of the PEs for the topic Energy at grade 5 is that students should be able to “use models to describe that energy in animals’ food (used for body repair, growth, motion, and to maintain body warmth) was once energy from the sun.”
These PEs themselves are composites of three, more fundamental types of standards: Crosscutting Concepts (CCs) —ideas and concepts that apply across disciplines; Disciplinary Core Ideas (DCIs) —the core ideas and concepts of a discipline such as Earth Sciences or Biology, and Science and Engineering Practices (SEPs) —practices shared across all of science and engineering.
Adding all Topics, PEs, CCs, DCIs and SEPs present in the NGSS, we arrive at a total of 845 standards. These 845 standards maintain a total of 2,145 relationships with each other.
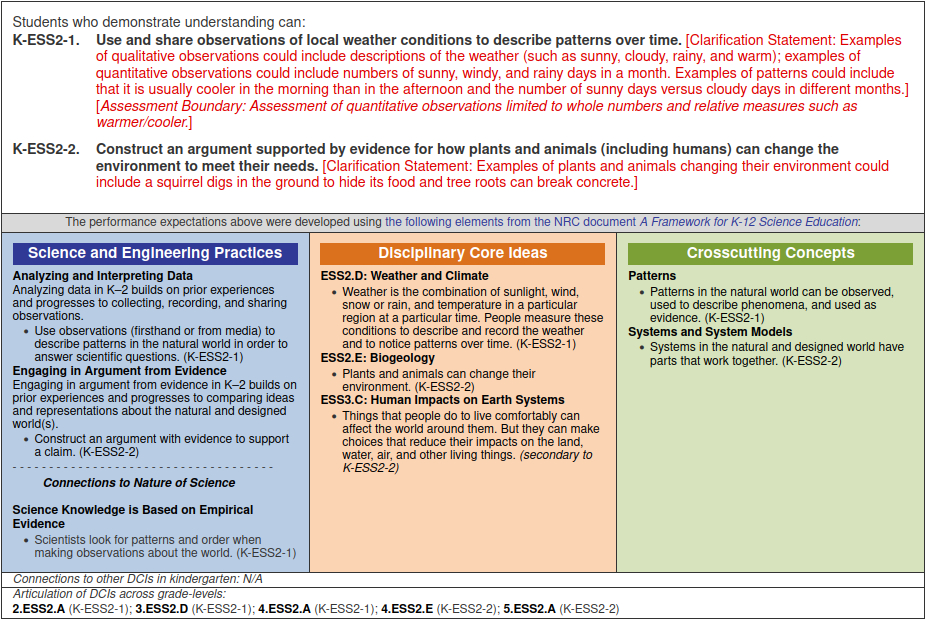
The traditional way of viewing the NGSS is through a set of linked tables. Figure 1 (on-line at https://www.nextgenscience.org/dci-arrangement/k-ess2-earths-systems) shows an example of this.
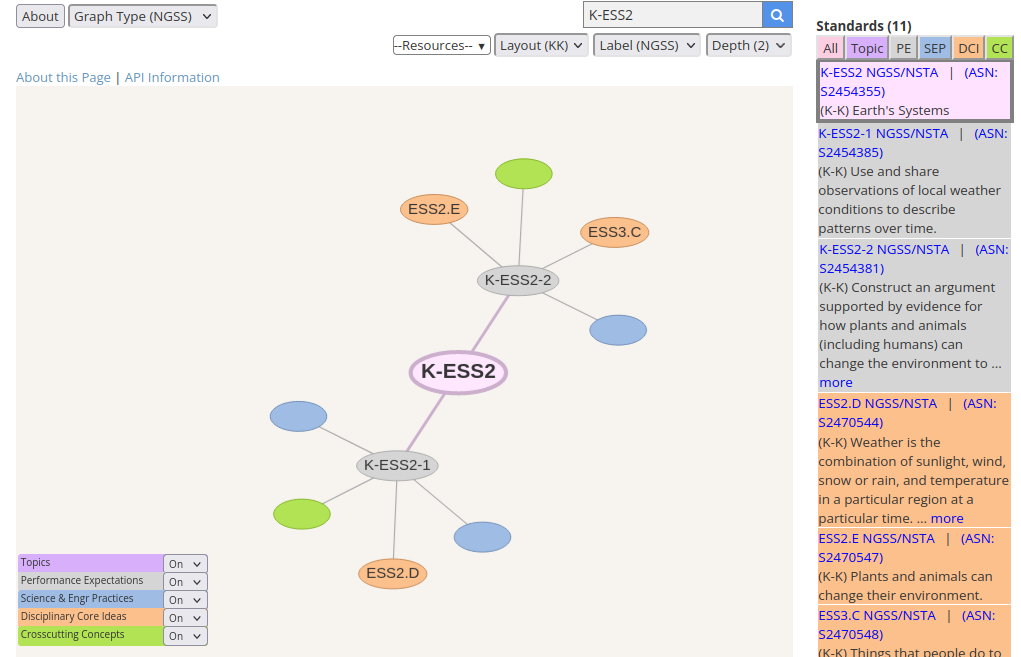
There is little doubt that viewing the NGSS through a set of linked tables is easier than following the connections through a single text. However, the notion that we have 845 standards maintaining 2,000+ connections with each other seems to invite an alternative representation, namely that of a network of nodes (the standards) and links between those nodes. This is what the NGSS Explorer in TeachEngineering does. Figure 2, for instance, shows the same ‘Earth’s Systems at grade K’ standard as Figure 1, but this time in the form of a network. The network is interactive in that users can can navigate through it by interacting with the nodes and the texts of the standards, by selecting different groups of standards, depth levels, graph display options, etc.
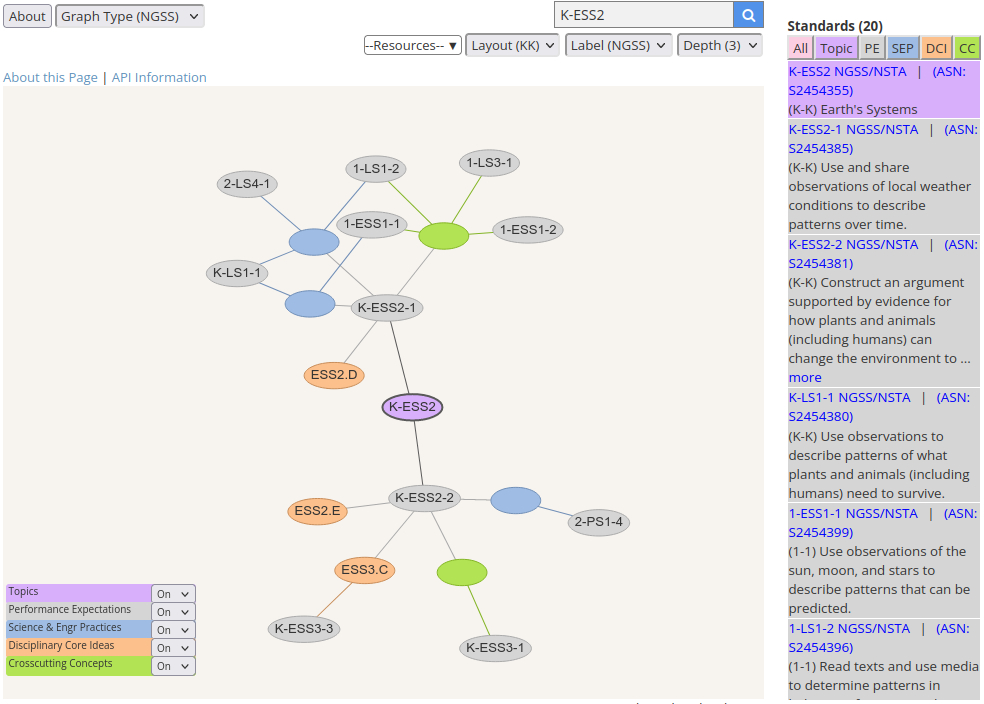
Similarly, the network can be viewed at different depths. With ‘depth’ we mean the distance from the displayed standard (node) expressed as the number of links away from that standard. For instance, the depth of the network of Figure 2 is 2; i.e., from standard K-ESS2, we follow up to two link steps. Figure 3 shows the network for that same standard K-ESS2, but this time with a depth of 3.
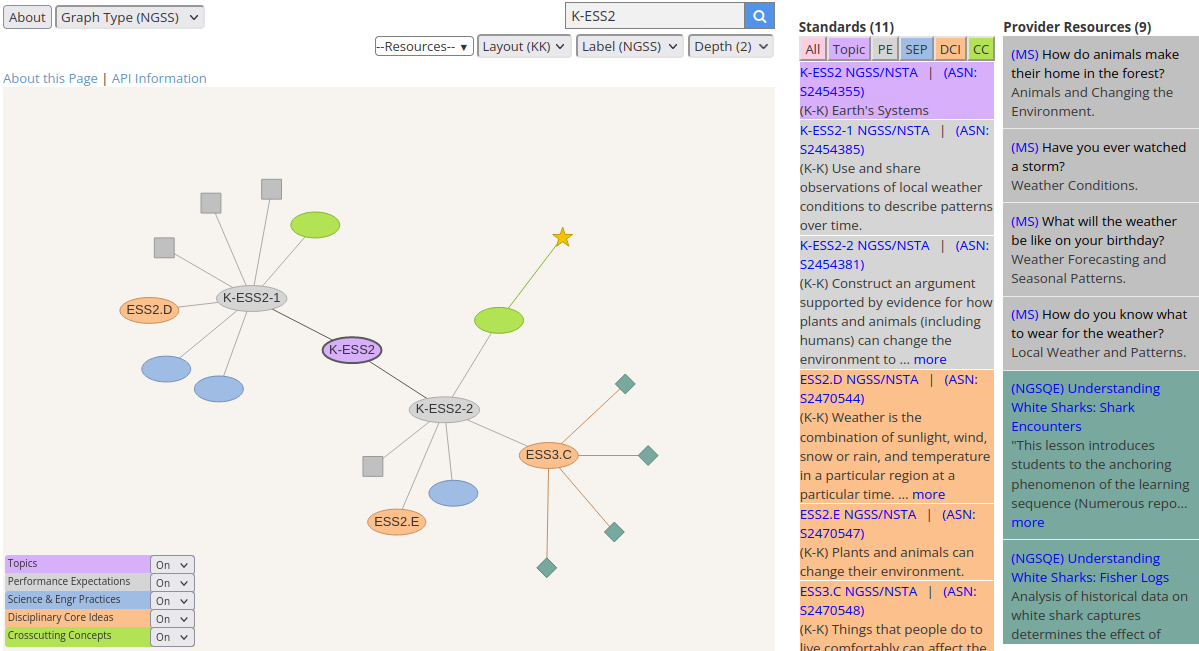
One of the advantages of networks is that they can be extended by adding new nodes and connections. One application of that is to include learning resources which are aligned to those standards. Figure 4, for instance, shows not only the same standards as displayed in Figure 2, but also a series of aligned K-12 learning resources which support teaching those standards: one from TeachEngineering (the star), four from Mystery Science (the grey squares) and four from a collection of NGSS-endorsed resources (the blue-grey diamonds).
We invite readers to explore what else you can do at https://www.teachengineering.org/ngss_explorer. If you find things not to be working as expected, do not hesitate to drop an email at reitsmar ‘at’ oregonstate.edu.
How Does All This Work?
The technology that runs the NGSS Explorer is the same technology that runs the rest of TE 2.0; i.e., a RavenDB (NoSQL JSON) database, C#, HTTP and a lot of JavaScript. The only other component is a set of R libraries that is used to compute the positions of network nodes before rendering that network on the screen. The network rendering itself and the direct user interaction with it such as zooming, selecting and moving network nodes are all done by the vis.js JavaScript library.
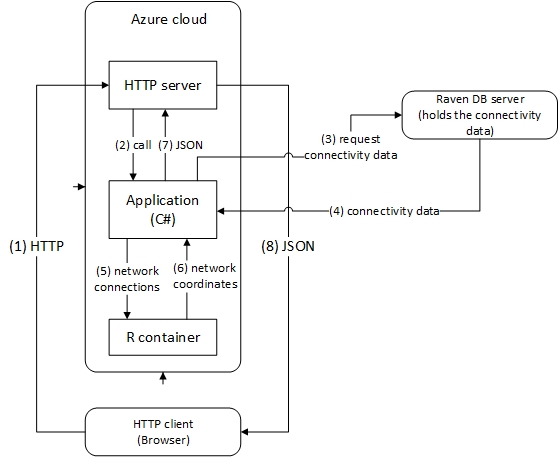
Figure 5 shows the basic architecture of the NGSS Explorer.
The RavenDB database holds all the data of the NGSS standards, their connections, their alignments with teaching resources, and basic information about those resources, such as who publishes them, their title and summary and —if available— their location on the web.
The NGSS explorer essentially runs in the user’s web browser as a JavaScript program. When a user starts it (Step 1 in figure 4), it reaches out to the TeachEngineering HTTP (web) server with a request for a complete network; i.e., a request for a data structure representing any and all nodes with any and all possible connections between those nodes (Steps 2, 3 and 4, 7 and 8 in Figure 4.). Since any and all possible networks that can be displayed each represent only a subset of this complete network, this data structure is loaded only once during an NGSS Explorer session; it is held in memory by the JavaScript program running in the user’s web browser.
Once a user submits a request for a specific network, the JavaScript running in the browser extracts from its complete network only those nodes and connections which are implied by the user’s request.
At that point only two more steps remain: 1. figuring out where —at which locations— on the screen to display each of the nodes and 2. display the nodes at those locations and all connections between them.
Of these, the first —figuring out the positions of all the nodes to be displayed— is the trickiest one. Many algorithms for solving this problem exist; see McGuffin (2012) for a good introduction. The NGSS Explorer offers two of these: Kamada-Kawai (1989) and Fruchterman-Rheingold (1991). Kamada-Kawai is used as the default.
Several implementations for both of these algorithms are available on the Internet/web. We found that the ones implemented in R’s igraph library worked really well, so those are the ones used for the NGSS Explorer.
Figure 5 once again shows how this functionality is integrated into the system. Once a user requests a specific network and the JavaScript program running in the browser has determined which nodes and connections are involved, it submits a request to the TeachEngineering HTTP server for the positional information of the network’s nodes (Step 1 in Figure 4). The HTTP server forwards this request to a C# program (Step 2), which in its turn calls R (step 5). R then computes the positional information and returns it to the C# program (Step 6), which in its turn returns it as a JSON structure to the HTTP server (Step 7), which returns that structure to the user’s browser (Step 8). Once the JavaScript program has received the nodes’ positional information, it passes that and the connectivity data to vis.js which then displays the network in the browser.
References
Fruchterman T.M.J., Reingold E M. (1991) Graph drawing by force-directed placement. Software: Practice and Experience, 21, 1129-1164.
Kamada T, Kawai S. (1989) An algorithm for drawing general undirected graphs. Information Processing Letters, 31, 7-15.
McGuffin, M.J. (2012) Simple Algorithms for Network Visualization: A Tutorial. TSINGHUA SCIENCE AND TECHNOLOGY, ISSN 1007-0214 02/11. 383-398. https://ieeexplore.ieee.org/stamp/stamp.jsp?arnumber=6297585 (accessed, July 7, 2022)
NSTA — National Science Teachers Organization (2022) About the Next Generation Science Standards. https://ngss.nsta.org/About.aspx (accessed, July 7, 2022)
