Unit 4: Considering the Influence of Light and Thermal Phenomena on Global Climate
VI. Using Central Ideas Based on Evidence to Consider the Impact of Global Climate Change
A. Exploring the impact of global climate change on sea levels
What is the evidence that sea levels are rising? Why is this happening? In particular, what happens when light from the Sun shines on snow and ice on land versus in open water? What happens when light from the Sun shines on the oceans?
Question 4.10 What evidence indicates that sea levels are rising?
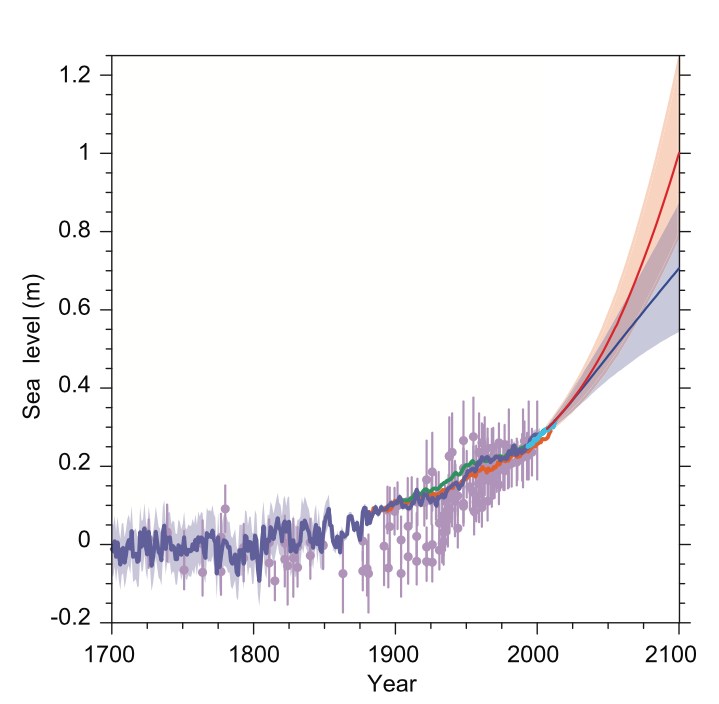
The IPCC Fifth Assessment report on The Physical Science Basis devoted Chapter 13 to the topic of sea level change (pp.1137-1216). Figure 4.32 presents a line graph from this report. This graph represents past, recent, and predicted global average sea levels.
- What does the vertical axis represent?
- What does the horizontal axis represent?
- What do the lines represent?
- What does the shape of the lines imply about global average sea level?
https://www.ipcc.ch/pdf/assessment-report/ar5/wg1/WG1AR5_Chapter13_FINAL.pdf
The vertical axis represents the mean sea level in meters.
The horizontal axis represents time from 1700 to 2100.
The jagged lines represent the mean sea level based on various data. The smooth red and blue lines represent projections of mean sea level based on two different computer models of predicted greenhouse gas emissions.
The global mean sea level appears to have been relatively stable from about 1700 to about 1800 according to interpretations of layers evident in vertical cores removed from peat in salt marshes. The global mean sea level at about 1700 is taken to be the zero level to which later global mean sea levels are compared.
The global mean sea level appears to have begun rising slightly from about 1800 to about 1900 and continued rising at an increased rate from about 1900 to about 2000. The latter yearly mean sea levels were based on several different tide gauge studies, represented by different color lines, as well as from layers in cores of peat in salt marshes.
In 1993, satellite altimeter radar measurements began. (https://www.star.nesdis.noaa.gov/sod/lsa/SeaLevelRise/). Such highly accurate data can provide detailed information about the relative contributions by thermal expansion of the oceans and by melting ice in Greenland, Antarctica, and mountain glaciers elsewhere (https://sealevel.jpl.nasa.gov/documents/1596/?list=projects ). Dr. Anny Cazenave was a lead author in such satellite altimeter radar studies (https://blogs.ei.columbia.edu/2020/01/21/pioneer-in-spotting-modern-sea-level-rise-to-receive-2020-vetlesen-prize/).
The lines projecting mean sea level rise during the 21st century are based on two computer models that differ in the predicted concentration of carbon dioxide. These predictions depend upon actions taken, or not taken, to curb greenhouse gas emissions. These models are called Representative Concentration Pathways (RCPs). RCP2.6 (blue) models a scenario that assumed reduced emissions with an increase in average global temperature of less than 2ºC. RCP8.5 (red) models a scenario that assumed very high greenhouse gas emissions.
Question 4.11 What happens when light from the Sun shines on glacial ice and snow on land or on icebergs in the ocean?
When light from the Sun shines on the Earth, some of the light shines on snow and ice. The light supplies energy needed to warm the Earth and to change these solid forms of water into liquid water by melting. What impact does this have if the melting happens to glaciers on land compared to if the melting happens to icebergs already floating in the oceans?
How can you model and compare what happens when ice melts on land with what happens when ice melts in water? One way to explore this issue uses the following equipment for each group:
- 2 trays or one large tray such as a cookie sheet
- 2 low containers such as identical frozen dinner trays
- 1 flat rock in one low container
- As many ice cubes as possible to put on the rock and an equal number in the other low container
- Enough water to fill both low containers to the brim
- At the top of your physics notebook page, record the Topic of this exploration. Under Before, draw a picture of your set up and describe your plan for this exploration. What do you predict will happen? Why do you predict this will happen?
- Place a container on a tray. Place an identical container on another identical tray or place both on a large tray like a cookie sheet.
- Place a flat rock in one container; place some ice cubes on the rock;
- Place the same number of ice cubes in the other container without rock;
- Fill both containers up to the lip with water. Be sure the water level is all the way to the lip.
- Predict what will happen when the ice melts. Careful! DON’T JIGGLE THE TABLE!
- Observe the trays of melting ice every few minutes. What happens in each tray?
- Under the During section of your physics notebook page, record your observations and interpret these results.
- Discuss your findings and formulate relevant central ideas.
- In the After section of the physics notebook page, report these central ideas and the evidence on which they are based.
- Write a rationale that explains how the evidence supports the central ideas and why these are important.
- Also reflect upon this exploration such as what connections can you make to other experiences? How might you use what you learned in your own classroom?
- What are you still wondering?
Question 4.12 What happens when light from the Sun shines on the oceans?
To model what happens when light from the Sun shines on the oceans, provide for each student (or group), one regular thermometer with red liquid in a tube and bulb at the bottom .
- How can you model what happens when light from the Sun shines on the oceans? One way uses a thermometer, the kind that has a narrow tube with a red liquid (alcohol) inside a bulb at the bottom of the thermometer.
- At the top of your physics notebook page, record the Topic of this exploration. Under Before, draw a picture of your set up and describe your plan for this exploration. What do you predict will happen? Why do you predict this will happen?
- Record the room temperature reading for a thermometer that has been sitting in a room for a long time.
- Hold the bulb of the thermometer in your hand for a few minutes
- Record the temperature reading of the thermometer now.
- What do you observe? How do you interpret this observation?
- Under the During section of your physics notebook page, record your observations and interpret these results.
- Discuss your findings and formulate a relevant central idea.
- In the After section of the physics notebook page, report this central idea and the evidence on which is based.
- Reflect upon what you have learned and what you are still wondering.
Finish documenting these explorations on your physics notebook pages and writing summaries before looking at examples of student work about modeling what happens when light shines on the snow, ice, and the oceans.
1. Example of student work about modeling and comparing the impact of light from the Sun shining on ice on land and ice in the sea
Modeling rising sea levels due to melting ice on land:

In class we modeled the rising sea levels due to melting ice on land. We started off with two bowls, each with a clean tray under it. One bowl was empty and one had several rocks in it to act as land on Earth. We placed the same amount of ice cubes in each bowl. In the empty bowl, we placed the ice cubes on the bottom. In tray B we placed the ice on top of the rocks. We then filled each tray to the brim with room temperature water, then waited. My table predicted that the tray without the rocks in it would not overflow because the ice already displaced the water with enough room for it when it melted. We also predicted that the bowl with the ice on the rocks would overflow because the ice was not already in the water and wasn’t able to displace enough room for it when it melted. After an ample amount of time for the ice to melt, we came over and made our final observations. As we predicted, the bowl containing rocks had overflowed, whereas the tray without rocks did not. If you had a glass of ice water, when the ice melts, the glass doesn’t overflow, but if you add ice to an already full glass of water, it will overflow. This is the same for the melting land ice flowing into the ocean vs. the sea ice already floating in the ocean. This means that the melting sea ice does not contribute to the rising sea levels, whereas the melting land ice does.
National Geographic states some grim possible outcomes to rising sea levels. If we continue down the same path we are on, we could see the sea levels rise as much as 6.5 feet by the year 2100. It could be made even worse if we experience the complete melting of the Greenland ice sheet. This could push sea levels to rise to 23 feet, which is, horrifyingly, enough to submerge London: http://ocean.nationalgeographic.com/ocean/critical-issues-sea-level-rise/
Physics student, Fall 2016

Figure 4.34 shows the equipment used in this exploration. An improvement would be to use food coloring in the water so that the overflow in the tray with the ice cubes on a rock would be more visible.
Students have periodically responded to a series of questions designed to elicit their thoughts about what is working well and what might improve their learning experiences in this course. A student wrote:
I thought that the activity that had the most powerful impact on my learning experience of global climate change was the activity about how melting ice on land is affecting rising sea levels. I thought it was a very simple, and straightforward way to model what is happening on our earth.
I also enjoyed talking with my friend about the material that we went over. She is getting her degree in environmental studies with a focus on atmospheric science so it was interesting to hear her thoughts on what we were learning. She also found the way we were going about understanding the material as a way to help adults understand it as well. Many people don’t have basic knowledge of what global climate change is so she saw the activities and lecture material that we went over as a good way to help the general population who is unaware of current environmental issues become educated.
Physics student, Spring 2015
In a conversation about the course, this student emphasized the importance of the use of simple equipment with which people are familiar and are likely to have at home that makes it easy to engage a friend or family member in thinking together about highly politicized issues like climate change.
2. Example of student work about modeling the impact of light from the Sun shining on the oceans
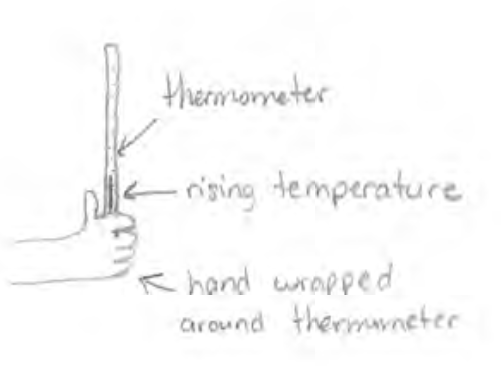
Modeling rising sea levels due to thermal expansion of oceans. In class we held thermometers in our hands to warm them and model the thermal expansion of oceans. The thermometers all began at room temperature, and then we heated them up by placing them in our hands. As our body temperature heated up the liquid inside, it caused the liquid to expand and rise up though the thermometer. This taught us that not only are oceans rising due to melting land ice, but also as the infrared radiation heats the ocean up more and more, it is beginning to expand. As the water in the oceans expands it rises, contributing to the rising sea level issue. BitsofScience.org discusses more scientific findings about the expansion of oceans in contribution to the rising sea levels. They also mention how the expansion of the water is easier to observe and predicate as it has less uncertainty than the melting ice caps: http://www.bitsofscience.org/sea-level-rise-thermal-expansion-7256/
The warming of oceans directly from sunlight varies with the seasons, particularly in the Arctic region (https://nsidc.org/cryosphere/quickfacts/seaice.html ). Arctic ice that forms on the water in the fall and winter reflects sunlight well whereas open water during the spring and summer is much less reflective. How well a surface reflects sunlight is called its albedo (https://nsidc.org/cryosphere/seaice/processes/albedo.html ). Sea ice has a high albedo; open water a low albedo. The Arctic ocean absorbs more energy from the sun if sea ice forms later in the fall and melts earlier in the spring. This increased energy absorption further warms the ocean, which decreases the thickness and extent of the ice formed in the fall and winter, which increases the ocean’s absorption of energy in the spring and summer, an unfortunate positive feedback loop (see https://oceanservice.noaa.gov/facts/sea-ice-climate.html ). Ice melting on land or in the sea contributes to changes in density of salt water, which may change ocean currents which in turn may influence changes in regional climates (see https://www.theenergymix.com/2015/07/02/global-warming-threatens-colder-climate-for-europe/.
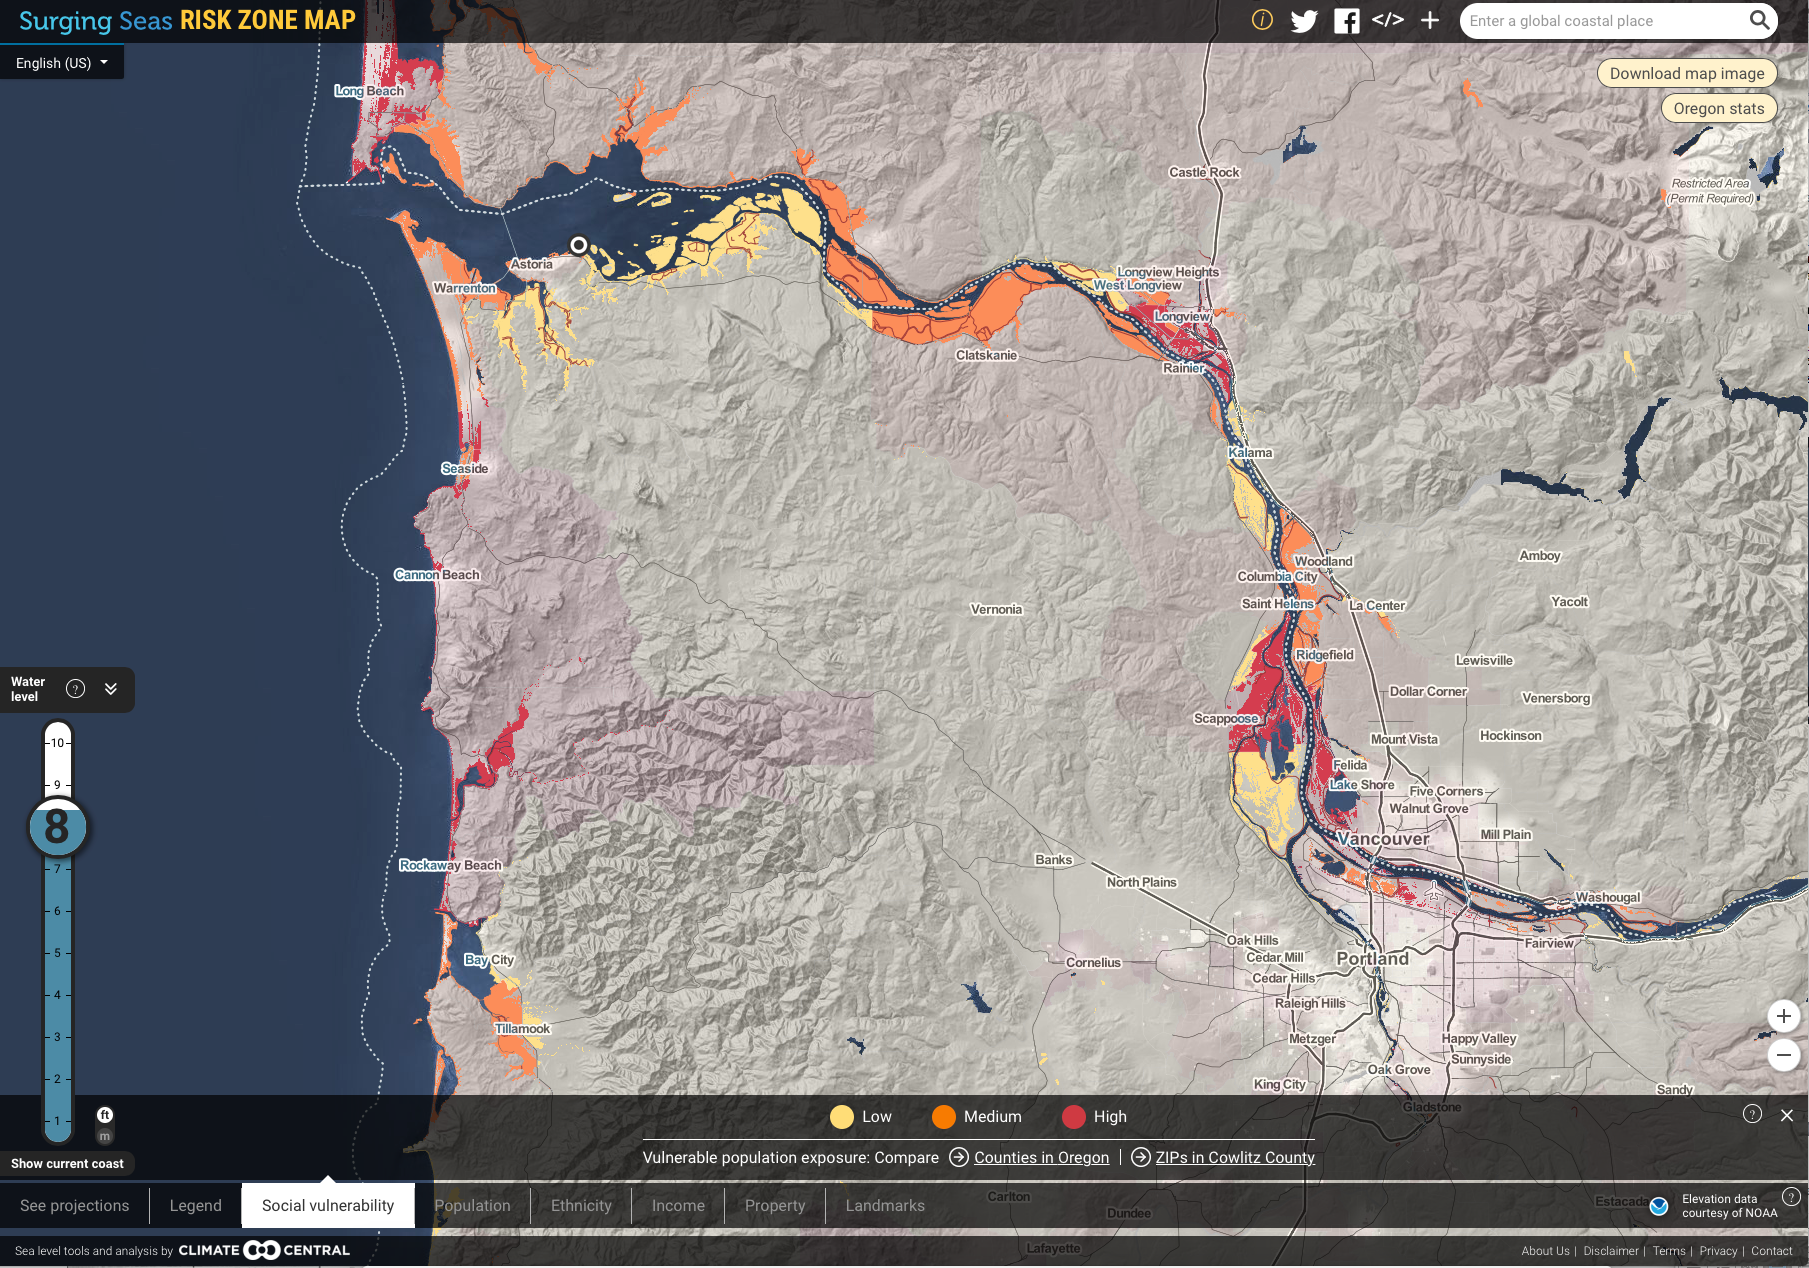
Source: Climate Central https://ss2.climatecentral.org/#10/45.8365/-123.3202?show=sovi&projections=0-RCP85-SLR&level=8&unit=feet&pois=hide
Another example of predictions for flooding during various scenarios of increasing sea levels is for New York City and New Jersey as shown in Fig. 4.37.
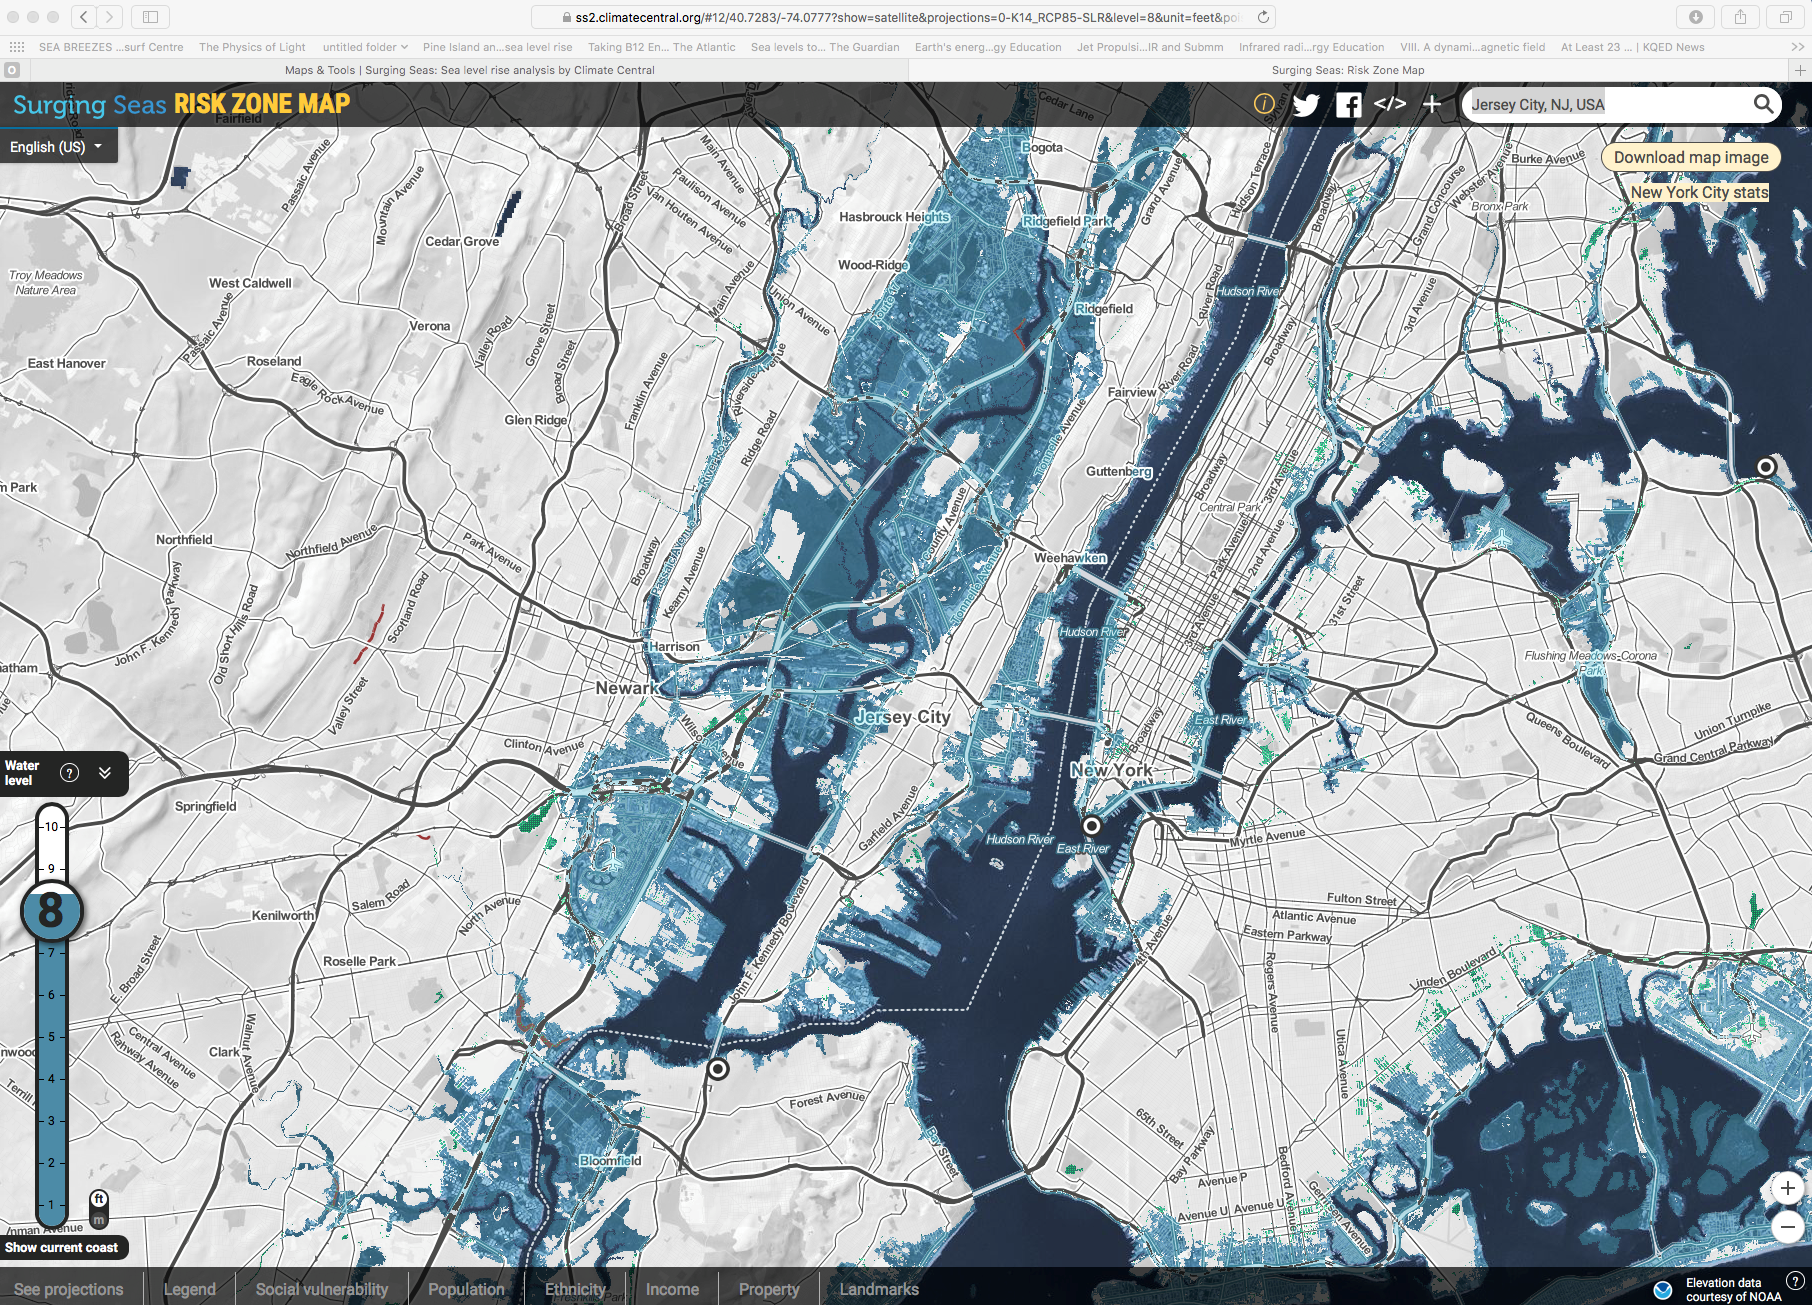
A news story about a storm, Hurricane Sandy, illustrates the conditions that may occur if surges from higher sea levels increase areas that become flooded:
http://www.nj.com/hudson/index.ssf/2012/10/chaos_in_jersey_city_as_flood.html
Some New York City subways flooded with millions of gallons of water during this storm. Repairs took five years: https://www.usnews.com/news/best-states/new-york/articles/2017-06-27/nyc-subway-station-reopens-after-being-flooded-by-sandy Predictions include a repeat of such storms every 25 years: https://www.theatlantic.com/science/archive/2017/10/climate-change-nyc-floods/543708/
Such experiences and predictions of repeats of such storms underlie the concerns being expressed that individuals, communities, and governments must to do whatever possible to reduce the causes of climate change.
Complete Table IV.3 to document what you have learned about the impact of global climate change on rising sea levels.
* Include one or more central ideas about rising sea levels that you learn from exploring other resources on the Internet with a friend or family member.
B. Exploring ways to reduce one’s own impact on global climate change
Question 4.13 What can you do to reduce your impact on global climate change?
Many of us are unaware of the connection between what seems like a small act on our part and its consequences on the amount of greenhouse gases emitted into the atmosphere.
Going on an errand when the need arises, for example, seems like a reasonable thing to do in order to make progress on the endeavor for which the need has become apparent. One sometimes makes a judgment, however: Is the time and effort to make a special trip worth it? If the trip involves driving a car, also consider: How much gasoline will the car use? According to the Energy Policy Initiatives Center of the University of San Diego School of Law, each gallon of gasoline releases about 19 pounds of carbon dioxide when burned. Each carbon atom in the gasoline combines with two atoms of oxygen in the air, so the product, a molecule of carbon dioxide, is much heavier than the carbon atom alone. If a typical fill-up is 18 gallons, then every fill-up of the tank is pumping about 340 pounds of carbon dioxide into the atmosphere! (https://epicenergyblog.com/2013/05/24/how-many-pounds-of-carbon-dioxide-co2-does-a-gallon-of-gasoline-produce/).
The University of Michigan Center for Sustainable Systems provides a comprehensive fact sheet about sources of greenhouse gas emissions due to everyday activities involving food, household appliances, and personal transportation. This fact sheet also provides suggestions for shifting to more sustainable actions (http://css.umich.edu/factsheets/carbon-footprint-factsheet):
Each mile driven by the typical passenger car, for example, puts 0.8 pounds of carbon dioxide into the atmosphere so walk, bike, carpool, or use mass transit whenever possible.
Washing laundry in cold rather than hot water can reduce carbon dioxide emissions by up to almost 15 pounds per load, depending upon the source of energy, temperature of the hot water, and type of washing machine.
As shown in Fig. 4.38, choosing what to eat for dinner can make a difference in the amount of carbon dioxide emitted in producing the different types of food eaten.
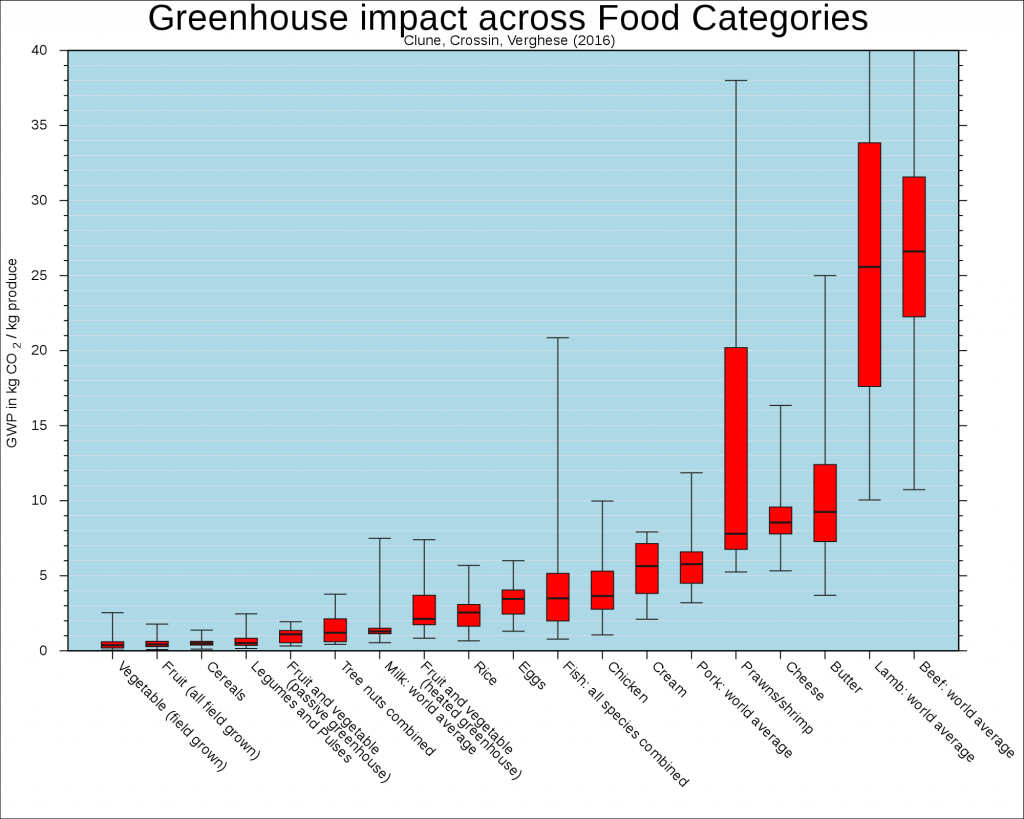
Stephen Clune, Enda Crossin, Karli Verghese: Systematic review of greenhouse gas emissions for different fresh food categories. Journal of Cleaner Production. 2016. DOI: 10.1016/j.jclepro.2016.04.082, Table 4.
Such comparisons are complex. Clune, Crossin, and Verghese (2016) have compared the mass of carbon-dioxide emitted from producing a given amount of various foods. Producing a kilogram of vegetables, fruit, or cereals, for example, results in much smaller emissions of carbon dioxide compared with producing a kilogram of lamb or beef meat.
Related information from a recent news item provides a vivid comparison of the number of people an acre of land can feed depending upon the kind of food that is grown there: Willie Riggs, director of Oregon State University Klamath Basin Research and Extension Center, told commissioners that an acre of wheat feeds 44 people per year; an acre of potatoes feeds 1,355 people per year; an acre feeding dairy cows provides enough milk for around 40,000 half-pint servings; and an acre feeding cows raised for meat feeds around eight people per year. https://www.heraldandnews.com/klamath/preparing-for-drought-commissioners-declare-drought-emergency/article_67c92bd1-0443-5520-931e-cb2428a1fc0d.html
(February 21, 2018 Harold and News, Klamath County)
If the increase in carbon dioxide emissions is causing the increase in global temperature and you want to try to decrease your own carbon footprint, how can you do that? There are several online carbon footprint calculators that can help estimate how many Earths would be needed if everyone lived like you do.
- Work on one or more of these carbon footprint calculators on your computer, discuss your findings with group members, and present some thoughts about these findings on a white board to discuss with the whole group.
|
Exploring Internet Resources for Calculating One’s Carbon Footprint What can you do to reduce your ecological / carbon footprint? |
|
| Environmental Protection Agency (EPA) | https://www3.epa.gov/carbon-footprint-calculator/ |
| Carbon Footprint LTD (UK) | https://www.carbonfootprint.com/calculator.aspx |
| Nature Conservatory: | https://www.nature.org/greenliving/carboncalculator/index.htm |
| World Wildlife Fund (now World Wide Fund for Nature) | http://footprint.wwf.org.uk |
| General information: | |
| Carbon Footprint Factsheet | http://css.umich.edu/factsheets/carbon-footprint-factsheet |
| Details about energy use in the United States | |
| Annual Energy Outlook | https://www.eia.gov/outlooks/aeo/index.php |
1. Examples of student work reflecting upon engaging a friend or family member in learning about living in more sustainable ways
A student chose to discuss with her mother some personal changes one can make:
For this assignment I decided to talk to my mom about global climate change. She remains the most skeptical person in my life when it comes to climate instability so I decided that she would be the most effective person to talk to. She is always asking “Okay so this is a problem but what the heck am I supposed to do about it?” We went to the website https://www.nrdc.org/stories/how-you-can-stop-global-warming and read through the article together and I wrote down all of the ideas about how to slow global warming that were provided. After we looked through all of the ideas, I asked her what she thought she could do in her life. She said that she could reduce the waste with groceries, unplug devices, buy better light bulbs, and reduce water waste. She said that she was amazed because she thought that in order to help reduce global warming she would have to raise millions of dollars or buy a new house. She had no idea that she could make small changes in her life. During this conversation she was able to “evaluate and communicate information” which is one of the NGSS Science and Engineering Practices. She was presented with this information and then she communicated to me how she believes that she will be able to make a change in her life. She also touched on the NGSS Crosscutting concept of “cause and effect” because we talked about how little changes that we make can have a combined positive effect on the environment.
Another student was able to use a carbon footprint website with a middle school friend:
https://www.earthday.org/take-action/footprint-calculator/
I chose to use this footprint calculator to engage my mom’s friend’s daughter, S. She is in middle school and knows all about carbon footprints and CO2emissions. I chose this website because I thought it was a fun activity and it shows how individuals are impacting the Earth. I asked S all of the questions on the survey. Since she does not drive or travel often, most of her impact came from the food she ate which she was very surprised at. She asked, “But I don’t have a car, and I recycle, and always turn off the lights. Why does it still say there would have to be 3 Earths [if everyone lived the same way]?” We then researched about the huge impacts that the food industry has on the environment. Especially the meat industry. I then told her about “Meatless Mondays” which we talked about in class and she was still so surprised at the fact that meat and packaged food had such a negative effect on the Earth. The footprint calculator was a really fun activity and gives you a lot of scary information, such as an “Earth Overshoot Date.” But it does not really show you ways you can reduce your impact on the Earth. I think users would benefit much more if there were a few tips at the end of the test.
I would say the NGSS Science and Engineering Practice that best fits this website is Analyzing and Interpreting Data. The footprint calculator asks for the data on your life, like how far you drive or use public transportation. It then uses that data to tell you how much of Earth’s resources you are using as an individual. The NGSS Crosscutting Concept that fits this site is definitely Cause and Effect. You enter in all of the ways you use the Earth’s resources and see how it directly affects the Earth’s productivity.
After looking at the footprint calculator with S, I started to wonder how I could teach my students about their ecological footprint without making them feel bad about the way they live. I know I felt really guilty when I took this test the first time.

