Unit 5: Exploring the Nature of Astronomical Phenomena in the Context of the Sun/Earth/Moon System
IX. Estimating the Tilt of the Earth
How curious are you about the tilt of the Earth? This section provides a detailed account of geometric arguments that underlie a surprisingly simple way to estimate the tilt of the Earth's axis. The only equipment you need would be a post and a way to measure its height and the length of its shortest shadow during equinoxes and solstices. If you enjoy puzzling through such geometrical arguments, read on. If not, perhaps skim this briefly to see what is here and then go on to the next section.
A. Developing and using mathematical representations to estimate the tilt of the Earth’s axis
Ancient peoples noticed seasonal changes in the lengths of shadows as well as in the Sun’s apparent path across the sky, particularly during equinoxes and solstices. A Greek astronomer, Eratosthenes (276-195 BC), for example, estimated the magnitude of the tilt by using such observations and his knowledge of geometry.
Question 5.38 How can one estimate the tilt of the Earth’s axis of rotation?
This section develops a geometrical approach to estimating the tilt of the Earth’s axis of rotation. This approach is surprisingly simple:
- Measure the maximum angular altitude of the Sun, angle α (alpha), at a given location during a solstice and during an equinox; then subtract one angle from the other.
- Or measure the maximum angular altitude of the Sun, angle α (alpha), at a given location during both solstices; then subtract the angle during the winter solstice from the angle during the summer solstice and divide by two.
- Or substitute (90º - the latitude of the gnomon) for the maximum angular altitude of the sun at an equinox and use this along with the maximum altitude of the Sun at one of the solstices as indicated in the box below.
Estimating those angles involves simply using a protractor, consulting data sources such as the tables presented in Figs. 5.56-5.59, or measuring the height of the gnomon (a post) and the length of its shadow at solar noon, dividing one by the other to find the angle's tangent, and identifying the angle with a calculator or trigonometry table.
1. Envisioning the tilt of the Earth’s axis of rotation
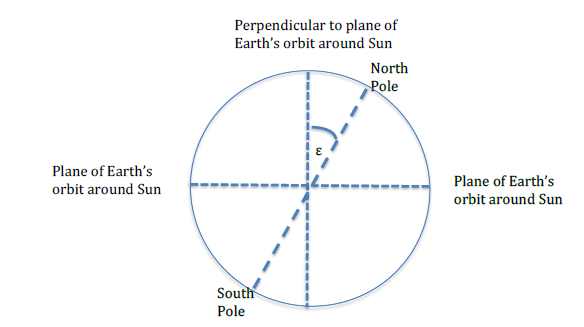
The tilt of the Earth’s axis is known as its obliquity and is represented by angle ε (the Greek letter epsilon). As shown in Fig. 5.70, the tilt is the angle ε between the Earth’s axis of rotation, which is represented by the large dashed line from the North Pole to the South Pole, and the vertical axis, which is represented by the small dashed vertical line. The vertical axis is perpendicular to the plane of the Earth’s orbit around the Sun. This discussion assumes the Earth is spherical. The small dashed horizontal line represents the projection of the orbital plane on this cross section of a spherical Earth.
2. Estimating the tilt of the Earth’s axis of rotation
How can you find out what the maximum angular angle of the Sun is at your location during a solstice or equinox?
- Find a vertical post such as a fence post whose height you can measure and whose shadow is visible on flat ground during the middle of a sunny day. Or create such a gnomon by positioning a straight stick vertically in a flat sunny area.
- Mark the tip of the gnomon’s shadow on the ground frequently during the middle of the day. Local solar noon occurs at the moment of the gnomon’s shortest shadow.
The maximum angular altitude of the Sun, angle α(alpha), varies as shown in Fig. 5.71.
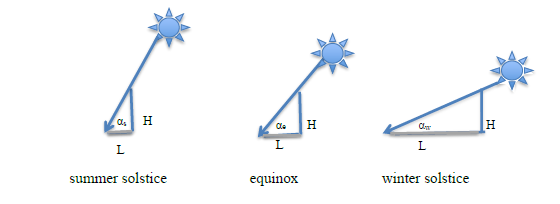
There are many ways to obtain values for the maximum angular altitude of the Sun, angle α (alpha), during the solstices and equinoxes at a particular location:
- Estimate the maximum angular altitude of the Sun, angle α, directly by placing a straight stick, representing a light ray, from the top of the gnomon to the tip of the shadow at local noon (time of shortest shadow) and use a protractor to estimate the angle α formed by the stick and the gnomon's shadow.
- Or measure the height of the gnomon, H, and the length of its shadow, L, at solar noon. Then:
- Draw a careful ray diagram: First draw a line of length H representing the gnomon perpendicular to a line of length L representing the shadow. Next draw a straight line representing a light ray traveling from the tip of the line representing the gnomon to the end of the line representing the shadow. Then use a protractor to estimate the angle α formed by the lines representing the light ray and the shadow on the ground.
- Or calculate the tangent of angle α:
Tangent of [latex]{\large \alpha = \frac{\text{height of the gnomon}}{\text{length of shortest shadow at solar noon}} = \frac{H}{L}}[/latex].
-
- Then with a trigonometry table or calculator with trigonometry functions (arctan, sometimes written as tan-1), identify the angle α for which H/L is the tangent.
- Or one can calculate angle αe at an equinox if one knows the latitude, angle [latex]\phi[/latex] (phi), of the location of the gnomon. Angle αe at solar noon during an equinox is related to the latitude of the location of the gnomon as stated here and derived under #4 below.
-
- Find a location’s latitude in a data base or if in the northern hemisphere, estimate the latitude φ by using a protractor to estimate the angular altitude of the star Polaris on a clear night. Polaris is close to where the Earth’s axis of rotation points in the northern sky. (A star does not appear near where the Earth’s axis points in the southern sky; this option for estimating a location’s latitude is not available there.) Substitute (90º – the latitude φ of the gnomon) for the maximum angular altitude of the sun at an equinox and use this along with the maximum altitude of the Sun at one of the solstices as indicated in the box below
- Another way to find the maximum angular angle of the Sun during the solstices and equinox is to use data for your location as predicted in tables such as in Figs. 5.56-5.59.
- Once you have estimates for the maximum angular altitude of the Sun, angle α, as discussed above:
- Estimate the tilt of the Earth’s axis, angle ε (epsilon), in at least one of the ways below:
Tilt of the Earth’s axis, angle ε:
ε = angle αs at summer solstice – angle αe at equinox
Tilt of the Earth’s axis, angle ε:
ε = angle αe at equinox - angle αw at winter solstice
Tilt of the Earth’s axis, angle ε:
ε = [latex]{\Large \frac{\text{angle} \, \alpha_s \text{at summer solstice } - \, \alpha _w \, \text{at winter solstice}}{2}}[/latex]
These mathematical relationships can be envisioned as shown in Fig. 5.72. Detailed derivations are presented in sections #5, #7, and #8 below.
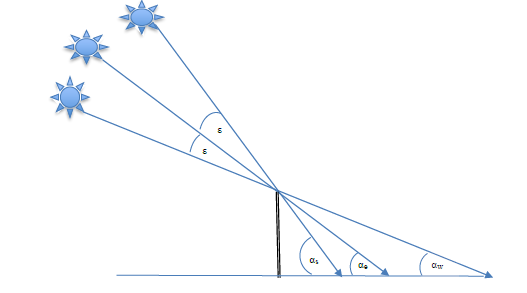
FIG. 5.72 Geometrical relationships among the tilt of the Earth ε and the maximum angular altitude of the Sun at the summer solstice, αs, equinox, αe, and winter solstice, αw. At our location, for example, as noted in the tables presented in Figs. 5.56 - 5.59:
angle αs at the summer solstice in Corvallis = about 69 º
angle αe at an equinox in Corvallis = about 45 º
angle αw at the winter solstice in Corvallis = about 22 º
Tilt of the Earth’s axis, ε:
ε = angle αs at summer solstice - angle αe at equinox
= about 69º - about 45 º
= about 24 º
Tilt of the Earth’s axis, ε:
ε = angle αe at equinox - angle αw at winter equinox
= about 45º - about 22 º
= about 23 º
Tilt of the Earth’s axis, ε:
ε = [latex]{\large \frac{\text{angle} \, \alpha_s \, \text{at summer solstice} - \, \alpha _w \, \text{at winter solstice}}{2}}[/latex]
= (about 69º - about 22 º)/2
= about 47 º/2
= about 23.5º
The currently accepted value for the tilt of the Earth, called its obliquity, is 23.4º (https://www.timeanddate.com/astronomy/axial-tilt-obliquity.html)
An example middle school science lesson plan exploring this relationship is provided in http://www.umass.edu/sunwheel/pages/lesson5.html (this refers to: http://www.umass.edu/sunwheel/pages/lesson1.html)
Deriving the relationship that the tilt ε equals the difference between two angles depends upon a series of geometrical arguments that are presented next.
3. Nuances in developing and using mathematical representations to estimate the tilt of the Earth’s axis of rotation
According to the heliocentric model, a nearly spherical Earth is revolving around the Sun each year in a nearly circular orbit that forms a plane. Diagrams representing the revolution of the Earth around the Sun can be confusing, however, because of the differing perspectives from which they are drawn.
As shown in Fig. 5.73, the perspective of a diagram of the Earth’s orbit around the Sun can be from above, looking down on a nearly circular orbit, or from the side, where the nearly circular orbit appears to be elliptical. Both of these diagrams are drawn from the perspective of the northern hemisphere where small arrows indicate the Earth to be orbiting counter-clockwise.
The diagrams in Fig. 5.73 differ, however, in how they portray a tilted axis, either tilted to the left or to the right. The direction of the tilt is consistent, however, either always toward the left or always toward the right. The statement “the axis tilts toward the Sun during summer and away from the Sun during winter” does not mean that the Earth’s axis is tilting back and forth. What is changing instead is where the Earth is in its orbit with respect to the Sun.
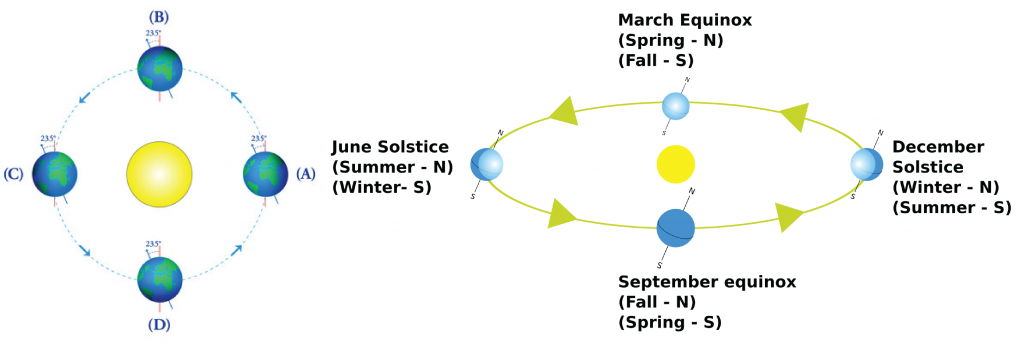
FIG. 5.73 Left: Earth in its orbit around the Sun as viewed from above, with tilt to the left. Right: Earth in its orbit around the Sun as viewed from the side, with tilt to the right.
https://www.illustrativemathematics.org/content-standards/tasks/1140 (CC BY-NC-SA 4.0)
https://commons.wikimedia.org/wiki/File:Orbital_relations_of_the_Solstice,_Equinox_%26_Intervening_Seasons.svg (CC0 1.0)The artist drew a circular orbit in the diagram on the left, from the perspective of a viewer looking down from above the solar system. The position for summer (A) is on the right, with the North Pole shown tilted toward the left, toward the Sun. The position for winter (C) is on the left, with the North Pole still tilted toward the left, but away from the Sun.
The artist drew an apparently elliptical orbit in the diagram on the right, from the perspective of looking from the side, outside of the position labeled for fall. The position for summer is on the left, with the North Pole shown tilted toward the Sun on the right. The position for winter is on the right, with the North Pole tilted toward the right, away from the Sun.
The perspective shown on the right is the perspective adopted in the solstice diagrams below. In the diagram for the summer solstice in the northern hemisphere, light rays come from the Sun on the right. In the diagram for the winter solstice in the northern hemisphere, light rays come from the Sun on the left.
From this perspective, however, the Sun’s rays during an equinox would be coming into or out of the plane of the paper and difficult to show in a diagram. Therefore, the perspective chosen for a diagram for an equinox is at right angles to those for the solstices.
4. Estimating latitude and maximum angular altitude of the Sun during an equinox
Question 5.39 Why does a location’s latitude, angle [latex]\mathbf{\phi}[/latex] = 90° - angle αe?
Fig. 5.74 is a cross section of a spherical Earth during the spring equinox, with the Sun’s rays coming from the right. The tilt of the Earth’s axis would be into or out of the plane of the paper and not visible from this perspective. Fig. 5.74 is not to scale. During an equinox, the Sun would appear to rise directly east, set directly west and be above the horizon for 12 hours everywhere on Earth (spring: March 19, 20, or 21 and autumn: September 22, 23, or 24).
A gnomon of height H is placed at a location with latitude [latex]\phi[/latex] (phi). Latitude tells how far above the equator a location is. The gnomon’s latitude, angle [latex]\phi[/latex], is the angle formed by a line to the center of the Earth from this location and a line from a point on the equator to the center of the Earth,
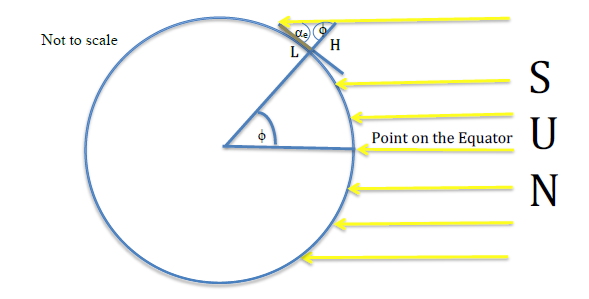
Fig. 5.74 Diagram representing the Sun’s rays shining on the Earth during the spring equinox. The gnomon casts a shadow of length L on the flat ground; the shadow is represented by the left part of the line perpendicular to the gnomon and tangent to the circle representing a spherical Earth. Rays of light from the Sun make an angle αe with the ground. Angle αe is the maximum angular altitude of the Sun during an equinox and its tangent is H/L at solar noon when L is the gnomon's shortest shadow.
The rays of light from the Sun are coming from so far away that they are considered to be parallel. Therefore, the angle formed by the rays of light and the gnomon is equal to the latitude, angle [latex]\phi[/latex], because alternate interior angles formed by a transversal are equal when the transversal cuts two parallel lines. (See: https://www.mathopenref.com/anglesalternateinterior.html ) The tangent of angle [latex]\phi[/latex] is L/H at solar noon.
The rays of light, gnomon, and shadow form a right triangle. The angles in a right triangle sum to 90°. Therefore: angel αe+ angle [latex]\phi[/latex] = 90° and
A location’s latitude, angle [latex]\phi[/latex] = 90° - angle αe where αe is the maximum angular altitude of the Sun during an equinoxThis equation will be helpful below in estimating the tilt of the Earth’s axis during the summer and winter solstices at the same location. Note also that at a latitude of angle [latex]\phi[/latex] = 0 degrees, at the equator, angle αe will equal ninety degrees. This means the Sun will be directly overhead and there will be no shadows at solar noon during an equinox at the equator.
At our location in Corvallis, Oregon, the height of a gnomon and its shortest shadow on an equinox are about equal in length and the angular altitude of the Sun is about 45º, the value provided in the tables shown in Figs. 5.56 and 5.58. The actual latitude for Corvallis is 44.5646º.
5. Deriving the tilt of the Earth in terms of the difference between the maximum angular altitudes of the Sun during the summer solstice, αs, and equinox, αe
Question 5.40 Why does the tilt, angle ε = angle αs at summer solstice – angle αe at equinox?
Representing the tilted Earth during a solstice is quite complicated and therefore developed here in a series of steps. In Fig. 5.75, the perspective is from the side and the Earth’s orbital plane is represented as perpendicular to the plane of the paper, with a spherical Earth emerging from the paper.
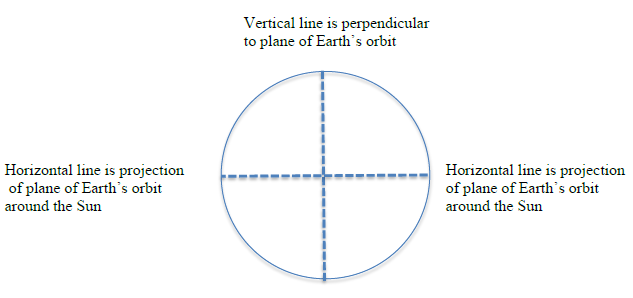
FIG 5.75 Cross-section of orbiting Earth with horizontal line representing projection of the plane of the Earth's orbit around the Sun. A cross-section of the spherical Earth is represented by a circle that has horizontal and vertical axes at right angles. The dashed horizontal line represents a horizontal axis through the middle of the sphere. This is a projection of a plane that represents the plane of the Earth’s orbit around the Sun. Envision a spherical Earth emerging from the plane of the paper.
The dashed vertical line represents a vertical axis through the middle of the Earth that is perpendicular to the plane of the Earth’s orbit around the Sun.
Next consider that the spherical Earth also has axes tilted by an angle ε (epsilon) as in Fig. 5.76. The top of the tilted vertical axis represents the North Pole of the Earth and the bottom of the tilted vertical axis represents the South Pole of the Earth. Both ends of the tilted horizontal axis represent points on the Earth’s equator.
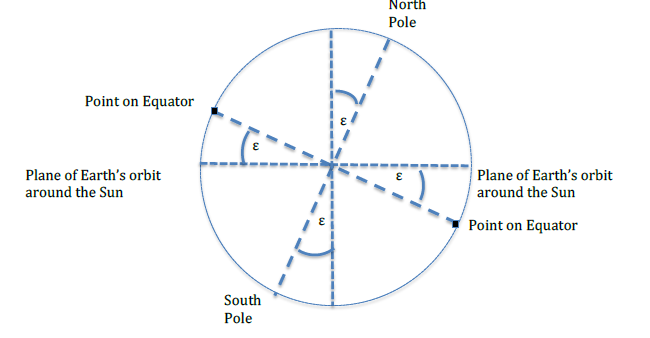
Fig. 5.76 Cross-section of a spherical Earth whose axis of rotation is tilted at angle ε (epsilon) with respect to the vertical to the plane of the Earth’s orbit around the Sun. Fig. 5.76 represents a cross-section through the center of a spherical Earth, rather than an attempt to represent the sphere in three-dimensions.
The dashed North/South pole line represents an axis through the center of the Earth. Envision the Earth rotating daily about this axis.
The dashed tilted horizontal axis represents the projection of the equator through the center of the rotating Earth.
The angle ε (epsilon) is the Earth’s obliquity or tilt of the Earth’s axis of rotation with respect to the vertical axis perpendicular to the plane of its orbit around the Sun.
The short dashed horizontal axis represents the projection of the plane of the Earth’s orbit around the Sun.
The short dashed vertical axis represents a vertical axis perpendicular to the plane of the Earth’s orbit around the Sun
Then consider a point that is at an angle [latex]\phi[/latex] (phi) between the Equator and the North Pole. As shown in Fig. 5.77, the angle [latex]\phi[/latex] (phi) represents the latitude of the point. The latitude [latex]\phi[/latex] (phi) of the point is the angle formed by a line from the point to the center of the Earth (red) and the line from a point at the Earth’s equator to the center of the Earth (red). Points on the equator are considered to be at latitude of [latex]\phi[/latex] = 0. Fig. 5.77 is not drawn to scale.
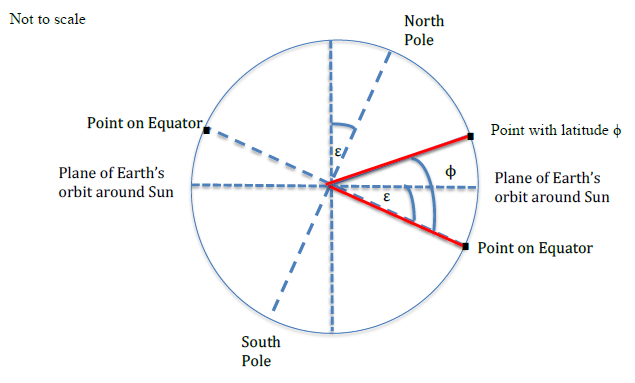
FIG. 5.77 Angle [latex]\phi[/latex] (phi) represents the latitude of a point with respect to a point on the equator. During the summer solstice (June 19, 20 or 21) in the northern hemisphere, the Earth’s tilted axis is pointing directly toward the Sun. During the summer solstice, the Sun rises the most north of east, moves highest across the sky, sets the most north of west, and is above the horizon for the most hours.
In Fig. 5.78, the yellow arrows represent light rays from the Sun, which is so far away that the incoming rays are essentially parallel. A gnomon at latitude [latex]\phi[/latex] has its shortest shadow at solar noon on the summer solstice. The shadow is represented by the gray half of the line representing the ground perpendicular to the gnomon.
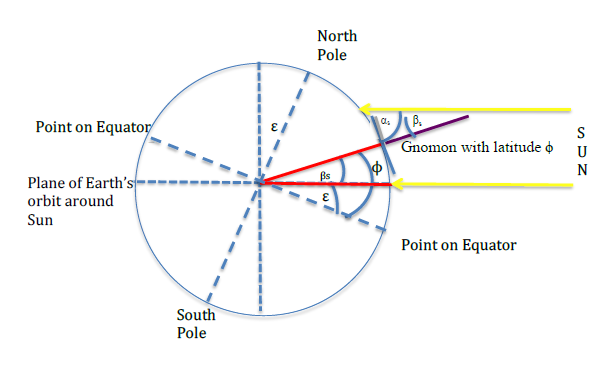
FIG. 5.78 Rays from the Sun and the gnomon create its shortest shadow at noon during the summer solstice in the northern hemisphere. Angle αs, angle alpha during the summer solstice, is the maximum angular altitude of the Sun. This angle is formed by the shadow and rays from the Sun at solar noon on the summer solstice.
Angle βs, angle beta during the summer solstice, is formed by the gnomon and rays from the Sun at solar noon on the solstice.
Angle αs + angle βs = 90° because the gnomon forms a right angle with the flat area on which the shadow falls.
Therefore, angle βs = 90° - angle αs
The angle βs formed by the gnomon and the light rays is congruent with the angle βs formed by the red line to the center of the Earth from the point and the red line representing the horizontal axis. These angles are congruent because they are alternate interior angles formed by a transversal cutting across two parallel lines.
As shown in Fig. 5.77, angle [latex]\phi[/latex] = angle βs+ angle ε
Solving for angle ε:
The tilt of the Earth, angle ε = angle [latex]\phi[/latex] - angle βs
Both of these angles can be rewritten in terms of other angles:
The latitude of the gnomon, angle [latex]\phi[/latex], is related to the maximum angular altitude of the Sun at the equinox as shown earlier in #4:
angle [latex]\phi[/latex] + angle αe = 90° so angle [latex]\phi[/latex] = 90° - angle αe
Angle βsforms a right triangle with angle αs:
angle αs + angle βs= 90° so angle βs = 90° - angle αs
If the tilt of the Earth, angle ε = angle [latex]\phi[/latex] – angle βs
Then: angle ε = (90° - angle αe) – (90° - angle αs)
= 90° - angle αe– 90° + angle αs
The tilt of the Earth, angle ε = angle αs – angle αe
As claimed above in #2, the angular tilt of the Earth, angle ε, can be estimated simply by measuring the height of a gnomon (person, post, upright stick…) and its shadow at solar noon during the summer solstice and during the equinox, dividing the height of the gnomon by the length of the shadow (H/L) for each observation, finding the angles for which these numbers are the tangents, and subtracting the maximum angular altitude of the Sun in the sky at the equinox from the maximum angular altitude of the Sun in the sky at the summer solstice.
6. Discussing the effect of the tilt of the Earth at several latitudes
Question 5.41 What are the Tropic of Cancer, Arctic Circle, and Antarctic Circle?
The tilt of the Earth’s axis of rotation causes unusual effects at several latitudes known as the Tropic of Cancer near the equator, the Arctic Circle near the North Pole, and the Antarctic Circle near the South Pole.
As shown in Fig. 5.79, at latitude [latex]\phi[/latex] equal to angle ε above the equator at solar noon on the summer solstice in the northern hemisphere, sunlight shines directly down on a gnomon (a person, post, upright stick…) that casts no shadow. A long red dashed line in Fig. 5.79 represents a projection of the Tropic of Cancer, a line around the Earth at this latitude of about 23.4°, the most northern latitude at which the Sun is ever directly overhead, where αs= 90°. The Tropic of Cancer was named about 2000 years ago when the Sun was perceived as being in the constellation with the Latin name for crab (https://www.space.com/16970-cancer-constellation.html) in its annual path along the zodiac in the geocentric model of the Sun revolving around the Earth. The word tropic is derived from a Greek word for turn. After the summer solstice, the Sun appears to turn back toward the south in where it appears to rise and set.
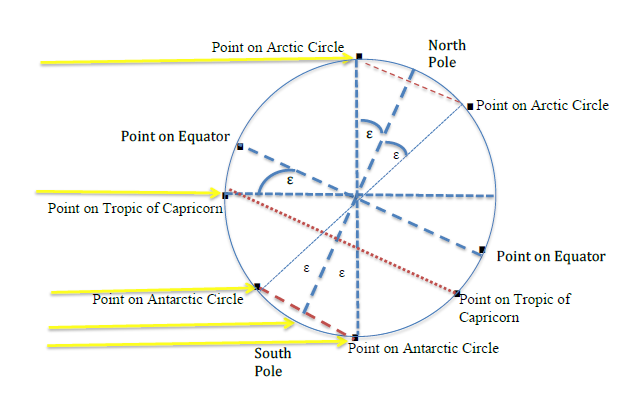
The Arctic Circle is the lowest latitude at which the Sun never seems to set during the summer solstice in the northern hemisphere, where αs = 0°. As shown in Fig. 5.79, this occurs at a latitude of an angle ε below the North Pole, about 66.5° above the equator. A short red line with thin dashes represents the projection of the Arctic Circle on this cross section through the middle of a spherical Earth.
At this same time (June 19, 20, or 21) but known as the winter solstice in the southern hemisphere, no sunlight reaches the South Pole or areas within the latitude of an angle ε above the South Pole, about 66.5° below the equator. A line around the Earth at this latitude, about -66.5°, is known as the Antarctic Circle. A short red line with thick dashes represents the projection of the Antarctic Circle on this cross section through the middle of a spherical Earth in Fig. 5.79.
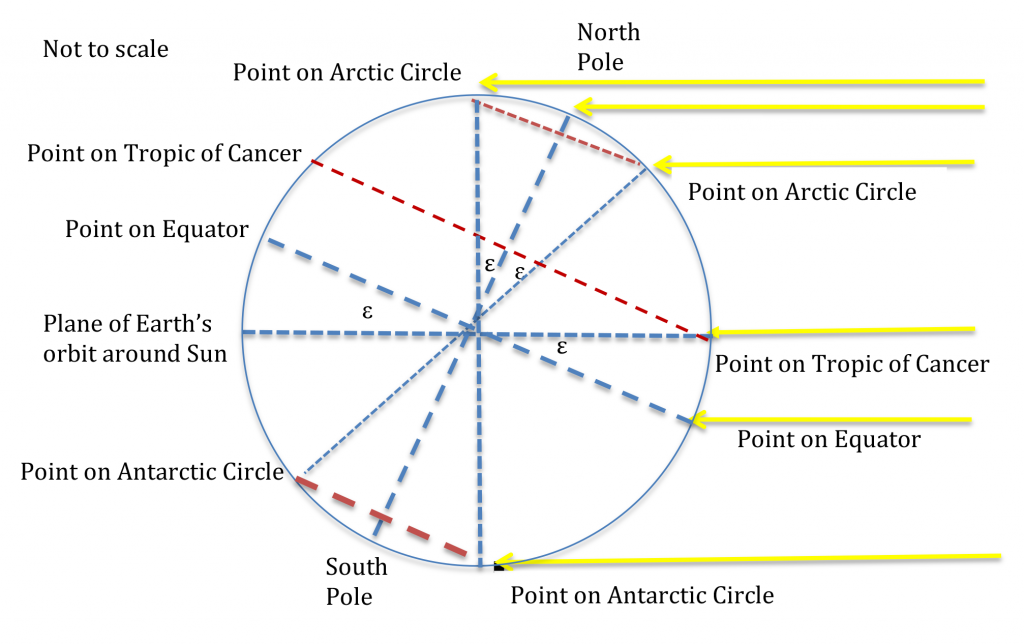
The diagrams in Figs. 5.74 and 5.79 can be puzzling in that both include a point at which light rays shine directly on a gnomon at solar noon so that the gnomon does not cast a shadow. Fig. 5.74 identifies this as a point on the equator. Fig. 5.79 identifies this as a point at a latitude angle ε above the equator, on the Tropic of Cancer. Both points appear as if they lie half-way between the top and bottom of a circle representing a cross section of a spherical Earth, a circle divided by a horizontal line representing the projection of the equator in Fig. 5.74 and a circle divided by a horizontal line representing the projection of the plane of the Earth's orbit around the Sun in Fig. 5.79.
The key to understanding this puzzle is to recognize that these diagrams are drawn from two different perspectives that represent different positions in the Earth’s orbit around the Sun. Fig. 5.74 represents the Earth in a position at an equinox. Fig. 5.79 represents the Earth in a position at a solstice. It can be difficult to envision the difference between these 3-dimensional perspectives as represented on these 2-dimensional diagrams.
Fig. 5.74 represents an equinox, when the Earth’s tilt is not evident in a cross section through the middle of a spherical Earth emerging from the paper. The tilted axis is pointing along the direction of travel, into or out of the plane of the paper, and only represented by a dot in the center of the circle. Fig. 5.79 represents the summer solstice in the northern hemisphere; the tilted axis is pointing perpendicular to the direction of travel and visible as the inclined axis of rotation in a cross section of a spherical Earth emerging from the plane of the paper.
7. Deriving the tilt of the Earth in terms of the difference between the maximum angular altitudes of the Sun during an equinox, αe, and during the winter solstice, αw
Question 5.42 Why does the tilt, angle ε = angle αe at equinox - angle αw at winter solstice?
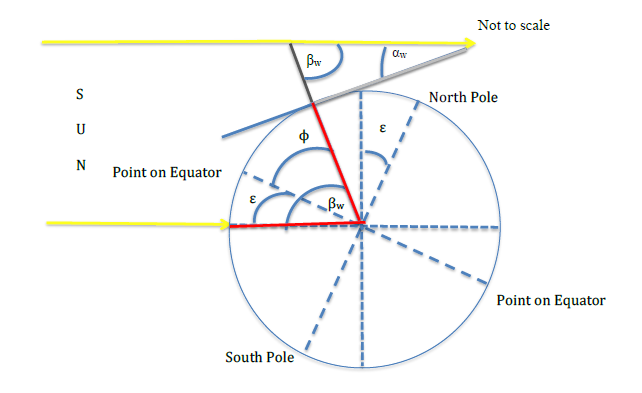
During the winter solstice in the northern hemisphere (December 20, 21, or 22), when the Earth’s axis of rotation points away from the Sun, the Earth is on the other side of the Sun from its position during the June solstice shown above in Fig. 5.78. The light rays from the Sun come in parallel from the opposite direction, as shown below in Fig. 5.80. During the winter solstice at this location in the northern hemisphere, the Sun rises the most south of east, moves the lowest across the sky, sets the most south of west, and is above the horizon for less than 12 hours.
Envision a gnomon placed perpendicular to the surface, at a location whose latitude is angle [latex]\phi[/latex]. In this case the Sun is at its smallest maximum angular altitude at this latitude and the gnomon casts a long shadow as shown in the gray line on the right part of the tangent to the surface of the Earth at the gnomon’s location as shown in Fig. 5.80. This figure is not to scale.
The angle βw (angle beta during the winter solstice) is formed between the ray from the Sun and the gnomon. This angle is equal to the angle βw formed by a line from the point to the center of the Earth and the horizontal axis because they are alternate interior angles formed by a transversal line intersecting with two parallel lines.
-
w
-
Both of these angles can be rewritten in terms of other angles:
Angle βwforms a right triangle with angle αw:
angle αw + angle βw = 90°;
Therefore: angle βw = 90° - angle αw
The latitude of the gnomon, angle [latex]\phi[/latex], is related to the maximum angular altitude of the Sun at the equinox as shown earlier in #4: angle [latex]\phi[/latex] + angle αe = 90° so angle [latex]\phi[/latex] = 90° - angle αe
If the tilt of the Earth, angle ε = angle βw - angle [latex]\phi[/latex]
Then: angle ε = (90° - angle αw) – (90° - angle αw)
= 90° - angle αw– 90° + angle αe
The tilt of the Earth, angle ε = angle αe– angle αw
As claimed above in #2, the angular tilt of the Earth can be estimated simply by measuring the height of a gnomon (person, post, upright stick…) and its shadow at solar noon during the winter solstice and during the equinox, dividing the height of the gnomon by the length of the shadow (H/L) for each observation, finding the angles for which these numbers are the tangents, and subtracting the maximum angular altitude of the Sun in the sky at the winter solstice from the maximum angular altitude of the Sun in the sky at the equinox.
8. Developing and using a mathematical representation to estimate the Earth’s tilt if a location’s latitude is not known
Question 5.43 Why does the tilt, angle ε = [latex]\frac{\textbf{angle} \, \alpha_s -\textbf{angle} \, \alpha_w}{2}[/latex]?
Although a location’s latitude is well known now, ancient astronomers did not need this information if they were able to measure the maximum angular altitude of the Sun, angle α, during both the summer and winter solstices at the same location.
Add the equations from summer and winter solstices:
From #5 above: angle ε = angle αe– angle αw
From #7 above: angle ε = angle αs– angle αe
Add: 2 (angle ε) = angle αe– angle αw + angle αs– angle αe
as claimed in #2. It is possible to estimate the tilt of the Earth, angle ε (epsilon), by measuring the maximum angular altitude of the Sun (angle alpha, α) during the summer and winter solstices at a particular location, subtracting the maximum angular altitude of the Sun during the summer solstice, angle αs, from the maximum angular altitude during the winter solstice, angle αw, and dividing by 2. One does not need to know the latitude of one’s location! This may be the method that the ancient Greek astronomer Eratosthenes used to estimate the tilt.
9. Discussing additional effects of the tilt of the Earth’s axis on several latitudes
Question 5.44 What happens at the Tropic of Capricorn, Antarctic Circle, and Arctic Circle?
As shown in Fig. 5.81, at solar noon on the summer solstice in the southern hemisphere (December 20, 21, or 22), sunlight shines directly down on a gnomon (a person, post, upright stick…) that casts no shadow at a latitude that is an angle ε below the equator. A long red dashed line in Fig. 5.81 represents a projection of the Tropic of Capricorn, a line around the Earth at this latitude of about - 23.4°. This is the farthest south of the equator that the Sun is ever directly overhead.
The Tropic of Capricorn was named about 2000 years ago when the Sun was perceived as being in the constellation with the Latin name for goat horn (https://www.thoughtco.com/tropic-of-cancer-tropic-of-capricorn-3976951) in its annual path along the zodiac in the geocentric model of the Sun revolving around the Earth.
The lowest latitude at which the Sun never seems to set during the summer solstice in the southern hemisphere is called the Antarctic Circle. As shown in Fig. 5.81, this occurs at a latitude of an angle ε above the South Pole (about 66.5° below the equator). A short red line with thick dashes represents the projection of the Antarctic Circle on this cross section through the middle of a spherical Earth.
At this same time but known as the winter solstice in the northern hemisphere, no sunlight reaches the North Pole or areas within the latitude of an angle ε below the North Pole (about 66° above the equator). A line around the Earth at this latitude is known as the Arctic Circle. A short red line with thin dashes represents the projection of the Arctic Circle on this cross section through the middle of a spherical Earth in Fig. 5.81.
