Unit 3: Considering the Influence of Light and Thermal Phenomena on Local Weather
IV. Developing Additional Central Ideas Based on Evidence
A sunny day at the beach can be a lot of fun. Why does the sand get so hot, however, while the water is so cool when the sun has been shining on both the sand and the water in the same way for the same time? Sometimes the sky clouds over and a breeze comes up in the afternoon. Why does that happen? This section explores how light and thermal phenomena sometimes affect the local weather during a sunny day at the beach.
A. Exploring the effects of properties of materials
Question 3.7 What happens when light shines on sand and water?
Equipment: To explore the effects of various properties on what happens when light shines on sand and water, use:
- Lamp with bendable stem,
- Light probe connected to a computer with graphing software or cell phone app for reflectivity (LUX meter)
- Black paper, white paper
- Two identical clear cups
- Balance
- Sand and water at room temperature
- Two temperature probes, and a computer or two regular bulb and tube thermometers with a range from at least about 15°C to 35°C.
[In a remote learning situation, brown rice, split peas, or dried beans can serve as a substitute for sand if necessary. A simple balance can be made with a board (a ruler will do) and something on which to balance it like a playground teeter totter. Set this up so it is balanced and then use two identical clear cups to put about half a cup of water on one side and as much sand as you need to balance it on the other side. ]
- What properties of sand and water might affect what happens when light from the Sun shines in the same way for the same time on both the sand and the water?
- In the Before section of a physics notebook page, record your ideas and predictions about the effect of properties explored in units 1 and 2: reflectivity, thermal conductivity, and specific heat. How can you explore the effects of these properties of sand and water on what happens when sunlight shines on a beach?
- To explore the property of reflectivity, move a light probe connected to a computer or a cell phone with a LUX meter app over black and white paper as well as over sand and water. Does the angle of reflection seem to matter?
- One way to explore differences in thermal conductivity and specific heat is to use equal amounts of the materials. Should one use equal amounts by mass or by volume?
- The property of specific heat is expressed in terms of the number of calories needed to change the temperature of one unit of mass by one degree Celsius so equal amounts by mass seem appropriate. Use a balance and identical clear cups to measure equal masses of sand and water at room temperature. Compare the volumes of the equal masses of sand and the water in the cups. What does this imply about the density of sand compared to the density of water?
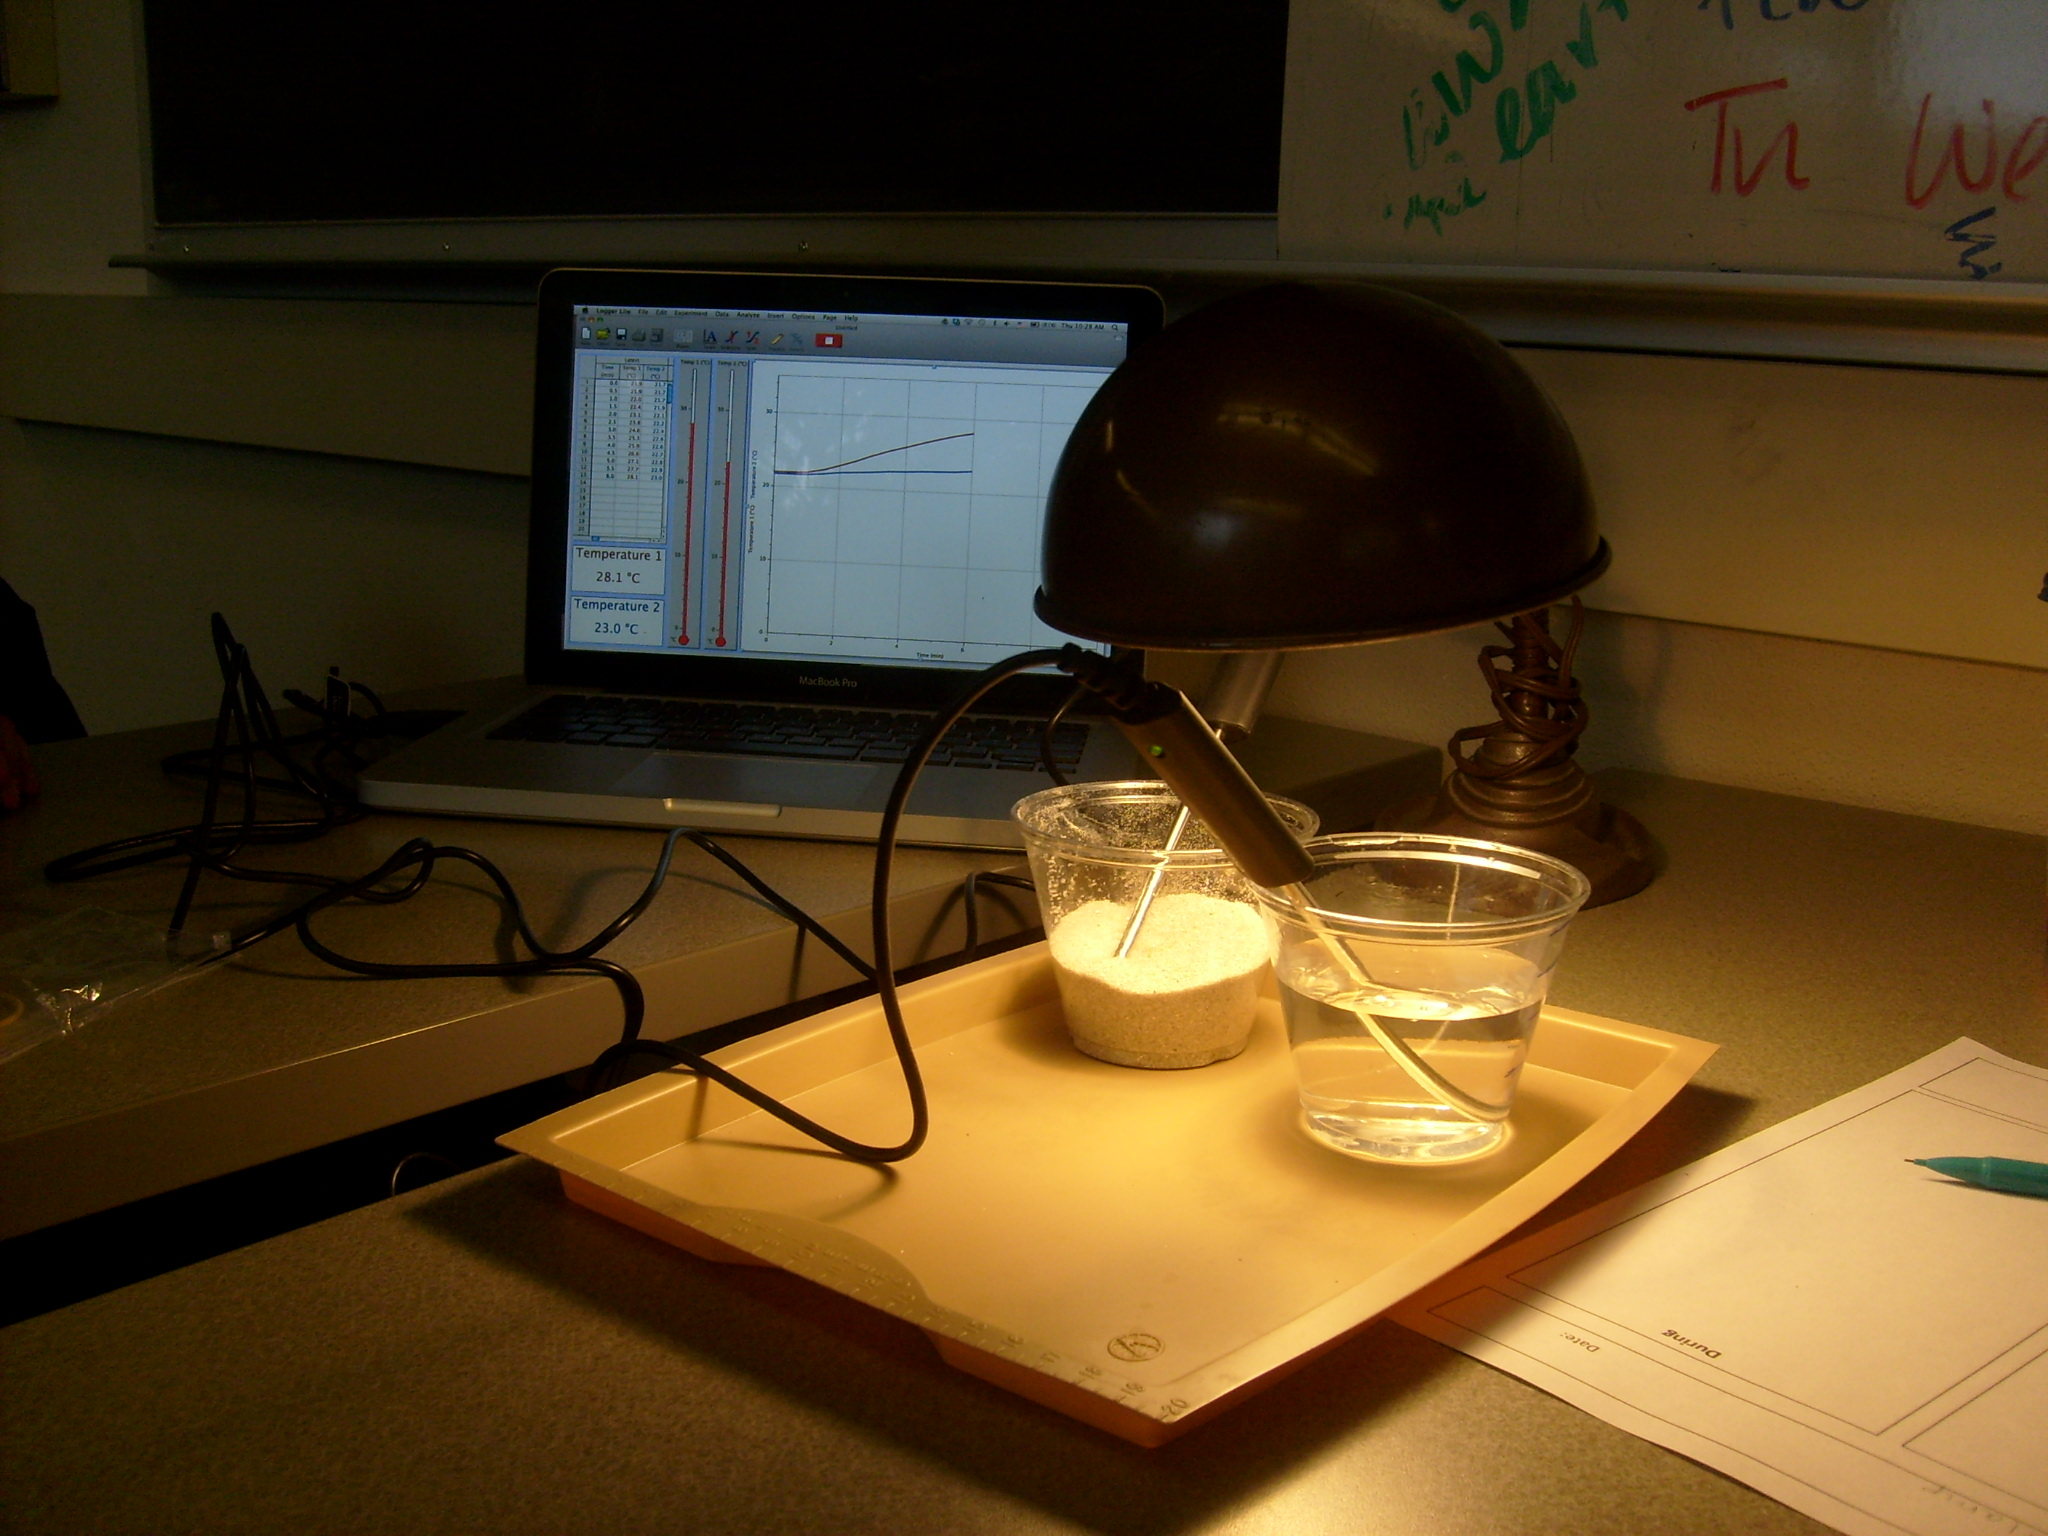
- Set up a lamp with curved stem shining from the same distance away on cups with equal masses of sand and water at room temperature.
- Put both temperature probes in the same cup of water to make sure that they read the same number if put in the same container. If the probes do not read the same or close to the same number (within 0.2ºC or so), calibrate them in the computer. If using regular thermometers, put both in the same cup of water and see if they read the same number; if they do not, record their temperatures and correct the final readings for this difference.
- Connect the two temperature probes to a computer and place one probe near the top of the cup of water and the other probe near the top of the cup of sand. Set the time on the computer for 900 seconds, about 15 minutes. (Or place regular thermometers near the tops of the sand and water and regularly read and record the temperatures while the lamp is shining on the cups of sand and water).
- Start the computer program (or use the regular thermometers) to record the initial temperatures of the sand and water. If both the sand and the water have been sitting in the same room for a long time, these temperatures should be the same or close to the same (within a degree or so). If they are not the same, record the temperatures and include this difference in interpreting your results.
- Turn on the lamp. Monitor the temperatures of the sand and water, by looking at the temperature versus time graphs on the computer (or regularly record the regular thermometer readings at least every minute).
- What do you observe after at least 10 minutes?
- Move the temperature probes (or thermometers) to near the bottom of the cups. What do you observe?
- In the During section of the physics notebook page, record your findings. Draw a picture of the temperature versus time graph and indicate the parts of the graph that represent the different materials that you tested. Note any vocabulary that is new to you.
- When interpreting the line graph, a helpful way to proceed is to consider:
- What does the vertical axis represent?
- What does the horizontal axis represent?
- What do the lines represent?
- What does the shape of the lines imply about the phenomena represented by the graph?
- Discuss your findings and formulate relevant central ideas. In particular, compare the slope of the graph for sand with the slope of the graph for water.
- Compare the change in temperature of the sand during ten minutes with the change in temperature of the water during ten minutes. How is this result related to a comparison of how much the temperature changes for each unit of time (one minute)? How is this result related to a comparison of how much the temperature changes for each unit of incoming energy from the lamp?
- Also discuss findings about the reflectivity of black and white paper and of sand and water. Compare your findings with those by other groups. Do they agree?
- Formulate central ideas based on the findings.
- In the After section of the physics notebook page, report these central ideas and the evidence on which they are based.
- Write a rationale that explains how the evidence supports the central ideas and why these are important.
- Also reflect upon this exploration such as what connections can you make to other experiences? How might you use what you learned in your own classroom?
- What are you still wondering?
Enter notes in Table III.3 representing these explorations:
Sketch of set upEvidenceCentral IdeasVocabulary
| TABLE III.3 Central ideas about the properties of materials | |||
|---|---|---|---|
| Materials differ in the property of reflectivity, how well they reflect light Corollary: Materials differ in how well they absorb light |
|||
| Materials differ in the property of thermal conductivity, how well they transfer energy | |||
| Materials differ in the property of density, how much mass there is in one unit of volume. Density and thermal conductivity are different properties that are not related. | |||
| Compare the change in temperatures, ∆T for sand and ∆T for water , during 10 minutes with the lamp shining equally on sand and on water. | Materials differ in the property of specific heat, how much energy is needed to change the temperature of one gram by one degree Celsius. | ||
| Materials differ in how their properties affect what happens when they convert light energy into energy that warms a surface. | |||
Complete documenting your exploration and writing a summary before looking at an example of student work. Also consider nuances about exploring the effect of thermal conductivity, specific heat, and reflectivity on what happens when light shines on sand and water.
1. Example of student work about what happens when light shines on sand and water
Figure 3.18 shows a student’s entries into a table about ideas about properties of materials. The student’s summary also appears below.
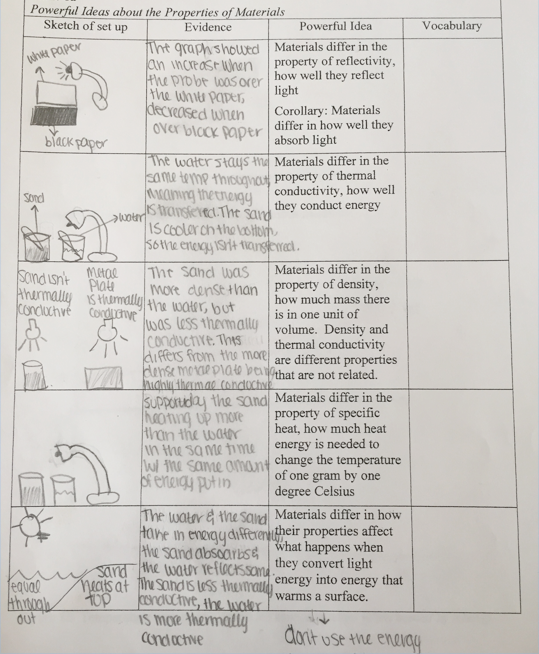
In row 1, the student drew a picture of a light shining on white and black paper. The student wrote, The graph showed an increase when the probe was over the white paper, decreased when over black paper.
In row 2, the student drew a picture of a cup with sand and a cup with water, each with a temperature probe, and a light shining on the cups. (Note that the student indicated more rather than less sand than water.) The student wrote, The water stays the same temp throughout, meaning the energy is throughout. The sand is cooler on the bottom so the energy isn’t transferred.
In row 3, the student drew a picture of a cup of sand and a metal plate, with a light shining on each, and notes sand isn’t thermally conductive and metal plate is thermally conductive. The student wrote, The sand was more dense than the water, but was less thermally conductive. This differs from the more dense metal plate being highly thermally conductive.
In row 4, the student drew a picture of a light shining on a cup with sand and a cup with water. The student wrote, Supported by the sand heating up more than the water in the same time with the same amount of energy put in. (Note that the student again drew containers with higher rather than lower sand than water).
In row 5, the student drew a sun shining on a beach with sand and water, with labels equal throughout in the water and sand heats at top in the sand. The student wrote, The water and the sand take in energy differently, the sand absorbs and the water reflects some. The sand is less thermally conductive, the water is more thermally conductive. The student also drew a light and a dark arrow with the note don’t use the energy.
The student wrote the following rationales for the ideas claimed in the third column of the table:
Materials differ in the property of reflectivity, how well they reflect light. Corollary: Materials differ in how well they absorb light. …The white paper showed an increase on the graph, because it has greater reflectivity and the black paper showed a decrease on the graph, because it has lower reflectivity. We also compared the reflectivity of the dry sand and water with a light sensor. The reflectivity of water depends upon the angle at which the light source is shining on the water. Water is highly absorbent when the Sun in high and more reflective when the sun is shining on it at an angle…
Materials differ in the property of thermal conductivity. Thermal conductivity is how well a material transfers energy. The second row of (the table) shows the light source shining equally on the equal masses of water and sand. For ten minutes the light was shining over both cups with temperature probes in the cups.
After ten minutes, the water warmed from an initial temperature of 21.6ºC to 22.9ºC throughout the cup of water. The temperature near the top of the sand was 31.1ºC. The temperature near the bottom of the sand was the same as the initial temperature, which was 24.4ºC. I would infer that the water has higher thermal conductivity because the temperature was the same throughout the substance, meaning energy was transferred from the top to the rest of the liquid.
The same amount of light shined for the same amount of time on the same mass of water and dry sand, but the temperature of the sand was hotter on the top than the bottom. The water was the same temperature throughout, therefore the sand kept more of the energy it absorbed near the surface of the sand.
Materials differ in the property of density, how much mass there is in one unit of volume. The third row of (the table) describes this idea. When I was filling the cups with equal masses of sand and water I had to add some sand. I added a little bit of sand and put the cup on the scale, which showed the sand weighed much more than the water. I poured a little of the sand out and scale showed the sand cup was much lighter than the water. The little bit of the sand made a big difference, showing sand is dense. The sand was denser, so there was less sand (by volume) in the cup than water in the cup. If sand was added to water, the sand would sink to the bottom, demonstrating the sand is denser. Water is the standard, so the mass of one gram of water has a volume of one cubic centimeter at 4ºC. The density of the sand is approximately 1.6 grams for each cubic centimeter.
The metal plate appeared denser than the Styrofoam plate that we experimented with before. The metal plate had more thermal conductivity than the Styrofoam plate, which was demonstrated by the cool feeling we experienced when touching the metal plate. When touching the Styrofoam plate there was no temperature change felt. The sand was denser than the water, but as demonstrated above, the sand had lower thermal conductivity. This is evidence that there is no relation between the properties of density and thermal conductivity.
Materials differ in the property of specific heat, how much energy in calories is needed to change the temperature of one gram by one degree Celsius. The fourth row of (the table) represents this idea. Water is the standard, meaning one calorie is needed to change the temperature of one gram of water by one degree Celsius, at standard atmospheric pressure and 20ºC. This can be shown by cwater =1 cal/(g ºC). The specific heat of sand is smaller; sand only needs approximately 0.2 calories to change one gram of sand by one degree Celsius. This can be represented by csand =0.2 cal/(g ºC).
These ideas can be used to decide which material changes temperature more. If the sand and the water have the same mass, the sand will change temperature more. Less energy is needed to change one gram of sand by one degree Celsius than is needed for water; it only takes 0.2 calories to change one gram of sand one degree Celsius while water needs one calorie to change one gram of water by one degree Celsius. One calorie of energy from the Sun will change one gram of water one degree Celsius. For sand, one calorie of energy from the Sun will change one gram of sand by five degrees Celsius. Therefore, sand will change temperature by five degrees more.
Materials differ in how their properties affect what happens when they convert light energy into energy that warms a surface. Two cups were filled with equal masses of water and dry sand. These cups were placed under a light where the light could shine on them equally for an equal amount of time. When light shined equally on the equal masses of the sand and water, the water heated evenly throughout the cup. The sand was warmer near the surface but remained the initial temperature near the bottom of the cup. The sixth row of (the table) shows this idea.
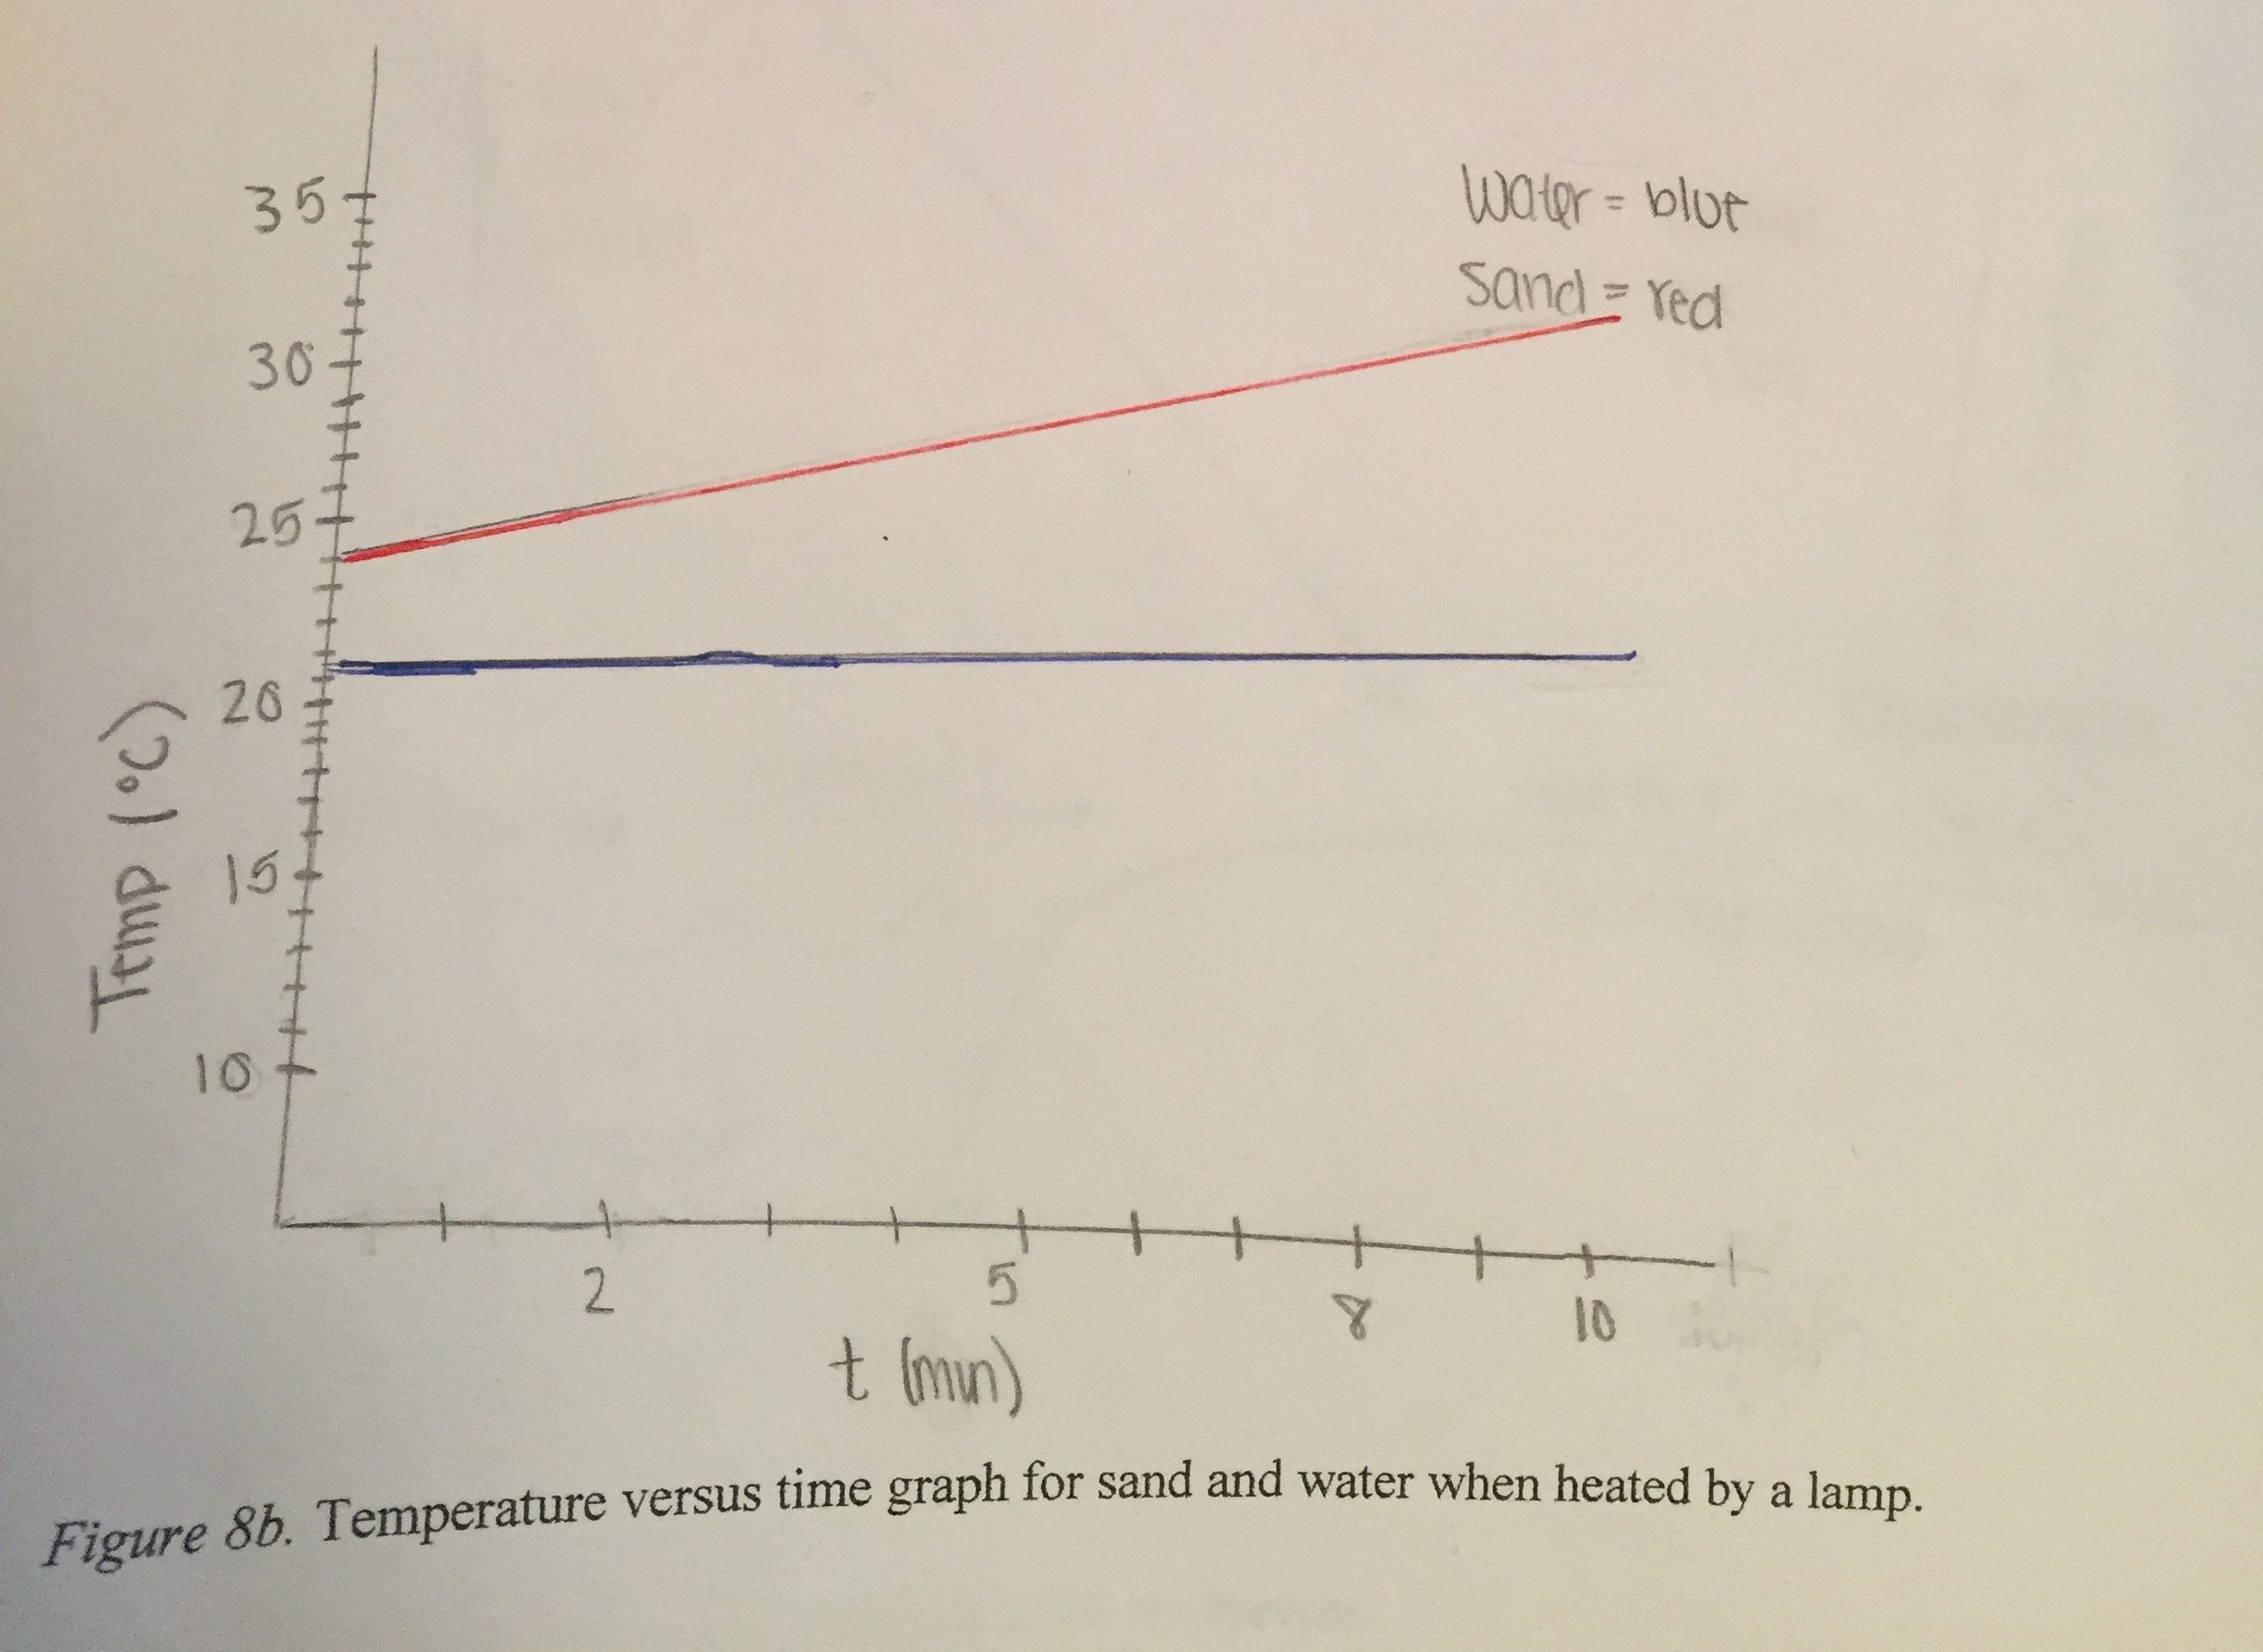
Figure (3.19) shows the graph that represents our findings over ten minutes. The graph shows both water and sand increased in temperature gradually and constantly. The temperature of the sand increased more than the temperature of the water. The initial temperature of the sand was 24.4ºC, which increased to 31.1ºC. The initial temperature of the water was 21.6ºC which increased to 22.9ºC.
Water is more thermally conductive than sand. This is demonstrated by the temperature of the water being the same throughout the cup. Sand has a low thermal conductivity, demonstrated by the differences in temperature between the surface of the sand and the bottom of the sand.
The temperature of the sand (near the surface) increased more than the temperature of the water even though they were exposed to the same amount of energy for the same amount of time. This demonstrates that sand has a smaller specific heat. One gram of sand can change one degree Celsius with only 0.2 calories of energy, which means the sand needs less energy than water to change the same amount in temperature, which is shown on the graph.
Physics student, Spring 2016
2. Nuances about the exploration of effects of properties of materials
(a) Noticing the lack of a relationship between the properties of thermal conductivity and density.
As this student noted clearly above, this exploration refutes the tempting inference that thermal conductivity and density are related. Although the more dense metal blocks were also more thermally conductive in the exploration in Unit 2, here the less dense water was more thermally conductive than the more dense sand.
The temperature of the sand near the bottom of the cup was lower than the temperature of the sand at the top of the cup. From this we inferred that the energy absorbed by the sand near the top of the cup stayed near the top of the cup rather that spreading throughout the sand, that sand has a low thermal conductivity. The temperature of the water near the bottom of the cup, however, was the same as the temperature of the water near the top of the cup. From this we inferred that some of the energy absorbed by the water near the top of the cup flowed throughout the water in the cup rather than staying on the surface, that water has a high thermal conductivity.
These results indicate that in this case the more dense material, sand, had a lower thermal conductivity than the less dense material, water. This is opposite to the earlier result in Unit 2 in which we inferred that the more dense materials, the 2 metals, had higher thermal conductivities than the less dense materials, wood and Styrofoam. These contradictory results indicate that there is no relation between the properties of thermal conductivity and density.
(b) Interpreting the difference in initial heights of the lines in Fig. 3.19. Visually it is clear from the graph that the temperature of the sand changed more rapidly than the temperature of the water. The lines do not start at the same height, however, as would be expected if the sand and water started at the same temperature. It is not clear whether the sand and water were at different temperatures at the start of the experiment, whether the temperature probes were not calibrated so they did not read the same temperature although the sand and water actually were at the same temperature, or whether the temperatures of the sand and water were already different at the instant in time that the computer started displaying the graph because the students turned on the light before they started the computer program recording the temperature probes. It is important to turn on the computer first, to document that the sand and water are starting out at the same temperature. Then turn on the light to start the warming process. It is clear from the graph, however, that the temperature probe in the sand increased in temperature much faster than the temperature probe in the water.
(c) Interpreting the slopes of the lines in Figs. 3.17 and 3.19. The vertical axes of the graphs shown in Fig. 3.17 and Fig. 3.19 represent the temperature of the sand (red line) and water (blue line). The horizontal axes represent the time that the lamp was shining on the sand and water. The height of the line at any point represents the temperature at that instant of time. The slope of the line represents how much the height changed during some time interval. The horizontal axis is marking off time in one-minute time intervals. For these graphs, the slope of the line represents how much the temperature was changing during one minute of time.
Because the lamp was the same distance away from the sand and water, the horizontal axis represents not only the time that the light was on but also the incoming energy shining on the sand and water. Therefore the slopes of the lines also represent how much the temperatures of sand and water were changing for each unit of incoming energy.
The straight lines indicate that these slopes were constant, that the temperature of the sand was changing at the same rate at the end of the ten minutes as it was changing at the beginning of the ten minutes that the light was shining on the cups of sand and water. The same was true for the water, that the rate of change of temperature for each unit of time was constant for the water.
(d) Comparing the slopes of the lines. How did the slope of the line for the sand compare to the slope of the line for the water? Clearly the slope of the red line, representing how much the temperature changed for sand for each unit of energy, was greater than the slope of the blue line, representing how much the temperature changed for water for each unit of energy absorbed.
(e) Relating the slopes of the lines to the specific heats of sand and water. How does this result for the slopes of the lines relate to a comparison of the specific heats of sand and water? As discussed in Unit 2, a material’s specific heat is the amount of energy needed to change the temperature of a mass of one gram of the material by a temperature of one degree C. A table of specific heats (See http://www.engineeringtoolbox.com/specific-heat-capacity-d_391.html ) lists the specific heat of sand as 0.19 cal/(gºC) and the specific heat of water as 1.00 cal/(gºC).
If the specific heat of sand is about 0.2 cal/ gºC, how much would the temperature of 1 gram of sand increase if it absorbed 1 calorie of energy? If a gram of sand increases in temperature by 1ºC when it absorbs 0.2 cal of energy and the sand absorbs (0.2 cal + 0.2 cal + 0.2 cal +0.2 cal + 0.2 cal) of energy, how much does its temperature increase?
If the specific heat of water is 1.0cal/gºC, how much would the temperature of 1 gram of water increase if it absorbed 1 calorie of energy?
For each calorie of energy absorbed by a gram of sand, the temperature of the sand goes up about 5 degrees C compared to one degree C for each calorie of energy absorbed by a gram of water. This major difference in the properties of sand and water has major implications for what happens when light from the Sun shines on sand and water at the beach! The difference in their specific heats is the primary cause of why the sand gets hot and the water stays cool during a sunny day at the beach.
(f) Considering the effect of the property of reflectivity. In our course, students sometimes obtain different results for the property of reflectivity; some report the water reflects more than the sand and some less. It seems to depend upon the angle at which they hold the light probe. To what extent is this a problem for interpreting results?
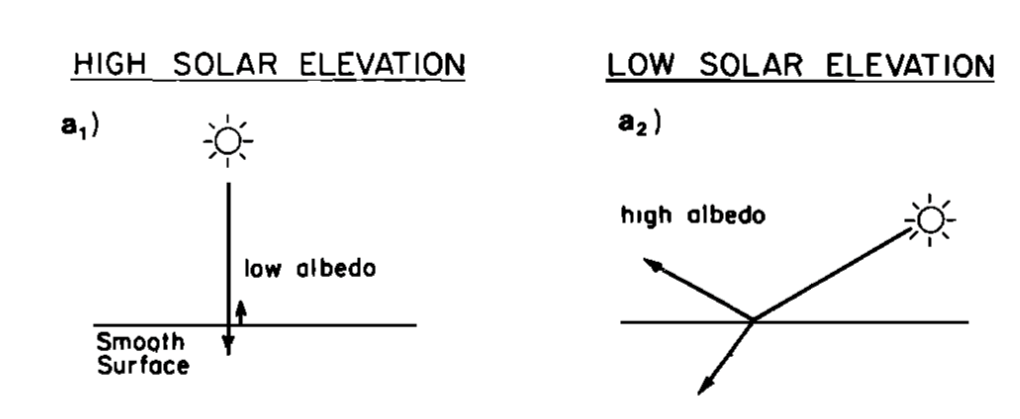
The percent of incident light reflected is called a material’s albedo. Water’s albedo depends upon many aspects, including whether the sun is shining straight down (low albedo) or at an angle (high albedo) as shown in Fig. 3.20. The water absorbs more of the Sun’s energy when the Sun is high in the sky than when the Sun is rising or setting.
https://atmos.washington.edu/~mcmurdie/articles/katsaros_etal_1985.pdf, p. 7314. Kristina B. Katsaros, Lynn A. McMurdie, Richard J. Lind, and John E. DeVault, “Albedo of a water surface, spectral variation, effects of atmospheric transmittance, sun angle and wind speed,” Journal of Geophysical Research, 90(C4), 7313-7321 (July 20, 1985).
Water’s albedo also depends upon its state, whether it is liquid in the ocean, bare ice, or ice with snow. Fresh snow reflects the most, about 90%, whereas liquid water in the oceans reflects very little, about 6% as shown in Fig. 3.21. Desert sand reflects about 40% (http://www.climatedata.info/forcing/albedo/).
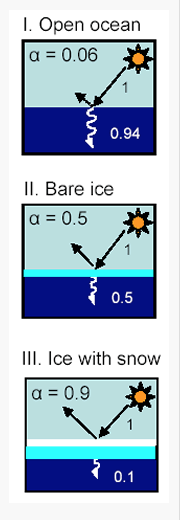
Is there ever a time when the water warms up more than the sand because of these differences in reflectivity? If one calorie of energy from light from the Sun falls on one gram of water and all of that energy is absorbed by the water, its temperature will go up at most 1ºC because its specific heat is 1.0 cal/(gºC).
What happens when one calorie of energy from light from the Sun falls on one gram of sand? If the sand absorbs all of the energy, we saw above that its temperature goes up 5ºC because its specific heat is only 0.2 cal/(gºC).
If the sand reflects 40% of the incoming energy, however, how much does one gram of sand’s temperature go up if it receives 60% of the incoming energy? If one gram of sand only needs 0.2 calories to increase in temperature by one degree Celsius and it absorbs 0.2 cal + 0.2 cal + 0.2 cal = 0.6 cal, its temperature will go up 3ºC.
Even in this worst case, with the water absorbing the most it can and the sand reflecting the most it can and absorbing the least it can, the sand will increase in temperature much more than the water. This confirms that the differences in reflectivity are not very important; what matters more is the difference in specific heats.
(g) Considering the relative importance of various properties. Thinking about what properties and processes might matter during an exploration is an important part of doing science. Figuring out which matter more than others is useful so that one can focus on the causes of major effects before investing a lot of time and effort in exploring less important effects.

