4
Chapter 4
Unified Modeling Language Class and Sequence Diagrams
After a discussion of diagrams in general, this chapter covers two common Unified Modeling Language (UML) diagram types: class diagrams and sequence diagrams.
4.1 How Diagrams Help
Diagrams can help in at least two major ways:
- They can help you plan software you will create. Once you’ve created diagrams for planning your software, you can use them to communicate to the development team what will/should be implemented and decide (evaluate) whether your plans are any good (e.g., are clear, are logical, reflect your project’s desired quality attributes, and so on).
- They can help you describe software you’ve already created. If your software is already created, diagrams are good for documentation and, as mentioned above, for evaluating how satisfactory your software is. The purpose of including diagrams in documentation is to communicate something about your software to somebody. There are many different audiences you could be trying to communicate with.
Example audiences for your diagrams include other developers on the project, your supervisor or manager, developers who might be interested in joining the team, developers who want to integrate with your system, curious end users, and students of software engineering. Depending on the integrated development environment (IDE)/tools you’re using, diagrams can be automatically generated from your code, which helps make documentation maintenance easier and more likely to happen.
4.2 What Diagrams Must Do Well
To be helpful, diagrams must communicate clearly and at an appropriate level of detail for your intended audience. If your intended audience does not understand your diagram—or misunderstands it—your diagram has failed.
4.3 What Is UML?
Unified Modeling Language is a family of graphical notations for describing and designing software through diagrams. It is especially applicable to object-oriented software, but some parts of UML are applicable to many types of software. Different UML notations are used for different types of UML diagrams, each of which has a specific purpose. UML was first published in 1994, became a standard of the Object Management Group (OMG) in 1997, and became an ISO standard in 2005. UML is currently on version 2.
4.4 Why Use UML?
There are multiple benefits of creating diagrams using UML:
- UML gives you (1) notation for designing software so that your implementation will be structured and (2) notation for describing the existing design of software so that you can evaluate whether the design is any good.
- UML diagramming forces you to think about software design in a structured way. When people try to design software in their minds, they can be sloppy about it—thinking about the aspects of the design they want to think about. UML can encourage you to face the trickier parts of software design.
- UML diagramming gives you a view of the software at different levels of design (e.g., class level, component level, package level).
- UML provides a common language between software professionals. Because UML is well known, it gives developers and managers a way to communicate in detail about software. That being said, expect to encounter variations in how UML notation is used—it can be difficult to remember UML notation; developers will make mistakes or adapt the notation to their own way of thinking. It can help to provide a legend or explanation of what your notation means.
- UML diagrams give you a way to tell people about your software’s structure without asking them to look through code. This is nice, for example, when onboarding new developers or communicating with managers.
4.5 Why NOT Use UML?
There are some drawbacks to UML diagramming:
- People tend to vary their UML notation, which can cause confusion. Some tips for avoiding that problem include (1) keeping your notation basic and (2) explaining more complex notation.
- Getting UML notation right can take a lot of time. Remember that diagrams are for communicating. If creating the diagram takes longer than explaining the code a different way, the diagram isn’t helping.
- UML diagrams can require a lot of maintenance. If your software design changes frequently, so must your UML diagrams if you want them to be accurate. Fortunately, some IDEs can generate some UML diagrams from your code.
4.6 Class Diagrams
A class diagram describes a system’s classes and the static relationships that exist among them. Class diagrams also show properties and operations of a class. Properties represent the structure of a class (e.g., instance variables) and operations represent the functionality provided by the class (e.g., methods; Fowler, 2004).
Figure 4.1 shows an example class diagram. In the diagram, there are relationships between three classes: Customer, Order, and SharedOrder. An Order has one Customer—but the same Customer can be on multiple Orders. A SharedOrder is a type of Order that can have multiple Customers. The classes have attributes (e.g., id) and operations (e.g., getId()).
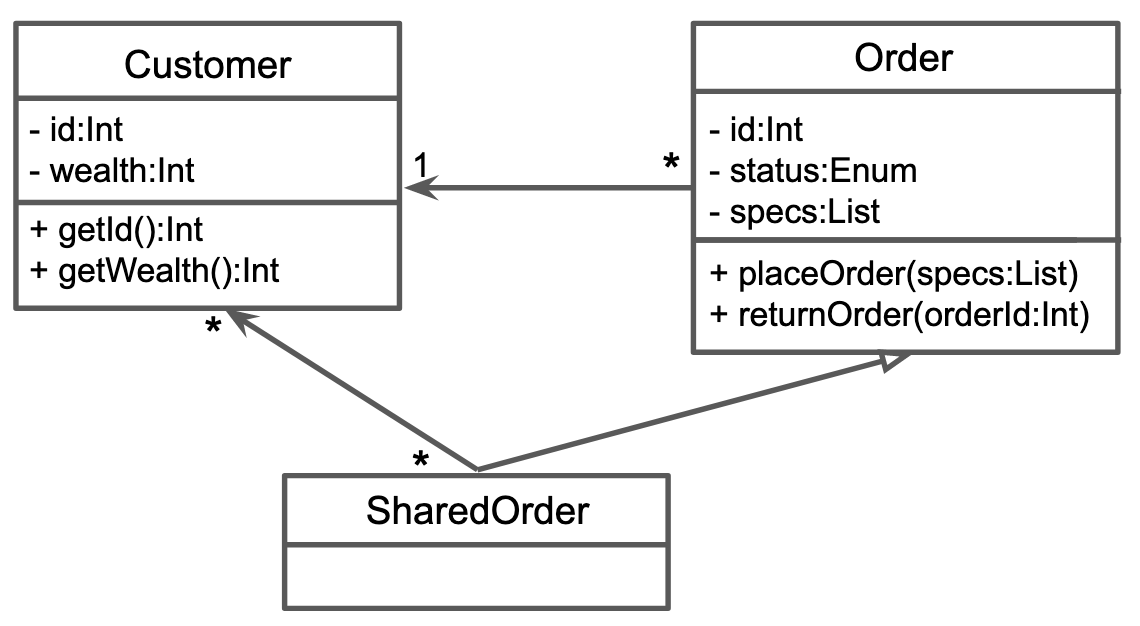
The next section explains each of the notational elements shown in the example.
4.6.1 UML Class Diagram Notation
This section contains some of the most common UML class diagram notation.
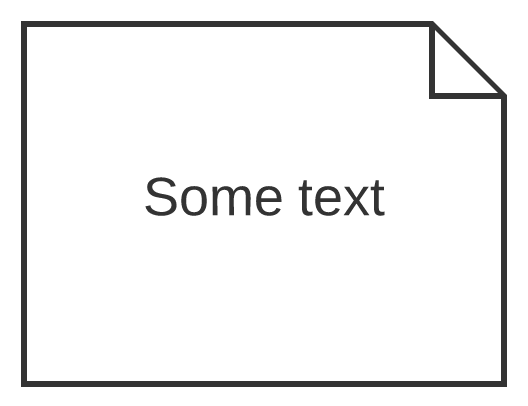
Note. Notes are for placing comments on class diagrams.
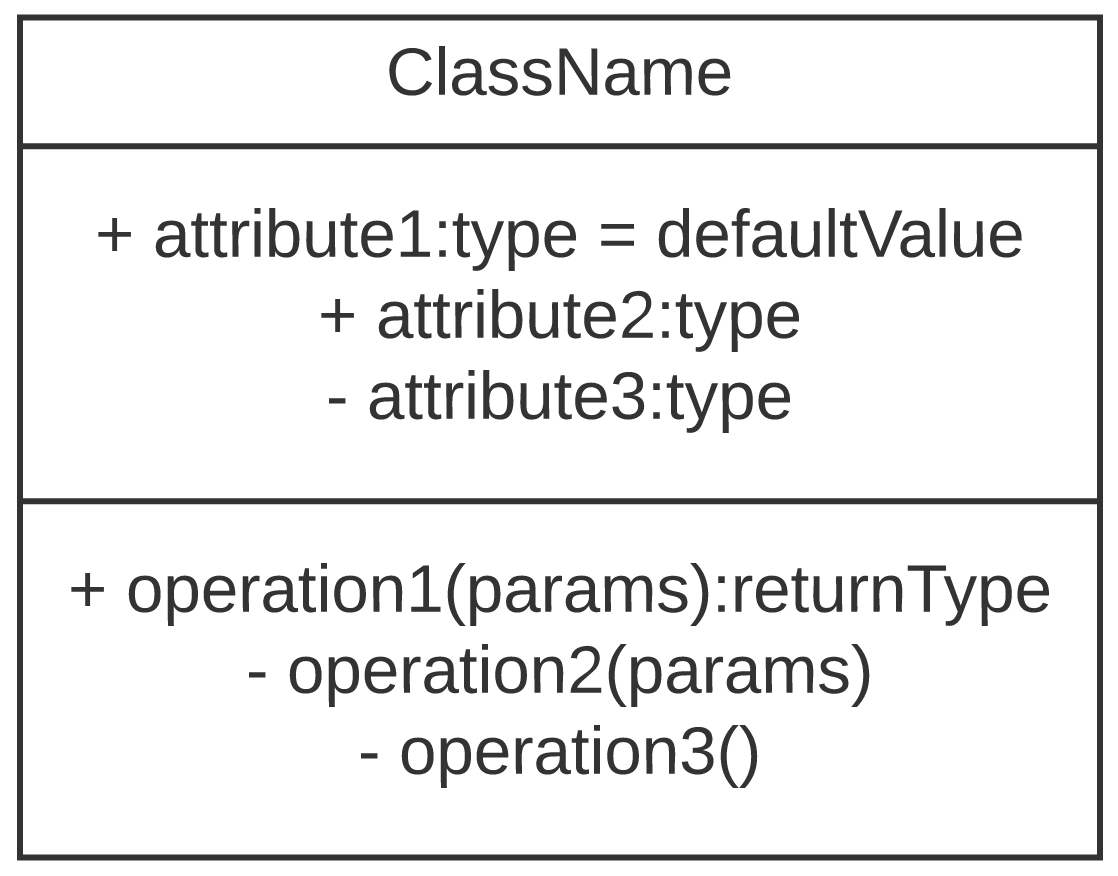
Note. Attributes are properties that are listed within a class box and the operations are methods. The + indicates a public method, – is private, and # is protected. The notation includes attribute types (e.g., int, Token, etc.), method parameters and return types, and default values for attributes.
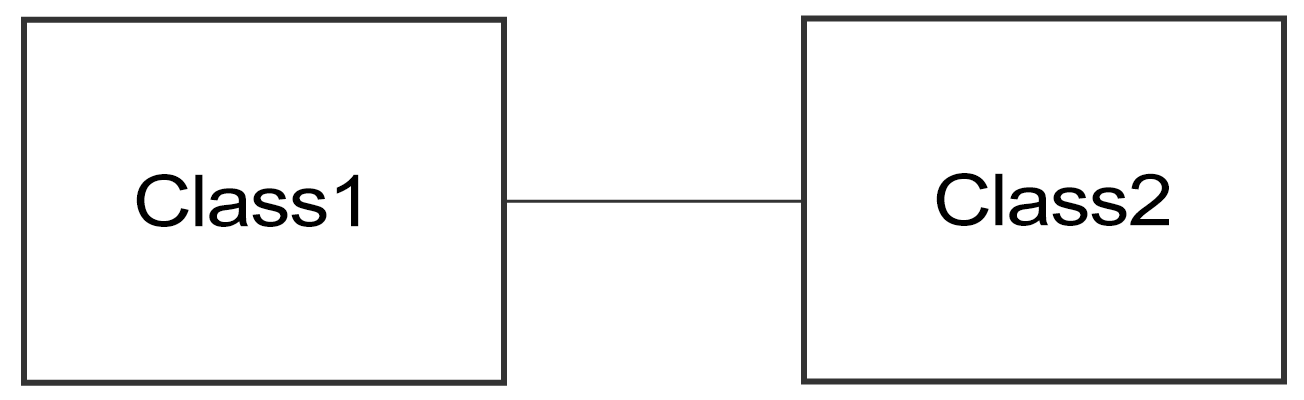
Note. Association means that a class contains a reference to an object(s) of the other class in the form of a property. In this example, we aren’t told whether Class1 references Class2 or vice versa.
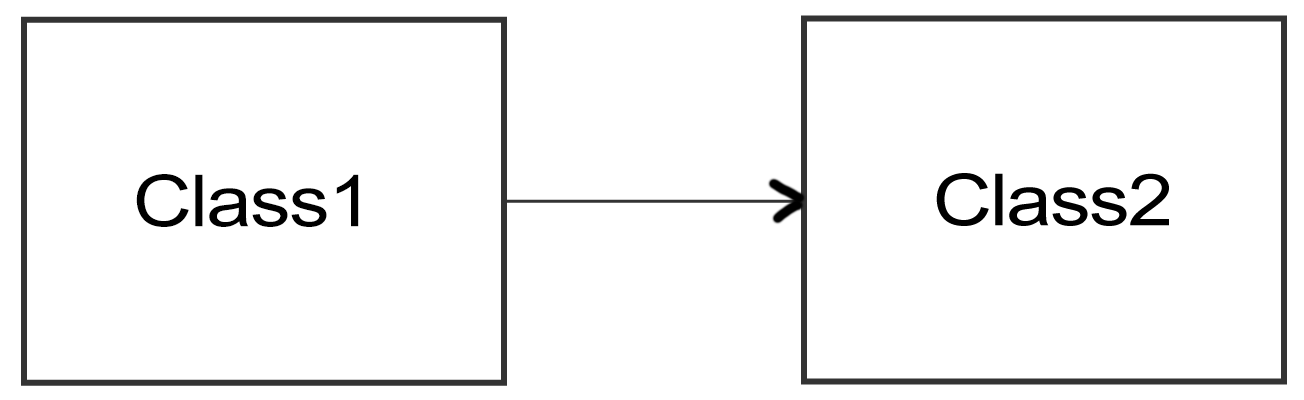
Note. The arrow indicates that Class1 has a Class2.
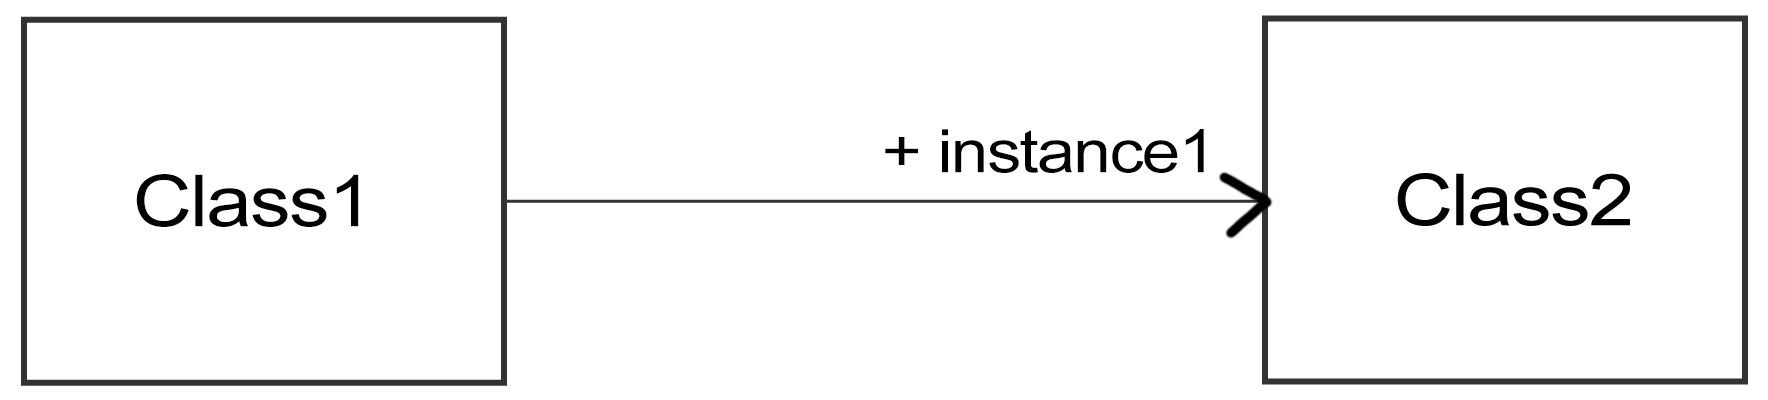
Note. Class1 has a property named instance1. It is an instance of Class2.

Note. Class1 has a property named instance1 containing zero or one instances of Class2.

Note. Zero or more instances of Class1 have properties named instance1 containing zero or one instance of Class2.
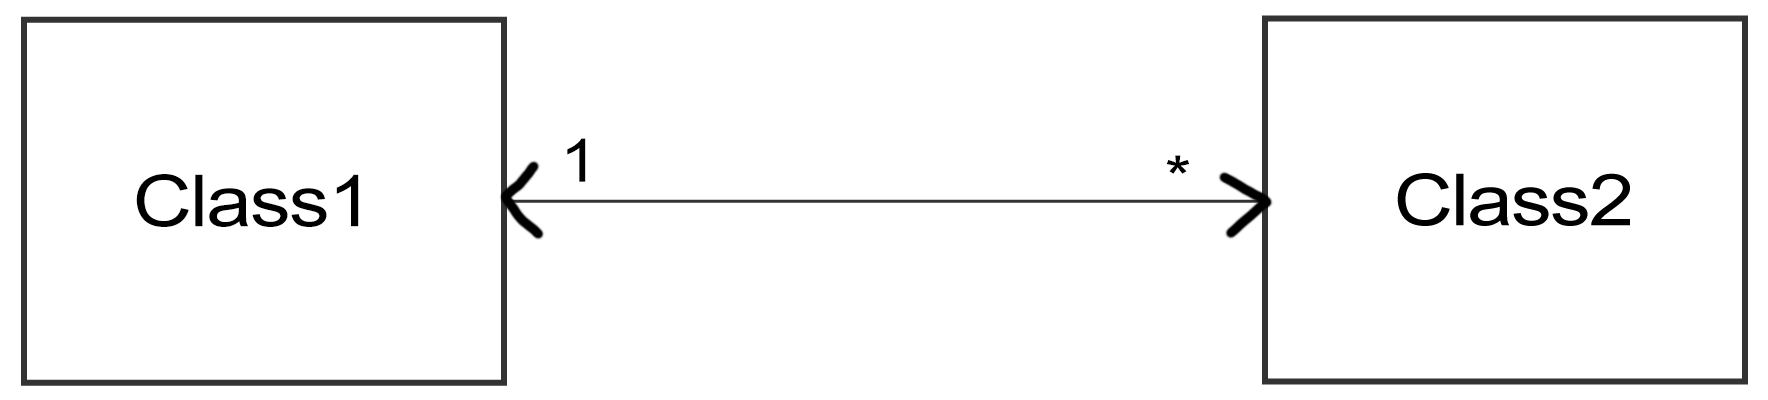
Note. Class1 has zero or more instances of Class2. Class2 has exactly one instance of Class1.
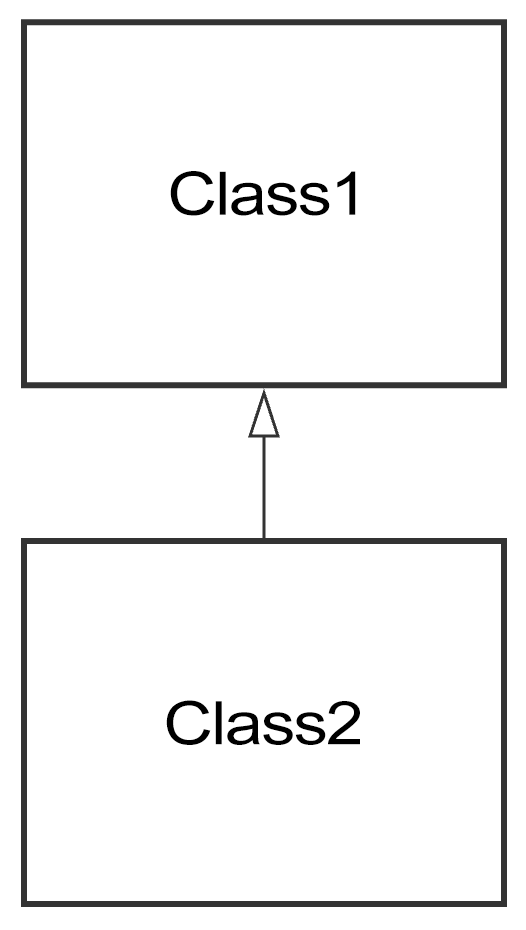
Note. Class2 is a subclass of Class1; Class2 is a Class1.
4.6.2 Real-World Class Diagram Examples
These PDFs contain class diagrams for actual software.
- EvoloPy: An open-source nature-inspired optimization framework in Python (Faris et al., 2016).
- Processing: A Python framework for the seamless integration of geoprocessing tools in QGIS (Graser & Olaya, 2015).
- Java-based graphical user interface for MRUI, a software package for quantitation of in vivo/medical magnetic resonance spectroscopy signals (Naressi et al., 2001).
- RepoMiner: A language-agnostic Python framework to mine software repositories for defect prediction [PDF] (Palma et al., 2021).
- pyfao56: FAO-56 evapotranspiration in Python [PDF] (Thorp, 2022).
If any links are broken, try the Wayback Machine.
4.7 Sequence Diagrams
A sequence diagram describes interactions between objects. Usually, the diagram shows a single use case or scenario. Sequence diagrams are a type of interaction diagram and are not as good for showing object implementation details.
This section provides an example sequence diagram and commonly used sequence diagram notation. For more detailed information, see Fowler (2004).
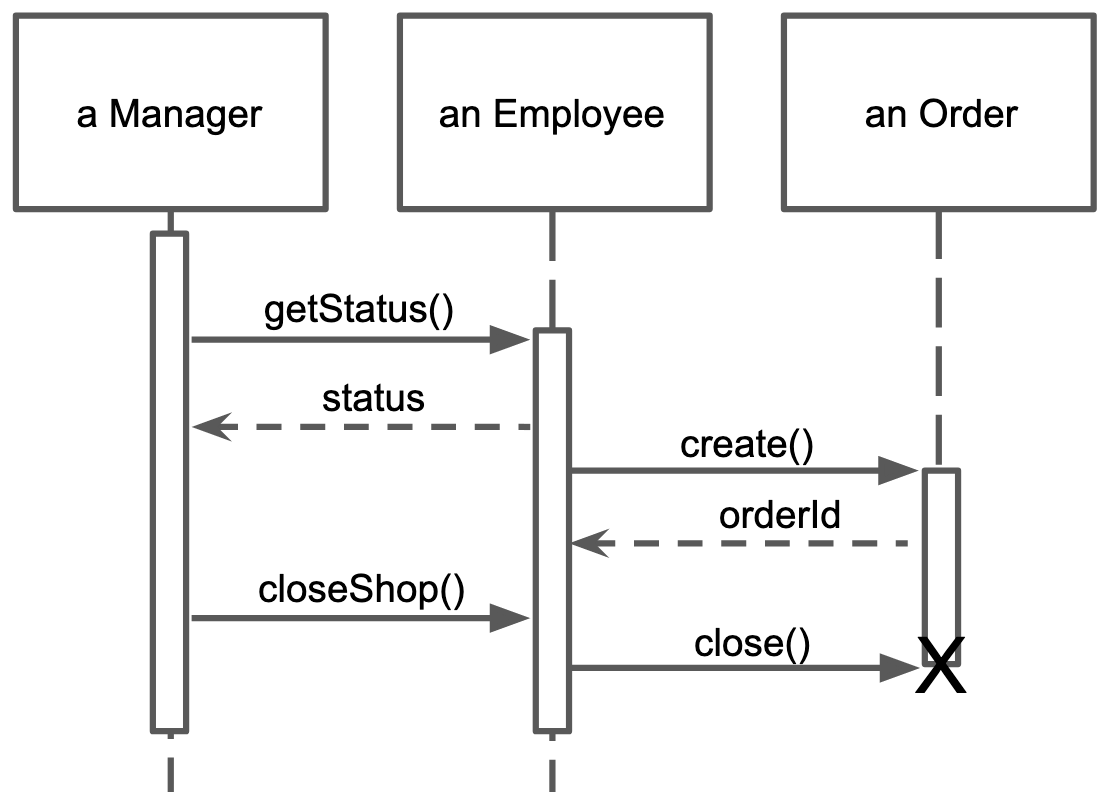
In Figure 4.11, the example sequence diagram represents interactions between instances of the Manager, Employee, and Order classes. Manager asks the Employee for a status update, Employee complies, Employee creates an Order, Manager asks Employee to close the shop, Employee closes the Order.
In the example, the columns (called participants) are objects, but this is not always the case. For example, a participant can be a user. Users, if they are human, are sometimes represented as stick figures (without the box). Another possible non-object participant could be a database (although in some cases, a database is considered an object). What’s most important when creating diagrams is not following the rules or conventions but communicating with your audience.
4.7.1 UML Sequence Diagram Notation
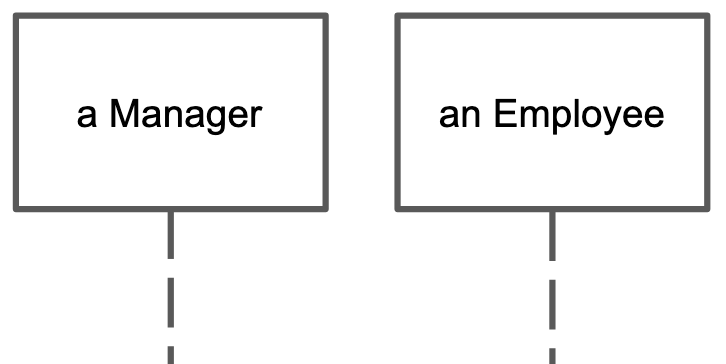
Note. The “columns” of a sequence diagram are each participants. Participants are often objects. The name of the participant goes in the box.
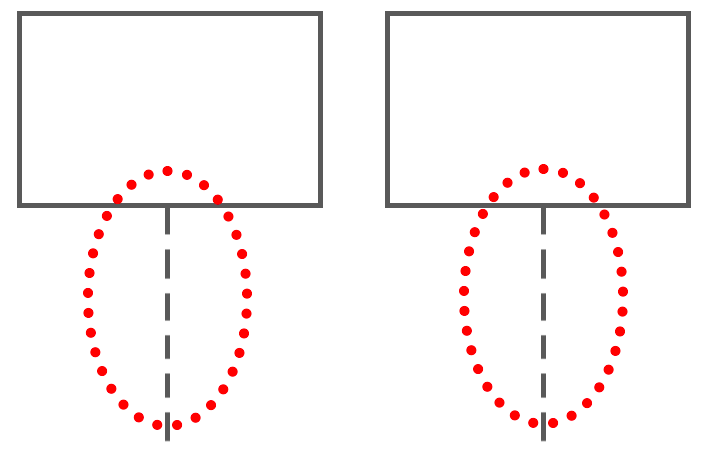
Note. Vertical dashed line represents the life span of the participant. Top is beginning of life, and bottom is the end. Life ends when the participant is deleted.
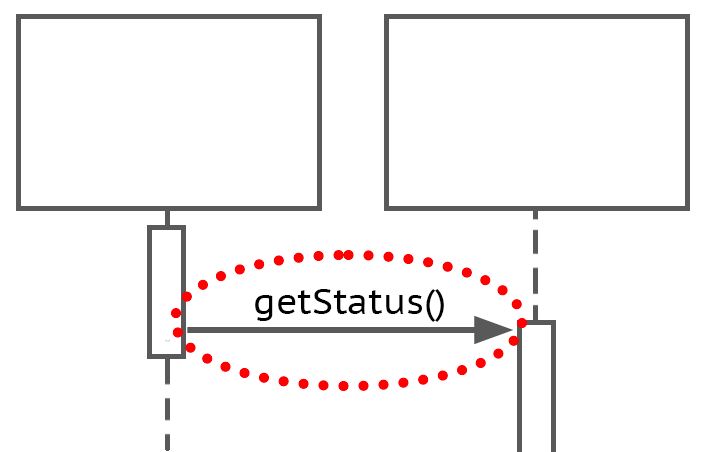
Note. Interaction from one participant to another is shown by the solid line with arrow. Often a method call.
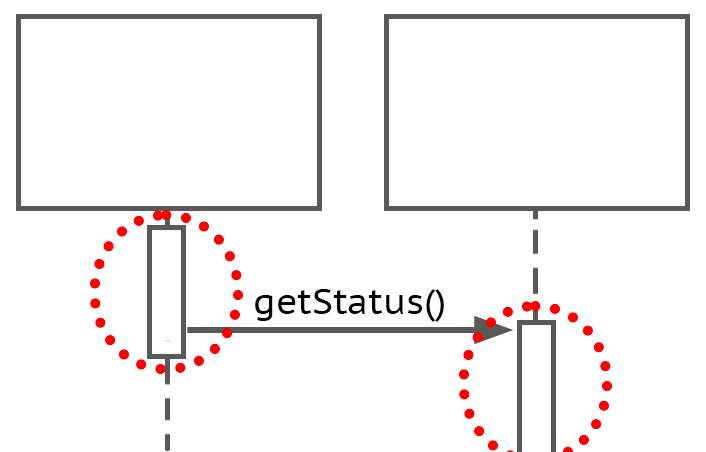
Note. Box on lifeline indicates when the participant is active. Indicates method is on call stack.
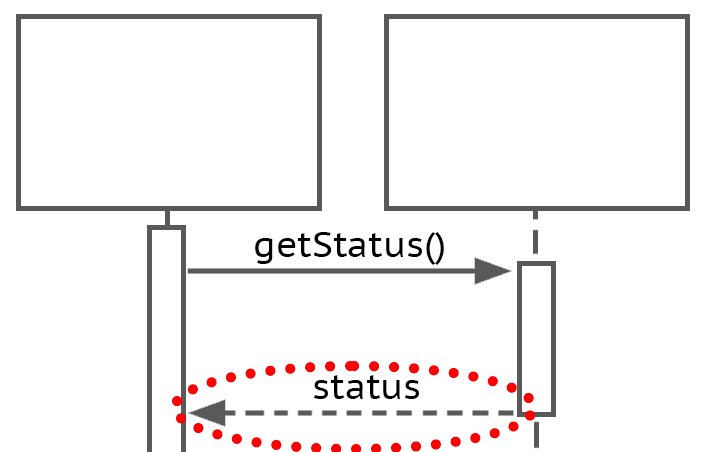
Note. Dashed line with arrow indicates method return. Use only when it helps communicate something important about the interaction.
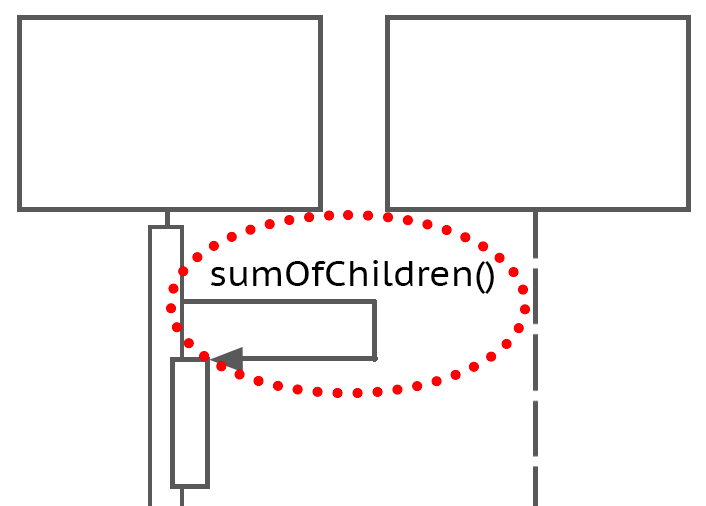
Note. Method calling self. Solid line with arrow points back to participant’s own lifeline.
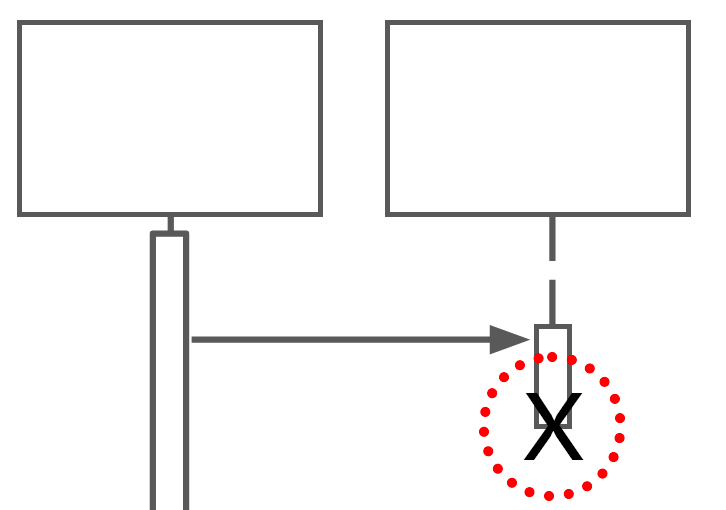
Note. End of participant’s life. Indicated by an X on the lifeline.
4.7.2 Real-World Sequence Diagram Examples
These PDFs contain sequence diagrams for actual software.
- Py4JFML: A Python wrapper for using the IEEE Std 1855-2016 through JFML [PDF] (Alcalá-Fdez et al., 2019).
- COFFEE—An MPI-parallelized Python package for the numerical evolution of differential equations (Doulis et al., 2019).
- Teetool—A probabilistic trajectory analysis tool (Eerland et al., 2017).
- GEMS: A Python library for automation of multidisciplinary design optimization process generation [PDF] (Gallard et al., 2018).
If any links are broken, try the Wayback Machine.
4.8 Summary
UML diagrams can be helpful for communicating how your code works. Class diagrams and sequence diagrams are two commonly used types of UML diagrams. Each type of diagram emphasizes some part of the code design while leaving out other parts. UML diagrams are for communicating with humans—not computers.
References
Alcalá-Fdez, J., Alonso, J. M., Castiello, C., Mencar, C., & Soto-Hidalgo, J. M. (2019, June). Py4JFML: A Python wrapper for using the IEEE Std 1855-2016 through JFML. Paper presented at the 2019 IEEE International Conference on Fuzzy Systems (FUZZ-IEEE), New Orleans, LA, USA. https://ricerca.uniba.it/bitstream/11586/256332/9/PID5822281-PrePrint%28con-DOI%29.pdf
Doulis, G., Frauendiener, J., Stevens, C., & Whale, B. (2019). COFFEE—An MPI-parallelized Python package for the numerical evolution of differential equations. SoftwareX, 10, 100283. https://www.sciencedirect.com/science/article/pii/S2352711019300950
Eerland, W., Box, S., Fangohr, H., & Sóbester, A. (2017). Teetool—A probabilistic trajectory analysis tool. Journal of Open Research Software, 5(1). https://openresearchsoftware.metajnl.com/articles/10.5334/jors.163
Faris, H., Aljarah, I., Mirjalili, S., Castillo, P. A., & Guervós, J. J. M. (2016). EvoloPy: An open-source nature-inspired optimization framework in python. In Proceedings of the 8th International Joint Conference on Computational Intelligence (IJCCI): Evolutional Computational Theory and Applications (ECTA), 1, 171-177. https://research-repository.griffith.edu.au/bitstream/handle/10072/401215/Estivill-Castro165057-Published.pdf?sequence=2
Fowler, M. (2004). UML distilled: A brief guide to the standard object modeling language. Addison-Wesley Professional.
Gallard, F., Vanaret, C., Guénot, D., Gachelin, V., Lafage, R., Pauwels, B., Barjhoux, P.-J., & Gazaix, A. (2018). GEMS: A Python library for automation of multidisciplinary design optimization process generation. Paper presented at the 2018 AIAA/ASCE/AHS/ASC Structures, Structural Dynamics, and Materials Conference, Kissimmee, FL, USA.. https://hal.science/hal-02335530/file/DTIS19188.1570026732_preprint.pdf
Graser, A., & Olaya, V. (2015). Processing: A python framework for the seamless integration of geoprocessing tools in QGIS. ISPRS International Journal of Geo-Information, 4(4), 2219-2245. https://www.mdpi.com/2220-9964/4/4/2219/pdf
Naressi, A., Couturier, C., Castang, I., De Beer, R., & Graveron-Demilly, D. (2001). Java-based graphical user interface for MRUI, a software package for quantitation of in vivo/medical magnetic resonance spectroscopy signals. Computers in Biology and Medicine, 31(4), 269-286. https://citeseerx.ist.psu.edu/document?repid=rep1&type=pdf&doi=cdb5e5d28a9bd6a04f969d6465110f875e706e71
Palma, S. D., Di Nucci, D., & Tamburri, D. (2021). RepoMiner: A language-agnostic Python framework to mine software repositories for defect prediction. arXiv preprint arXiv:2111.11807. https://arxiv.org/pdf/2111.11807.pdf
Thorp, K. R. (2022). pyfao56: FAO-56 evapotranspiration in Python. SoftwareX, 19, 101208. https://www.ars.usda.gov/ARSUserFiles/40820/Thorp2022%20-%20pyfao56.pdf
Fowler, M. (2004). UML distilled: A brief guide to the standard object modeling language. Addison-Wesley Professional.
In Unified Modeling Language (UML), a visualization of how classes are built in relation to other classes in object-oriented software. Includes properties and methods of individual classes and “has a” and “is a” relationships between classes.
In Unified Modeling Language, an interaction diagram showing how different participants (e.g., users, software components, classes, etc.) collaborate during a single use case.
Software for developing software.
Faris, H., Aljarah, I., Mirjalili, S., Castillo, P. A., & Guervós, J. J. M. (2016). EvoloPy: An open-source nature-inspired optimization framework in python. In Proceedings of the 8th International Joint Conference on Computational Intelligence (IJCCI): Evolutional Computational Theory and Applications (ECTA), 1, 171-177. https://research-repository.griffith.edu.au/bitstream/handle/10072/401215/Estivill-Castro165057-Published.pdf?sequence=2
Graser, A., & Olaya, V. (2015). Processing: A python framework for the seamless integration of geoprocessing tools in QGIS. ISPRS International Journal of Geo-Information, 4(4), 2219-2245. https://www.mdpi.com/2220-9964/4/4/2219/pdf
Naressi, A., Couturier, C., Castang, I., De Beer, R., & Graveron-Demilly, D. (2001). Java-based graphical user interface for MRUI, a software package for quantitation of in vivo/medical magnetic resonance spectroscopy signals. Computers in Biology and Medicine, 31(4), 269-286. https://citeseerx.ist.psu.edu/document?repid=rep1&type=pdf&doi=cdb5e5d28a9bd6a04f969d6465110f875e706e71
Palma, S. D., Di Nucci, D., & Tamburri, D. (2021). RepoMiner: A language-agnostic Python framework to mine software repositories for defect prediction. arXiv preprint arXiv:2111.11807. https://arxiv.org/pdf/2111.11807.pdf
Thorp, K. R. (2022). pyfao56: FAO-56 evapotranspiration in Python. SoftwareX, 19, 101208. https://www.ars.usda.gov/ARSUserFiles/40820/Thorp2022%20-%20pyfao56.pdf
Visualization of collaboration between different parts of software.
In a Unified Modeling Language sequence diagram, the columns. They can represent objects, users, or other entities involved in a program’s execution.
Alcalá-Fdez, J., Alonso, J. M., Castiello, C., Mencar, C., & Soto-Hidalgo, J. M. (2019, June). Py4JFML: A Python wrapper for using the IEEE Std 1855-2016 through JFML. Paper presented at the 2019 IEEE International Conference on Fuzzy Systems (FUZZ-IEEE), New Orleans, LA, USA. https://ricerca.uniba.it/bitstream/11586/256332/9/PID5822281-PrePrint%28con-DOI%29.pdf
Doulis, G., Frauendiener, J., Stevens, C., & Whale, B. (2019). COFFEE—An MPI-parallelized Python package for the numerical evolution of differential equations. SoftwareX, 10, 100283. https://www.sciencedirect.com/science/article/pii/S2352711019300950
Eerland, W., Box, S., Fangohr, H., & Sóbester, A. (2017). Teetool—A probabilistic trajectory analysis tool. Journal of Open Research Software, 5(1). https://openresearchsoftware.metajnl.com/articles/10.5334/jors.163
Gallard, F., Vanaret, C., Guénot, D., Gachelin, V., Lafage, R., Pauwels, B., Barjhoux, P.-J., & Gazaix, A. (2018). GEMS: A Python library for automation of multidisciplinary design optimization process generation. Paper presented at the 2018 AIAA/ASCE/AHS/ASC Structures, Structural Dynamics, and Materials Conference, Kissimmee, FL, USA. https://hal.science/hal-02335530/file/DTIS19188.1570026732_preprint.pdf
