2

Chapter 2
Project Management and Teamwork
Project management is the process of planning and executing a project while balancing the time, cost, and scope constraints. Time, cost, and scope are known as the triple constraint.
How does one minimize time and money spent on a project while delivering an adequate feature set? Risk management is key. Risk is the estimated probability of a loss given a set of known and unknown factors. Risk can be stated as high, medium, low, or numerically. Ways to mitigate risk include defining and keeping track of your project, communicating with your project team, researching the implications of decisions, developing backup plans, and selecting suitable tools.
This chapter covers a variety of project management methods, including those related to teamwork. The methods are not limited to one type of software development environment, but this chapter, like the rest of this book, is geared toward Agile. There are many more methods that aren’t discussed here; this chapter provides a starter set of well-known methods and highlights different areas of project management.
2.1 Why Learn about Project Management?
Why is there a chapter about project management if this book is intended for people who want to become or are currently software engineers?
- You might become a project manager (e.g., your employer asks you to fill the role, or you’re interested in a new position).
- You might have a project manager. Understanding some basics of project management can help you understand what they’re doing (e.g., using a RACI matrix to define who on the team does what) and what they’re trying to tell you about the project.
- You might need to self-manage (e.g., within an organization that has a flattened hierarchy or within an Agile team).
2.2 Triple Constraint
Project management is partially about optimization: How can we use our limited financial and personnel resources to complete our project by the deadline, without going over budget? These concerns are often summarized as needing to balance three constraints.
- Time: duration of the project, intermediate deadlines
- Cost: monetary, personnel, and other project resources
- Scope: what the project is meant to accomplish and the requirements of the project, including quality
This set of three is called the triple constraint.
It can be difficult to balance these three constraints. Common challenges:
- You’re meeting with a client who says, “Oh, I forgot to mention we want this feature. That won’t be a big deal, right?”
- You realize late in the project that to implement feature A, you’ll need to implement B, C, and D as well.
- Your team’s estimates were overly optimistic (the planning fallacy).
These situations are so common that you can assume they’re going to happen and come up with a mitigation plan even before the project starts. But many situations are more complicated (more factors with more interrelationships), more unique to your context, and have factors that leak from your professional life to your personal life. Here are some examples:
- You’re working on a project with a friend who is an excellent coder but only available for the next three months (time). They also have their own ideas about where they want the project to go (scope). You know your friend will be more enthusiastic about the project if they have more control, and that means quicker implementation and less work for you (cost). But that’d mean sacrificing some of your own feature priorities (scope).
- You’re working with a five-person team. Your colleague needs help, but all hours must be billed to a project, you’re getting pressured to stay close to the budget, and you bill at a higher rate than your colleague (cost). If your colleague doesn’t get help, they might spend extra hours self-training (cost), could switch to a different project, and there’s a small chance they’ll make the project take longer (time). Scope is fixed: the product must satisfy all its requirements.
Making strategic project decisions involves adjusting project constraints. If you want to reduce time and cost spent on a project or increase project scope, you’ll need a corresponding change in one or more other constraints (van Wyngaard et al., 2012).
2.3 Managerial Skill Mix
What skills are required for managing a project? There are three broad categories comprising the managerial skill mix (MSM) (Badawy, 1995).
- Interpersonal: Communicating effectively with anyone likely to affect the project (e.g., engineers on your team, managers, clients, contractors, IT support, etc.).
- Technical: Using methods and equipment effectively (e.g., knowledge of appropriate processes, understanding and writing code, etc.).
- Administrative and conceptual: Understanding the “big picture” vision (conceptual) and being able to move macro-level pieces (e.g., teams, departments, divisions, etc.) toward that vision (administrative).
High-level managers (e.g., CEOs) tend to need a different mix of skills than lower-level managers (e.g., project managers). For example, a project manager might need strong interpersonal and technical skills while only occasionally considering the big picture of how a project fits into organization’s overall vision (Badawy, 1995). Since this chapter is about project management, we will focus on interpersonal and technical skills.
2.4 Interpersonal Skills: Team Communication
One way to reduce risk is to improve team communication, which can increase the likelihood of project success.
As background for this section, consider Tuckman’s model of team development (Stuart, 2014; Tuckman, 1965; Tuckman & Jensen, 1977).
- Forming: Team members become oriented through testing each other’s boundaries and establishing dependency relationships with peers, leaders, and existing team standards.
- Storming: Team members resist group influence, their peers, their peers’ ideas, and tasks.
- Norming: Team develops cohesiveness, devises new standards and roles, and members express personal opinions related to tasks.
- Performing: Team roles become flexible; team dynamics and structure serve the function of the team and task performance.
- Adjourning: Team disbands.
The rest of this section discusses specific methods a team can use to improve communication. Consider where each might fit in to these stages (there’s not just one answer).
2.4.1 Establishing Ground Rules
Team ground rules are a preemptive or reactive method for reducing team conflict and dysfunction. Ground rules might already exist when a team forms, others might develop as the team becomes normalized, and revisions might happen as the team proceeds with their work and identifies new team concerns or opportunities. To be effective, the ground rules need buy-in from the whole team. What the ground rules should cover or should be varies by team, but below are some questions that may help.
- What is our vision for what this team is or what we’re trying to accomplish together? (Clients choose us because we’re honest and transparent.)
- What do we prioritize most? (Delivering a high-quality product ahead of the deadline, input from all team members, honoring diverse end-users, making the big bucks.)
- What methods will we use for day-to-day communication? (No interrupting, no ’splaining, listen to and acknowledge what other people are saying, ask people if they’re busy before starting a long conversation).
- What methods will we use to communicate with each other during conflict? (We’ll use nonviolent communication, we’ll focus on the solving the problem instead of who to blame.)
- What expectations do we have for work habits? (Tuesdays from 1:00 to 3:00 p.m. is silent time; be five minutes early to meetings.)
- What expectations do we have for responsiveness? (Respond within two hours during regular work hours; have the team Discord open during regular work hours.)
- What will we do when team members fail expectations? (We’ll discuss any team problems on Fridays at 3:00 p.m.)
- How will we get to know each other? (We’ll discuss each other’s cognitive styles; we’ll set up a chat channel for socializing.)
The end product of answering questions like these could be a list of short statements that’s posted somewhere people will see it regularly.
The questions your team asks, and the answers, will vary depending on the individuals on the team and on context (e.g., culture). Whatever those questions and answers are, ideally they will feel meaningful and authentic. If your team gets the feeling the ground rules are silly, phony, too aspirational, too inflexible, or too authoritative, that could invalidate your team’s efforts toward creating the ground rules.
2.4.2 Defining Roles and Responsibilities: RACI Matrix
A RACI matrix is a chart for defining who is responsible (R) and accountable (A) for a task or deliverable, and who should be consulted (C) or informed (I).
Example RACI Matrix. A RACI matrix is often formatted as a table, but it can also be written as a list, as in the following example.
Project Phase: Minimum Viable Product (MVP)
- Focus groups
- Frontend Developers: C
- Frontend Designers: R
- Frontend Lead: R / A
- Backend Developers: C
- Backend Lead: C
- Team Lead: R / A
- Requirements specification
- Frontend Developers: R
- Frontend Designers: R
- Frontend Lead: A / I
- Backend Developers: R
- Backend Lead: A / I
- Team Lead: C / I
- Throwaway code design
- Frontend Lead: I
- Backend Developers: R
- Backend Lead: A
- Team Lead: I
- Implementation
- Frontend Developers: R
- Frontend Designers: C
- Frontend Lead: A
- Backend Developers: R
- Backend Lead: A
- Team Lead: C / I
- User acceptance testing
- Frontend Developers: R
- Frontend Designers: R
- Frontend Lead: R / A
- Backend Developers: R
- Backend Lead: C
- Team Lead: C / I
Interpreting a RACI Matrix. One person might have multiple roles. Task or deliverables can be organized into phases.
- Responsible (R): Who will do the work.
- Accountable (A): Who will approve the work and make sure it gets done.
- Consulted (C): Who can discuss and offer advice about the work.
- Informed (I): Whom to keep up to date about the status of the work.
A RACI matrix is a method for reducing risk. If your team doesn’t know who needs to do what (or forgets, or can plausibly deny knowing), that can increase the probability of a negative events and outcomes (e.g., shipping a broken product to customers because nobody was assigned to quality assurance).
2.4.3 Measuring and Building Consensus: Fist of Five Method
Fist of five is a method for checking and building consensus within a group of people. One person (e.g., team leader) makes a statement or proposes an idea to a group, and each person communicates their level or agreement or support by holding up a fist or up to five fingers. It has become associated with Agile (Belling, 2020), but students of different ages use it, too (e.g., Fletcher, 2002; Hulshult & Krehbiel, 2019).
What each number of fingers means:
- None: Strong reject. Blocks consensus.
- One: Reject. Major issues need resolving now.
- Two: Weak reject. Minor issues need resolving now.
- Three: Weak accept. Minor issues can be resolved later.
- Four: Accept. No issues.
- Five: Strong accept. Willing to lead or champion.
If anyone suggests rejecting the statement or idea by holding up two or fewer fingers, the team can stop, discuss, make changes, and vote again until there’s sufficient consensus. It’s up to the team or its leader to decide how much consensus is needed.
The fist of five method can reduce risk by (1) bringing problems to light and (2) increasing team motivation, ownership, and investment.
2.5 Technical Skills: Project Definition
This section contains methods for helping with the technical side of defining a project, including definition of scope, prioritization, estimation, scheduling, and task management.
2.5.1 Project Scope
In an Agile software development environment, a project’s scope is implied through sets of tasks (e.g., release plan, Product Backlog, iteration plan, Sprint Backlog). Each iteration might have a goal (e.g., a Sprint Goal) that summarizes what the set of tasks is meant to accomplish, which is also part of defining scope for Agile projects. The scope is purposely flexible and emerges as the project proceeds.
In other environments, the project scope (a.k.a. statement of work) is a specific document stating the project’s objective, deliverables (outputs), milestones, technical requirements, and limitations/exclusions.
2.5.2 Balancing Constraints: Project Priority Matrix
Above, we talked about the three major constraints of project management—time, cost, and scope—and that balancing them isn’t always straightforward. What should the balance be? How do I know whether I’m achieving balance? How does this fit into how the project is run? One method for more concretely stating the desired balance is the project priority matrix. Table 2.1 shows a sample blank project priority matrix.
| Time | Scope | Cost | |
|---|---|---|---|
| Constrain | |||
| Enhance | |||
| Accept |
- Constrain: The constraint is fixed (can get better but must not get worse).
- Enhance: Try to improve (e.g., take less time, spend less, have more features).
- Accept: Can worsen (e.g., more time, more personnel, fewer features) if necessary.
Table 2.2 shows a sample completed project priority matrix. For this example, imagine you have a grant from the National Institutes of Health (NIH) to write and test software for a medical device that automatically regulates a person’s pain level.
| Time | Scope | Cost | |
|---|---|---|---|
| Constrain | ✓ (cost) | ||
| Enhance | ✓ (scope) | ||
| Accept | ✓ (time) |
Note. The text in parentheses is provided to make the table screen-reader-friendly.
Each checkmark in the filled example represents the following.
- Scope: Fixed. Your team must do what they said they’d do and cannot scrimp on quality. If the device only partially works, that would be a disaster—you’ll be testing it on human subjects!
- Cost: Needs to be tightly controlled because the grant is for a fixed amount and funded by taxpayers.
- Time: While the project hopefully stays on track and delivers as promised, if needed, your team can submit intermediate results to the NIH and perhaps use those results to get another grant.
Ideally, the project priority matrix would be defined before the project starts (with the client) and referenced throughout the project as needed. Developing and adhering to the matrix can reduce risk by helping the team or project manager balance constraints in ways that are acceptable to the client.
2.5.3 Task Prioritization: Eisenhower Matrix
Individual tasks, too, need relative prioritization. In an Agile Scrum environment, this would be the responsibility of the Product Owner and in Agile Extreme Programming (XP), it’s the customer.
But how are task priorities decided? One high-level method is called the Eisenhower matrix (Table 2.3).
| Urgent | Not Urgent | |
|---|---|---|
| Important | Do | Decide |
| Not Important | Delegate | Delete |
Each cell in the Eisenhower matrix means the following.
- Do (urgent, important): Needs to be done correctly and now. An example is documenting your undocumented code so that a new hire can start contributing.
- Decide (not urgent, important): Needs to be done correctly but not immediately. An example is refactoring your currently working code. Such a task needs to be done eventually and done right—maybe the new hire can handle it in a couple months.
- Delegate (urgent, not important): Needs to be done now, but mistakes can be absorbed (e.g., tolerated, corrected later). An example is needing to initialize the task management system so the team can begin defining tasks. If it’s not done right, that’s fine—the developers and managers will adjust the setup as needed. The task would be a good learning task for the new hire, who doesn’t have much to do right now.
- Delete (not urgent, not important): Doesn’t need to be done correctly or any time soon. Can be eliminated. An example is implementing a loading screen that looks like a game of pong, but you’re the only one on the team who thinks that’s a cool idea.
Doing a first-pass task prioritization using an Eisenhower matrix can reduce risk by both conserving resources and using resources thoughtfully (including yourself). It can also help with getting out of the mode of “putting out fires” (concentrating on the urgent tasks), which can result in important but nonurgent tasks getting eternally left at the end of the to-do list (perhaps resulting in project failure).
2.5.4 Finer-Grained Prioritization
What happens when there are multiple important tasks to complete that have the same level of urgency? How does one decide which is more important? Here are some methods for deciding which task has higher priority when they seem roughly equivalent.
- For implementation tasks (e.g., coding, architecture, other implementation choices, etc.), ask an expert. They might know from experience which tasks have more unknowns, more risk, dependencies, and so on.
- If it’s an implementation task and you’re meant to be an expert, you can do a focused research effort called a spike to gather more information about the task, which in turn can help you prioritize it. To do a spike:
- Come up with a question.
- Try to figure out the answer by reading (e.g., documentation, other people’s opinions) and experimenting (e.g., coding in a sandbox). You will probably get ideas for more questions in the process.
- Repeat until you have enough information.
A good way to do a spike is to start doing the task and see what obstacles you run into. Example: You need to set up a local server for testing and then write a test suite. You have experience writing test suites but have never set up a server. After doing a spike, you realize that some of the tests you’re going to write rely on the local server having a static IP address, which you learned is not the default. Based on your findings, you decide to prioritize the server setup because (1) the test suite depends on it and (2) the server setup task still has many unknowns, and you’re not sure how long it’ll take to eliminate those.
- Think about dependencies: Who’s waiting on you to complete the task? How many other tasks depend on this task? Example: You estimate it’ll take 15 minutes to complete a task that two other people are waiting on. You decide to do that before your four-hour task. Seems like the obvious choice—but if you’re not aware of which tasks depend on yours or are deep into solo work mode, you might make a suboptimal choice.
- If you’re deciding which feature to implement, you can ask the customer or users directly (e.g., through a phone call, focus group, survey) or indirectly (e.g., by looking at support tickets, asking the marketing team, detecting an unmet need based on how people use other software).
- Other ways to select features include voting (e.g., within your team) or pairwise comparison (e.g., Is Feature A more valuable than Feature B? If so, is Feature C more valuable than Feature A?).
A natural side effect of prioritization is finding how long it’ll take to complete a task, what dependencies exist, who the players are, and what the end user wants. All this knowledge contributes to risk mitigation.
2.5.5 Estimation: Story Points, Ideal Days, and Planning Poker
Intertwined with prioritization is estimation, or figuring out ahead of time how long a task is likely to take. But what does “how long” mean, and how do we figure it out ?
According to the Agile community (Cohn, 2006), there are two methods for stating the size of a task.
- Story points: Assign a number to a task representing its size relative to other tasks. For example, a software installation and a virus scan might both be a 1 if they take roughly the same amount of time and effort, have roughly the same amount of risk, and the like. Implementing a major feature might, however, be an 8. Your team decides how far the scale goes.
- Ideal days: Assign a number of days you think it’d take to complete the task if there were no other tasks or distractions. For example, if it takes me 5 minutes to remove a single square foot of grass from my lawn and I have 100 square feet to remove, that is 8 hours and 20 minutes total, so about one ideal day (if your workdays are 8 or 9 hours).
Once story points or ideal days are assigned, a team can make statements like, “This month, we will complete 50 story points,” “10 ideal days,” and so on. Work completed (in story points or ideal days) is, in Agile teams, called the velocity. Teams can make initial estimates about velocity and then adjust depending on how accurate those estimates end up being.
But how are estimates assigned to a task? Another Agile idea is planning poker (Cohn, 2006; Mahnič & Hovelja, 2012). With this method, the team gets together to discuss a set of tasks, and each person gets a set of cards with the different possible story points, ideal days, or other aspects a task can be assigned. One person describes the task, the team asks questions as needed, and then each person privately decides on an estimate by selecting a card (keeping it face down or hidden). Once everyone is ready, the cards are revealed. Variations in estimates are expected, and part of the process: differences open a discussion. Someone making a high estimate, for example, may think of good reasons why a task is likely to take a long time. Someone making a low estimate may identify an efficient idea nobody else thought of. The team discusses and, once ready, can repeat the process until estimates become sufficiently consistent.
2.5.6 Scheduling: Project Network Diagram
Once a set of tasks has been defined, prioritized, and estimated, those tasks can be scheduled. Scheduling a task is placing it within the time line and context of a project. The context of a project includes other tasks, personnel, and non-personnel resources (e.g., equipment), and milestones. One method for defining and visualizing a project’s schedule is using a project network diagram, which is a directed graph showing a project’s tasks, the sequence in which they should be completed, and the dependency relationships between the tasks. The nodes in the digraph represent tasks, and the lines with arrows represent dependency or sequence relationships. A project network diagram moves left to right, where left is earlier in time. Figure 2.1 shows an example.
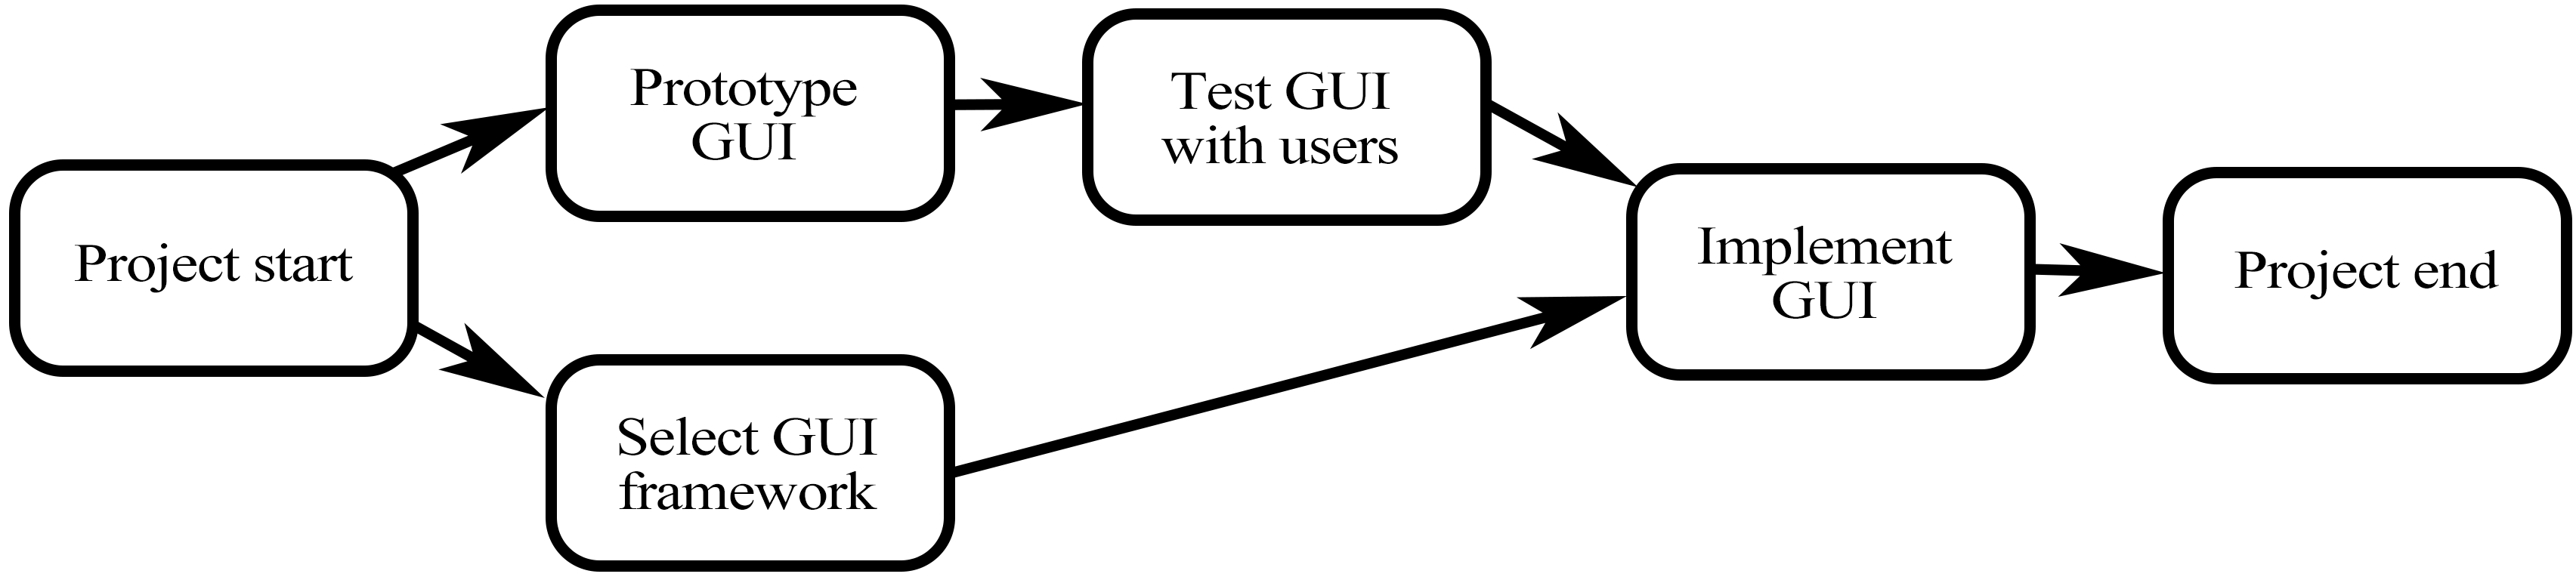
Note. This format of project network diagram is called Activity-on-Node (AON) (Larson & Gray, 2018).
For a task to be represented as a node on a project network diagram, it needs to (at a minimum) be distinct from other tasks, and its dependent tasks (a.k.a. predecessors) must be known. A project network diagram becomes more useful if estimates for the tasks are also known, however.
Constructing a project network diagram. A project network diagram can be created manually or automatically generated by software. To automatically generate a project network using software (e.g., MS Project, Lucidchart), you’d need to enter the project data in tabular form, such as in a spreadsheet. Table 2.4 shows an example.
| Task ID | Task | Predecessors | Duration (hours) |
|---|---|---|---|
| 4 | Implement GUI | 1,3 | 50 |
| 3 | Test GUI with users | 2 | 5 |
| 2 | Prototype GUI | 8 | |
| 1 | Select GUI framework | 2 |
Note. These data could generate the project network diagram in Figure 2.1.
In Table 2.4, even though Task 2 must happen before Task 4, it’s not listed as a predecessor because it’s not an immediate predecessor.
Depending on the software you choose for creating your project network diagram, you might have access to more complex options like specific dates by which individual tasks must be completed.
2.5.7 Task Management Systems
A task management system can be used to organize tasks, task details (e.g., description, acceptance criteria, assignee, status), and other relevant information (e.g., which iteration or phase the task belongs to). They’re useful for organizing and storing information about tasks, but also for the satisfaction of marking a task as done! Task management systems like Asana, Jira, and Trello are strongly oriented toward team collaboration. Some of these systems are also Agile oriented in that they offer Agile-inspired features (e.g., templates).
Common features of task management systems:
- Create, remove, update, and delete tasks.
- Enter task name, description, notes/comments, and add attachments.
- View tasks as a list, as cards on a board, or within a time line (e.g., Gantt chart).
- Organize tasks into projects.
- Assign tasks to different team members, with due dates.
- Enter task status (e.g., in progress, done).
- Get email notifications about tasks.
- Add tags, keywords, and categories.
Task management systems don’t have a universal way to generate project network diagrams. For that, you might need a fully featured project management system (e.g., MS Project). But you may find that a Gantt chart or road map feature meets your needs and is available within your task management system.
2.6 Summary
Project management and teamwork can reduce the risk of a project failing and make it possible to complete larger projects. Part of good project management is balancing time, scope, and cost (the triple constraint).
Project management methods to help with team communication include establishing ground rules, defining roles and responsibilities in a RACI matrix, and measuring and building consensus using the fist of five method.
Methods for defining a project include prioritizing tasks using a project priority matrix or an Eisenhower matrix, estimating tasks using story points, ideal days, and planning poker, visualizing a project schedule using a project network diagram, and using the features of a task management system.
References
Badawy, M. K. (1995). Developing managerial skills in engineers and scientists: Succeeding as a technical manager. Van Nostrand Reinhold.
Beck, K., Beedle, M., van Bennekum, A., Cockburn, A., Cunningham, W., Fowler, M., Grenning, J., Highsmith, J., Hunt, A., Jeffries, R., Kern, J., Marick, B., Martin, R. C., Mellor, S., Schwaber, K., Sutherland, J., & Thomas, D. (2001). Manifesto for Agile software development. https://agilemanifesto.org/
Belling, S. (2020). Agile values and practices. In Succeeding with Agile Hybrids, 47–61. Springer.
Cohn, M. (2006). Agile estimating and planning. Prentice Hall Professional Technical Reference.
Cotton, G. (2013, August 13). Gestures to avoid in cross-cultural business: In other words, “keep your fingers to yourself!” HuffPost. https://www.huffpost.com/entry/cross-cultural-gestures_b_3437653
Fletcher, A. (2002). Firestarter Youth Power Curriculum. Freechild Institute for Youth Engagement. https://freechildinstitute.files.wordpress.com/2023/04/firestarter-participant-guidebook.pdf
Hulshult, A. R., & Krehbiel, T. C. (2019). Using eight agile practices in an online course to improve student learning and Team Project Quality. Journal of Higher Education Theory and Practice, 19(3). https://doi.org/10.33423/jhetp.v19i3.2116
Institute of Electrical and Electronics Engineers. (2020, June). IEEE code of Ethics. IEEE. https://www.ieee.org/about/corporate/governance/p7-8.html
Larson, E. W., & Gray, C. F. (2018). Project management the managerial process. McGraw-Hill Education.
Mahnič, V., & Hovelja, T. (2012). On using planning poker for estimating user stories. Journal of Systems and Software, 85(9), 2086–2095. https://doi.org/10.1016/j.jss.2012.04.005
Stuart, A. (2014). Ground rules for a high performing team. Paper presented at PMI Global Congress 2014—North America, Phoenix, AZ. Project Management Institute.
Tuckman, B. W. (1965). Developmental sequence in small groups. Psychological Bulletin, 63(6), 384–399. https://doi.org/10.1037/h0022100
Tuckman, B. W., & Jensen, M. A. (1977). Stages of small-group development revisited. Group and Organization Studies, 2(4), 419–427. https://doi.org/10.1177/105960117700200404
van Wyngaard, C. J., Pretorius, J. H., & Pretorius, L. (2012). Theory of the triple constraint—A conceptual review. Paper presented at the 2012 IEEE International Conference on Industrial Engineering and Engineering Management, Hong Kong, China. https://doi.org/10.1109/ieem.2012.6838095
The process of planning and executing a project while balancing the time, cost, and scope constraints.
In project management, the three limiting factors that govern project execution: time, cost, and scope. Scope includes quality. Cost includes spending money and resources.
Estimated probability of a negative contingency given known and unknown factors.
An optimism bias in which predictions regarding the time required to complete a future task tend to underestimate the actual time needed.
What will be done if a contingency happens.
van Wyngaard, C. J., Pretorius, J. H., & Pretorius, L. (2012). Theory of the triple constraint—A conceptual review. Paper presented at the 2012 IEEE International Conference on Industrial Engineering and Engineering Management, Hong Kong, China. https://doi.org/10.1109/ieem.2012.6838095
Three categories of skills used by managers: (1) interpersonal, (2) technical, (3) administrative/conceptual. Source: Badawy, M. K. (1995). Developing managerial skills in engineers and scientists: Succeeding as a technical manager. Van Nostrand Reinhold.
Badawy, M. K. (1995). Developing managerial skills in engineers and scientists: Succeeding as a technical manager. Van Nostrand Reinhold.
A preestablished way of achieving a specific outcome.
A five-stage model of how a team develops over time: (1) forming, (2) storming, (3) norming, (4) performing, (5) adjourning.
Stuart, A. (2014). Ground rules for a high performing team. Paper presented at PMI Global Congress 2014—North America, Phoenix, AZ. Project Management Institute.
Tuckman, B. W. (1965). Developmental sequence in small groups. Psychological Bulletin, 63(6), 384–399. https://doi.org/10.1037/h0022100
Tuckman, B. W., & Jensen, M. A. (1977). Stages of small-group development revisited. Group and Organization Studies, 2(4), 419–427. https://doi.org/10.1177/105960117700200404
Institute of Electrical and Electronics Engineers. (2020, June). IEEE code of Ethics. IEEE. https://www.ieee.org/about/corporate/governance/p7-8.html
Beck, K., Beedle, M., van Bennekum, A., Cockburn, A., Cunningham, W., Fowler, M., Grenning, J., Highsmith, J., Hunt, A., Jeffries, R., Kern, J., Marick, B., Martin, R. C., Mellor, S., Schwaber, K., Sutherland, J., & Thomas, D. (2001). Manifesto for Agile software development. https://agilemanifesto.org/
A set of statements about the team, agreed to by each team member, for avoiding team conflict and dysfunction.
In project management, a chart for defining which roles are responsible (R) and accountable (A) for a task or deliverable, and which roles should be consulted (C) or informed (I) about the status of the task or deliverable.
Formally testing software with end users to check not only whether it performs as expected but also whether end users will use it. Typically performed before the software is released.
Cotton, G. (2013, August 13). Gestures to avoid in cross-cultural business: In other words, “keep your fingers to yourself!” HuffPost. https://www.huffpost.com/entry/cross-cultural-gestures_b_3437653
A method for gauging and building group consensus that uses a six-level voting system (zero to five fingers).
Belling, S. (2020). Agile values and practices. In Succeeding with Agile Hybrids, 47–61. Springer.
Fletcher, A. (2002). Firestarter Youth Power Curriculum. Freechild Institute for Youth Engagement. https://freechildinstitute.files.wordpress.com/2023/04/firestarter-participant-guidebook.pdf
Hulshult, A. R., & Krehbiel, T. C. (2019). Using eight agile practices in an online course to improve student learning and Team Project Quality. Journal of Higher Education Theory and Practice, 19(3). https://doi.org/10.33423/jhetp.v19i3.2116
The boundaries and deliverables of a project.
Deciding which units of work to complete before others.
Figuring out ahead of time how long a task is likely to take.
Deciding when project activities are to be completed, how long they will take, and what resources are needed to complete them.
The collection, assignment, sharing, tracking, and scheduling of tasks. Source: Gil, Y., Groth, P., & Ratnakar, V. (2009). Leveraging social networking sites to acquire rich task structure. In Proceedings of the Workshop on User-Contributed Knowledge and Artificial Intelligence: An Evolving Synergy (WikiAI).
What will be completed for a specific software release and when the release will occur.
In Agile Scrum, an ordered list of all that is known to be needed to improve a product.
In Agile, establishing what will be done during a development cycle.
In Agile Scrum, the set of activities to be completed during a Sprint (from Product Backlog), the associated Sprint Goal, and a plan for completing the activities.
Verb: Revision. Noun (in Agile): A time-boxed software development cycle.
In Agile Scrum, the overall objective of the Sprint.
A 3 × 3 grid for documenting how to respond when there are potential changes to a project’s time, cost, or scope. Options include allowing only positive change (constrain), allowing negative change (accept), or seeking positive change (enhance).
In Agile Scrum, the person who is responsible for guiding the Scrum Team on making the most valuable software possible.
Agile methodology that prioritizes customer satisfaction and communication, short development cycles, iteration, frequent releases, code review, teamwork, pair programming, required unit testing, and implementing only the functionality that’s needed.
A grid for helping decide whether to do, delegate, schedule, or eliminate a task based on its urgency and importance.
A quick and to-the-point investigation for gathering information to help the team answer a question or choose a development path.
A structured conversation facilitated by a researcher with a small group of prospective users (typically 6-12 individuals). The aim of this session is to gather insights about the participants’ attitudes, opinions, motivations, concerns, and challenges concerning a specific product or topic.
A process in which entities are compared in order to determine which is preferred.
An action taken in order to avoid a contingency.
Cohn, M. (2006). Agile estimating and planning. Prentice Hall Professional Technical Reference.
A method for estimating an activity based on its size relative to other activities. Scale established by team.
The number of days it would take to complete the work if the work could be 100% focused on.
In Agile, a measure of how much work is being completed.
In Agile, a consensus-based method of assigning estimates to a task that involves individuals on a team each making their own estimate privately, then sharing with the team, discussing, and re-estimating as needed.
Mahnič, V., & Hovelja, T. (2012). On using planning poker for estimating user stories. Journal of Systems and Software, 85(9), 2086–2095. https://doi.org/10.1016/j.jss.2012.04.005
Graph showing the order in which a project’s activities are to be completed.
Larson, E. W., & Gray, C. F. (2018). Project management the managerial process. McGraw-Hill Education.
A user interface with interactive graphics, in contrast to a text-based user interface.
Software for planning and organizing project activities.
Horizontal bar chart showing start and end times of activities within a project schedule, along a time line.
Software for planning, organizing, and otherwise carrying out a project.
