Policy Making
34 Race and the Death Penalty in Tennessee, 1977–2016
John M. Scheb II and Hemant K. Sharma
The widespread protests against police violence against African Americans that erupted in the spring of 2020 reinvigorated a long-standing conversation about systemic racism in the United States. Much of this conversation has focused on aspects of criminal justice, including racial profiling, excessive use of force by the police, the militarization of law enforcement, abuse of prosecutorial discretion, wrongful convictions, sentencing disparities, and mass incarceration. And, of course, activists and academicians have long been concerned with racial discrimination in the administration of capital punishment.
In Furman v. Georgia (1972), the Supreme Court effectively imposed a nationwide moratorium on capital punishment. Four years later, in Gregg v. Georgia (1976), that moratorium ended as the Court upheld a revised death penalty statute. In the decades that followed, a number of states abolished capital punishment, either through legislative or judicial action. Today, twenty-eight states and the federal government (including the military) retain the death penalty for “aggravated” first-degree murders.
Although the Supreme Court continues its support for the death penalty, racial injustice in the application of the ultimate sanction remains a salient issue for the courts. In 2017, the Supreme Court granted habeas corpus relief to a Texas death row inmate who claimed that his trial was marred by racism.[1] In 2019, the high Court provided similar relief to a Mississippi death row inmate who claimed that bias had pervaded the jury selection process in his matter.[2] In North Carolina, there is ongoing litigation of claims by death row inmates suggesting that the selection of juries in their trials was tainted by racism, with the state’s supreme court issuing a 2020 decision in favor of one such defendant.[3] Previously, in 2018, the Washington Supreme Court invalidated their state’s death penalty statute in its entirety, holding that “Washington’s death penalty is unconstitutional, as administered, because it is imposed in an arbitrary and racially biased manner.”[4]
Social scientists have been studying the death penalty—and consistency of its application—since the 1940s. There is now a sizable body of empirical research examining the impact of race on the imposition of capital punishment. Early studies found significant disparities in administration of the death penalty based on the race of defendants (Garfinkel 1949; Johnson 1957). Specifically, “these studies determined that Blacks were indicted, charged, convicted, and sentenced to death in disproportionate numbers” (Bowers et al. 1984, 69–70). However, these early works were criticized for failing to implement adequate statistical controls (Kleck 1981).
Subsequently, in 1983, Baldus, Pulaski, and Woodworth published what is still the most prominent and widely cited of the modern, controlled studies regarding race and the death penalty. Using data on more than two thousand death penalty cases in Georgia from the 1970s, they found that the race of the defendant was not a significant predictor of death penalty decisions. They did, however, find that offenders who killed White victims were more likely to receive the death penalty, even after controlling for numerous other relevant variables, including the nature of the crime, the location of the crime, and the characteristics of offender and victim (Baldus et al. 1983).
More recently, in 2004, Baldus and Woodworth noted that “empirical evidence generally suggests that the United States death penalty system is no longer characterized by the systemic discrimination against Black defendants.” Nevertheless, numerous studies have found sentencing disparities based on the race of victims. In reviewing extant research on the issue, Radelet and Borg (2000, 47) concluded that “the death penalty is between three and four times more likely to be imposed in cases in which the victim is White rather than Black.” The conclusion that many draw from this line of research is that Black lives don’t matter to the criminal justice system, at least not as much as White lives do.
Prosecutorial Discrimination
As Zeisel (1981) observed, prosecutors are pivotal players in the administration of the death penalty. Under modern death penalty procedures, prosecutors must decide prior to trial whether to seek capital punishment; juries can consider the punishment of death only in those cases where the prosecutor has decided to seek the ultimate penalty. Thus it is not surprising that much of the research into death penalty discrimination has focused on prosecutorial decisions.
There is considerable evidence that prosecutors are more likely to seek the death penalty in cases in which victims are White, especially when Black defendants are the accused killers (Bowers and Pierce 1980; Hindson, Potter, and Radelet 2006; Keil and Vito 1995; Lenza, Keys, and Guess 2005; Paternoster, Soltzman, Waldo, and Chiricos 1983; Paternoster 1984; Paternoster, Brame, Bacon, and Ditchfield 2004; Radelet and Pierce 1985; Songer and Unah 2006; Williams, Demuth, and Holcomb 2007). In fact, one study found that Black defendants accused of killing White victims were five times more likely to face the death penalty than Black defendants charged with killing other African Americans (Lenza et al. 2005).
What explains the discrepancy with respect to the race of victims? White (1991, 157) suggests the discrepancy reflects a society that values White lives more than Black ones, imputing that prosecutors may share those values. As elected officials, after all, prosecutors are concerned with the reactions of the communities they serve. The murder of a Black victim, especially if he or she has lower socioeconomic status, might be less likely to produce a public outcry for the ultimate sanction. The murder of a White victim, especially when the perpetrator is Black, could be more likely to spark outrage in the dominant community; in such cases, it may be politically risky for prosecutors to drop the death penalty in exchange for a guilty plea.
Discrimination by Juries
Prosecutorial discretion is not the only possible source of racial bias in the administration of the death penalty. One also must examine the behavior of juries, which are charged with deciding between life and death in capital murder trials.
Bowers, Pierce, and McDevitt (1984, 338–39) argue that jurors “embody community sentiments” by having their own preconceived notions of societal members, and as a result, “jurors have difficulty replacing their socially conditioned views of victims and offenders with strictly legal considerations, especially for the crimes they find most shocking and abhorrent,” allowing for “extralegal” factors to intrude on the interpretation of aggravating and mitigating factors presented at sentencing.
From a related perspective, Gross and Mauro (1989) argue that a juror’s decision to sentence a defendant to death is influenced by the ability to identify with the victim, rather than seeing the victim as a stranger. They suggest that White “jurors are more likely to be horrified by the killing of a White than of a Black, and more likely to act against the killer of a White than the killer of a Black,” which is “a natural product of the patterns of interracial relations in society” (Gross and Mauro 1989, 113).
Capital Punishment in Tennessee
From the time capital punishment was reinstated in Tennessee in 1977 until 2018, 193 defendants convicted of first-degree murder have been sentenced to death.[5] Yet there are only 51 inmates on Tennessee’s death row today: 23 are White, 26 are Black, 1 is Hispanic, and 1 is Asian.[6] The attrition of Tennessee’s death row population is due more to natural death, reversals of sentences by appellate courts, executive clemency, and exonerations than to actual executions. Only 13 inmates have been put to death in Tennessee since 1977,[7] but seven executions have occurred since 2018, increasing the political salience of capital punishment in the state.
We choose to focus our study on Tennessee for several reasons. First, nearly all the studies of this kind have focused on one state. The overwhelming majority of death penalty cases occur at the state level and each state has its own death penalty procedures and statutory factors governing the applicability of capital punishment.
The literature in this area has grown incrementally over the decades as additional states have been subjected to the kind of analysis we perform herein. Of course, there is also the opportunity factor. Tennessee has produced records that can be translated into a data set, giving us the opportunity to add an analysis of this state’s death penalty behavior to the literature.
Hypotheses
In line with the literature discussed above, we do not expect to see significant differences in prosecutorial or jury behavior based on the race of the defendant, but we do expect significant differences based on the race of the victim. Specifically, we hypothesize that: (1) Defendants convicted of murdering White victims are more likely to have been selected for the death penalty by prosecutors; and (2) In the subset of cases selected for the death penalty, defendants convicted of murdering White victims are more likely to be sentenced to death by juries. We expect these hypotheses to hold even after controlling for a series of other variables relating to defendants, victims, and crime characteristics.
Data and Methods
Our data are derived from documents prepared pursuant to Tennessee Supreme Court Rule 12, which mandates the completion of detailed reports on first-degree murder convictions. In all cases resulting in a first-degree murder conviction, irrespective of the sentence, Tennessee trial judges are required to complete a section of a Rule 12 form for each convicted defendant. Prosecutors and defense attorneys also must complete certain sections of the Rule 12 form. The Rule 12 form asks for numerous facts about the criminal case as well as background information on both the defendant and victim(s). Once completed, the forms are transmitted to the Tennessee Administrative Office of the Courts.
Reports are scanned, summarized, compiled, and made public by the Administrative Office, which updates the compilation and releases a new CD-ROM every year. The 2017 update to the Rule 12 database contains summaries of 1,555 murder convictions rendered by Tennessee trial courts from 1977 to 2016, inclusive. Unfortunately, the summaries, which are unsorted image files, must be individually coded and entered into a statistical program (STATA). Also problematic is the level of missing data on many of the background variables. Fortunately, with the assistance of several diligent students, we were able to fill in many of the gaps in the summaries by reading newspaper reports and appellate court opinions.[8]
Unfortunately, not all first-degree murder convictions are included in the Rule 12 database. A 2018 study by two Tennessee attorneys found that more than 1,000 first-degree murder convictions have been omitted from the Rule 12 database, simply because trial judges failed to submit the required forms (MacLean and Miller 2018). Undaunted, we proceed with our analysis, but our next task (beyond the scope of this paper) will be to more fully incorporate these missing cases into our dataset.
Our primary analysis herein focuses upon all defendants convicted of first-degree murder in the state of Tennessee from 1977 through 2016 for which a Rule 12 report exists. We examine the role of race (both for defendant and victim) in the following: (1) the prosecutor’s decision to seek the death penalty, and (2) the jury’s decision to return a death sentence. Dichotomous dependent variables are created for each of these considerations.
The dataset also contains numerous variables relating to defendants, victims, and crime characteristics, many of which we utilize as independent variables in our statistical models. Beyond that, we include control variables related to the quality (and types) of evidence presented to jurors in capital cases, a matter that some previous literature has neglected. Based on the literature, our hypothesis is that race of the victim will have a significant impact on both of our dependent variables, even after appropriate controls are introduced.
Because our dependent variables are dichotomous, we employ logistic regression. We have estimated two models: one in which the dependent variable is the prosecutor’s decision to seek the death penalty; and another for the subset of cases in which the prosecutor sought the death penalty. In both models, a pro-death penalty decision is coded 1 (in the first model, for a prosecutor’s decision to seek the death penalty, and in the second model, for a jury’s decision to impose a death sentence).
In keeping with the previously discussed literature, our primary independent variables are the race of the defendant, labeled Black Defendant, and the race of the victim, labeled White Victim. As noted above, we expect that the race of the defendant will not be a relevant consideration, but we hypothesize that the race of the victim will. We also include thirteen control variables that are drawn from the literature. We divide these variables into four categories: (1) Characteristics of the Homicide; (2) Evidence Against the Defendant; (3) Victim Traits; and (4) Defendant Traits.
Characteristics of the Homicide
To account for the possibility that different types of homicides could be evaluated differently by prosecutors and juries, our first set of controls pertains to the nature of the homicide.
Three or More Victims is coded 1 when a defendant kills three or more victims within the same crime spree or within a forty-eight-month period. We select three victims or more because that is a statutory aggravating factor for the death penalty in the state of Tennessee; specifically, the statute references three victims in a “single episode” or in a forty-eight-month period—and our coding is tailored accordingly.[9] Previous studies have controlled for the number of victims and found that the likelihood of a death sentence increases with that number (see Baldus et al. 2009; Phillips 2008; Pierce and Radelet 2011; Radelet and Pierce 1985; Unah 2009; Weiss et al. 1996).
Dangerous Concurrent Crime is coded 1 when the homicide was accompanied by any one of the following: arson, robbery, burglary, kidnap, aircraft piracy, child abuse, or a bombing. Each of these categories is listed separately in the Rule 12 database, and we collapse them into a single variable where the presence of just one is coded as 1, and the absence of all is coded as 0. Prior literature has addressed this matter in different ways. Phillips (2008) accounts for the presence of additional felonies like these by listing them individually as controls in a regression model. Pierce and Radelet (2011) use a count variable to find that each additional felony increases the likelihood of a death sentence. However, in keeping with the work of Weiss et al. (1996) and Radelet and Pierce (1985), we elect to collapse the presence or absence of one of these crimes into a single dichotomous variable. Kremling et al. (2007) discuss differences between count and dichotomous variables that account for felonies in regression models like ours and imply that the presence of a felony is likely to increase the likelihood of a death sentence regardless of exactly how a regression model captures additional crimes.
Rape is coded 1 to account for a homicide that was accompanied by a rape. Songer and Unah (2006) and Unah (2009) highlight the need for considering this matter as a separate control in isolating a more heinous murder, as does the work of Phillips (2008) and Williams et al. (2007). Thus we treat this as a separate variable, distinct from the previous variable that collapses other felonies together. We expect that homicides accompanied by rape will be more likely to result in a capital charge from a prosecutor and an overall death sentence from a jury.
Abnormal Method of Killing is coded 1 if any of the following “unusual” methods of killing occurred: stabbing, throat-slashing, drowning, beating, poisoning, burning, strangling/suffocating, pushing off a high building, or hitting with a vehicle. The relationship between method of killing and likelihood of a capital sentence has not been addressed extensively in the literature, but Phillips (2008, 820) addresses this matter without finding statistically significant results. We suspect that an unusual method of taking a life might be perceived as more heinous (perhaps more so by juries than by prosecutors), and thus may be more likely to lead to a death sentence.
Urban County is coded 1 for each of the four Tennessee counties that contain the state’s largest cities: Knox County (Knoxville), Davidson County (Nashville), Shelby County (Memphis), and Hamilton County (Chattanooga). Paternoster et al. (2004, 44) note that death penalty studies should control for potential jurisdictional differences, as “any attempt to deal with any racial disparity in the imposition of the death penalty…cannot ignore the substantial variability that exists in different state’s attorneys’ offices in the processing of death cases.” Pierce and Radelet (2002, 2005) offer two articles that control for differences between urban and rural jurisdictions, noting that rural jurisdictions are more likely to impose capital punishment for similar offenses, perhaps because heinous crimes in such areas may be more likely to “shock” the collective conscience of jurors.
Evidence against the Defendant
We also include a set of control variables that previous literature has failed to address in depth: the nature of the evidence against the defendant. In terms of how this information might interact with race, Pierce and Radelet (2002, 41) suggest that the race of a victim “might correlate with the amount of resources that law enforcement devotes to gathering evidence.” Berk et al. (2005) do control for defendant statements, eyewitness testimony and informant testimony in their study of race and the death penalty. We control for the following:
Familiar Witness ID is coded 1 if the defendant is identified as the killer by either a police officer or, as the Rule 12 database says, a “familiar person.”
Confessed is coded 1 when the defendant confessed to committing the homicide.
Scientific Evidence is coded 1 if scientific evidence linked the defendant to the homicide.
Coperpetrator Testified is coded 1 if a coperpetrator testified against the defendant.
We expect that the presence of these types of evidence should make prosecutors’ decisions to seek capital charges and juries’ decisions to impose death sentences more likely, as these factors reduce the uncertainty involved in determining a verdict and attenuate concerns over potentially unjust outcomes.
Victim Traits
White Victim is our primary independent variable and is coded 1 when the victim is white and 0 in all other cases.[10] We expect that homicides involving white victims will be more likely to result in a prosecutor’s charge of a capital offense and also will be more likely to result in a death sentence from a jury, as discussed in our literature review.
Female Victim is coded 1 if the victim is a female. In this regard, Unah (2009, 160) notes that “White females are perceived as a subgroup deserving of special protection and this has often led to differential responses to their victimization.” Williams et al. (2007, 870) note that “several studies find that cases with female victims are more likely to receive a death sentence than cases with male victims.” Their own research finds that the victim’s sex is more relevant to juries than to prosecutors, a distinction that our models will reconsider (Williams et al. 2007, 884).
Victim Was Law Enforcement or Public Official is coded 1 if a law enforcement officer or public official is the victim. It seems logical to suggest that killing a police officer is likely to be perceived as more heinous by both prosecutors and juries (Cheatwood 2002, 863). It would seem reasonable that prosecutors and juries would perceive the killing of a public official in much the same way.
Defendant Traits
Black Defendant is coded 1 for a Black defendant and 0 for all others. Conventional wisdom from some scholars holds that Black defendants are more likely to receive the death penalty, but research suggests this may not be the case.
Previous Violent Felony is coded 1 when a defendant has a previous conviction for a violent felony. Along these lines, Phillips (2008, 820) says that a violent criminal history can impact the likelihood of a death sentence, as do Weiss et al. (1996, 623) and Baldus et al. (2009, 584). Pierce and Radelet (2002, 78) also state that “the defendant’s prior criminal history [is] generally considered to be an important factor in the imposition of the death penalty,” with such a history increasing the likelihood of a death sentence.
Male Defendant is coded 1 if the defendant is male. Streib (1990) offers a study of cases from 1900 to 2005 and finds that females are less likely to face the death penalty than males. In discussing Streib’s work, Songer and Unah (2006, 183) observe: “Empirical evidence suggests widespread reluctance on the part of prosecutors, judges and juries to sentence female offenders to death.” Hindson et al. (2006, 572) also find that prosecutors seek the death penalty more often against males.
Results
Before delving into our regression models, we provide some baseline statistics related to our sample of cases. The first noteworthy finding is that Blacks are disproportionately represented among persons convicted of first-degree murder (see table 1). Although Blacks make up about 17 percent of Tennessee’s population, they represent 48 percent of the first-degree murder convictions in our data. While it may be the case that murder rates vary by race, this discrepancy may also represent systemic discrimination in that White defendants may have been more likely to secure acquittals or convictions for lesser homicides through plea bargaining. Inequality in legal representation may well be involved here. While potentially important, that issue is beyond the scope of the instant research.
Between 1977 and 2016, prosecutors in Tennessee sought the death penalty in 26 percent of first-degree murder cases that resulted in convictions. In 42 percent of these cases, juries returned death sentences; thus, 11 percent of all first-degree murder convictions resulted in death sentences. Table 1 suggests that being White actually increased a defendant’s likelihood of being selected for, and receiving, capital punishment, as did the alleged killing of a White victim.
| % of all first-degree murder convictions
(n=1555) |
% cases where prosecutor sought the death penalty
(n=410) |
% cases where jury returned a death sentence
(n=172) |
|
|---|---|---|---|
| Defendant’s race | |||
| White | 49% | 57% | 62% |
| Black | 48% | 40% | 35% |
| Other | 3% | 3% | 3% |
| Race of victim(s) | |||
| White | 61% | 73% | 75% |
| Black | 35% | 25% | 24% |
| Other | 4% | 2% | 1% |
Table 1: Racial profiles of cases
Note: Interpret table as follows: Of all cases in the dataset, 49 percent involved White defendants; in cases where the prosecutor sought the death penalty, 57 percent of defendants were White, and so on.
Figure 1 compares the rates at which prosecutors sought, and juries returned, death sentences—intersecting the race of defendants and race of victims. It shows that prosecutors were more likely to seek the death penalty, and juries more likely to opt for death, when victims were White. Thus at first glance, we may have evidence in support of our hypothesis that prosecutors and juries engage in discrimination based on the race of the murder victim. The race of defendants does not appear to have mattered as much to prosecutors. However, juries were more likely to return death sentences when both defendants and victims were White.
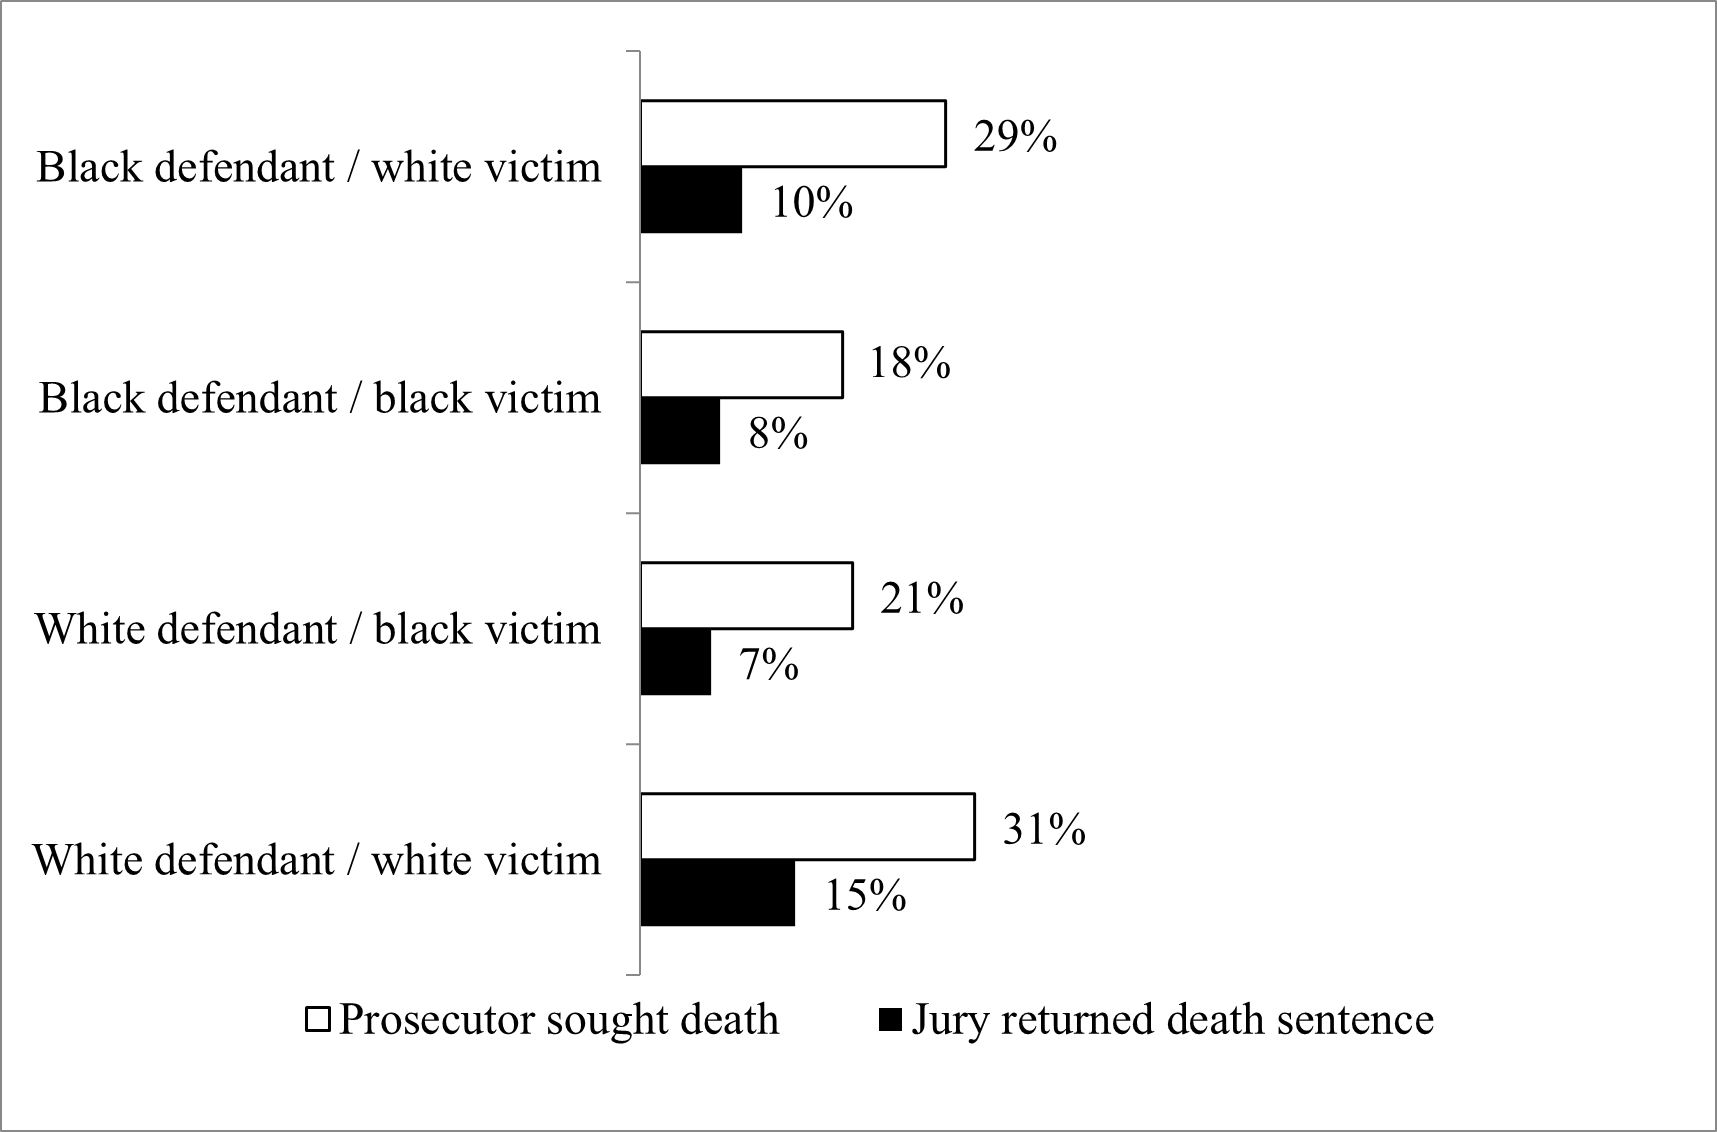
Rates at which prosecutors sought and juries returned death sentences by race of defendants/victims
Note: Interpret this figure as follows: Prosecutors sought capital punishment in 29 percent of cases where Black defendants were accused of killing Whitevictims, and so on.
Figure 2a displays the rate at which prosecutors sought the death penalty for White defendants and Black defendants over the period of our study. The most striking feature of the graph is the more or less steady decline in the rate at which prosecutors sought the death penalty, irrespective of the race of defendants. With regard to race of defendants, the graph shows that, in most years, prosecutors sought the death penalty at a slightly higher rate when defendants were White.
Figure 2b compares the rate, over time, at which prosecutors sought the death penalty when there were White victims and Black victims. It does show that, in most years, prosecutors were more likely to seek the death penalty when murder victims were White.
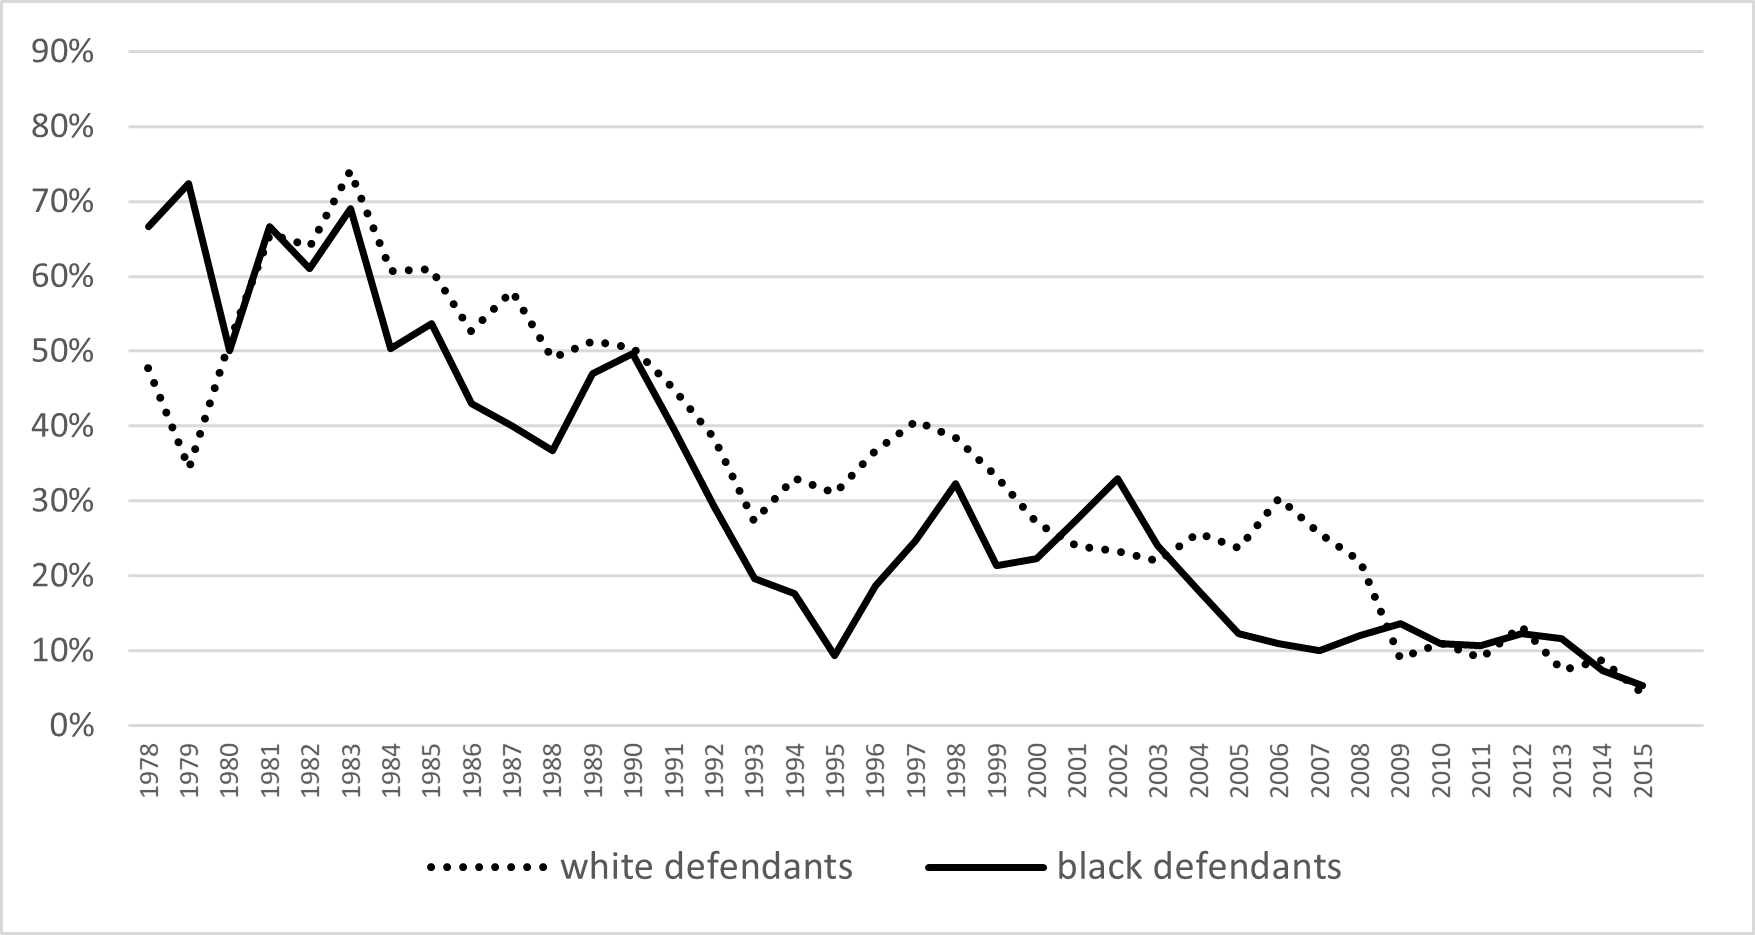
Prosecutors sought death penalty by race of defendant
(3-yr moving avg)
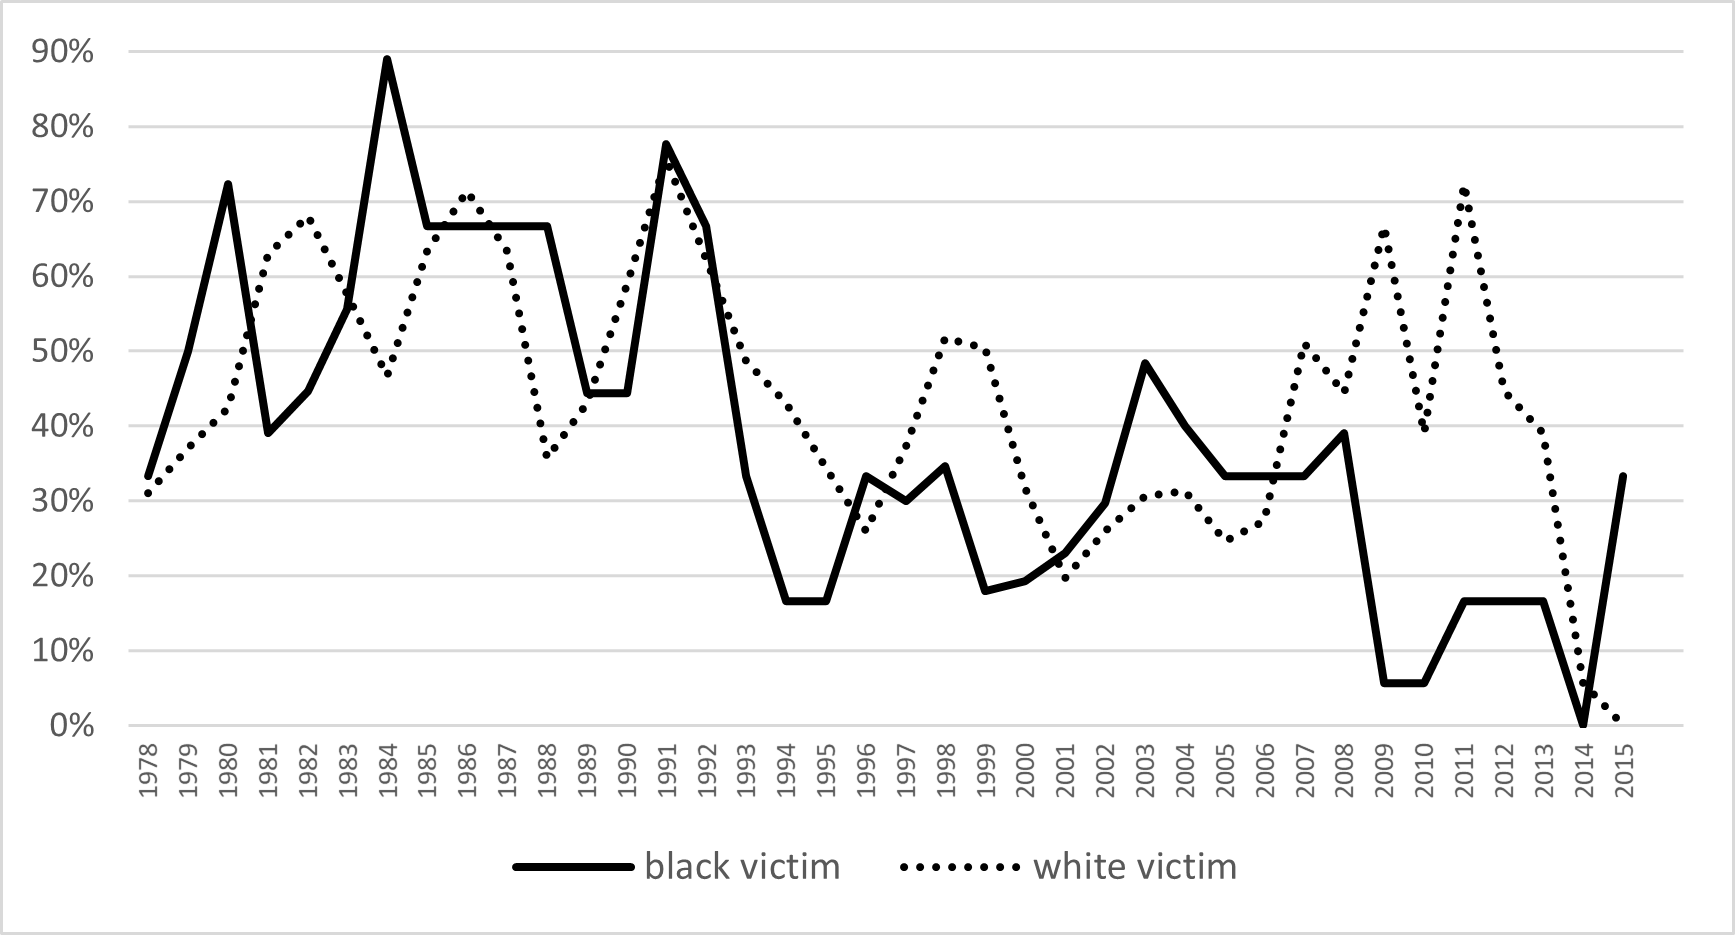
X-Figure 2b
Prosecutors sought death penalty by race of victim
(3-yr moving avg)Figure 3a shows the rate at which juries sentenced White and Black defendants to death; figure 3b displays the same for White and Black victims. Figure 3a shows that, in most years, juries were more likely to return death sentences when defendants were White. Figure 3b indicates that juries were more likely to opt for death when victims were White.

Jury imposed death sentence by race of defendant
(3-yr moving avg)
Jury imposed death sentence by race of victim
(3-yr moving avg)
Thus far, the data appear to support our hypotheses. The next step is to determine whether these apparent racial differences persist when other factors are taken into account. To this end, we turn to our logistic regression models. In addition to examining the race of defendants and victims as independent variables, we incorporate our series of independent variables related to the other traits of defendants and victims, the characteristics of crimes, and the nature of the evidence presented by the state.[11] We develop two models, one focused on the prosecutor’s decision to seek the death penalty, the other focused on the jury’s decision to return a death sentence.
A Model of the Prosecutor’s Decision to Seek Capital Punishment
Table 2 provides the results of a logit model where the dependent variable is the prosecutor’s decision to seek the death penalty. Although the defendant’s race is not a significant predictor of prosecutorial decisions to seek the death penalty, the race of the victim is, as we expected, a significant predictor of prosecutors’ behavior. When the victim is White, ceteris paribus, the prosecutor is approximately 1.5 times more likely to seek a death sentence. However, it should be noted the effect of a female victim is just as strong—also approximately 1.5 times more likely for the prosecutor to seek death in such cases.
| Independent variables | Coefficient | P value | Standard error | Odds ratio |
|---|---|---|---|---|
| Victim traits | ||||
| White victim | .395** | .016 | .163 | 1.48 |
| Female victim | .391*** | .004 | .135 | 1.48 |
| Law enforcement or public official | 1.58*** | .000 | .414 | 4.83 |
| Defendant traits | ||||
| Black defendant | -.181 | .269 | .164 | .835 |
| Male defendant | .279 | .306 | .273 | 1.32 |
| Previous violent felony | .672*** | .000 | .126 | 1.96 |
| Crime traits | ||||
| Urban county | .010 | .941 | .135 | 1.01 |
| Three or more victims | 1.72*** | .000 | .334 | 5.6 |
| Abnormal method of killing# | .150 | .266 | .135 | 1.16 |
| Dangerous concurrent crime^ | .284** | .027 | .129 | 1.3 |
| Concurrent rape | 1.07*** | .001 | .454 | 2.92 |
| Evidence | ||||
| Coperpetrator testified | .580*** | .006 | .212 | 1.79 |
| Familiar witness ID | .486* | .090 | .287 | 1.63 |
| Defendant confessed | .911*** | .000 | .203 | 2.49 |
| Scientific evidence | .483* | .069 | .266 | 1.62 |
| Constant | -2.43 | .000 | .310 | |
| Pseudo R-squared | .10 | |||
| Correctly classified | 75.4% | |||
| Number of cases | 1555 |
Table 2: Logit model of prosecutor’s decision to seek the death penalty
Dependent Variable = Prosecutor Sought Death Penalty
# = stabbing, throat-slashing, drowning, beating, strangle/suffocate, poisoning, burning, pushing off high building, or hitting with a vehicle
^ = arson, robbery, burglary, kidnap, aircraft piracy, child abuse, theft, or bombing
*= p<.10; **= p<.05; ***= p<.01; two-tailed test
While the effect of the victim’s race on prosecutorial decisions is not completely eliminated by our controls, we should note that several other factors appear to have a much greater effect on prosecutors. In particular, the killing of a law enforcement agent or public official (4.83 times more likely), a murder accompanied by rape (2.92 times), a murder accompanied by a dangerous concurrent crime other than rape (1.3 times), the presence of three or more victims (5.6 times), and a defendant’s prior violent felony conviction (1.96 times) all had a statistically significant impact in increasing the likelihood of a prosecutor’s decision to seek the death penalty. Moreover, all four of our evidence variables, including the presence of scientific evidence (1.62 times), an identification from a witness previously familiar with the defendant (1.63), a coperpetrator’s testimony against the defendant (1.79 times), and a defendant’s confession (2.49 times), are all statistically significant.
A Model of the Jury’s Decision to Return a Death Sentence
Table 3 presents the same logit model, except here the dependent variable is the jury’s decision to return a death sentence. This analysis is limited to the 26.4 percent of all cases where prosecutors sought the death penalty. For table 3, unlike in the previous model, and contrary to our hypothesis, the race of the victim does not have the expected impact on juries. In fact, when everything else is taken into account, the presence of a White victim appears to reduce the odds that the jury will opt for death (although the coefficient is not statistically significant). However, if the victim is a member of law enforcement or a public official, the odds ratio indicates a greater likelihood (6.3 times) of the jury imposing a death sentence.
| Independent cariables | Coefficient | P value | Standard error | Odds ratio |
|---|---|---|---|---|
| Victim traits | ||||
| White victim | -.138 | .676 | .329 | .871 |
| Female victim | .342 | .194 | .264 | 1.41 |
| Law enforcement or public official | 1.84*** | .006 | .663 | 6.3 |
| Defendant traits | ||||
| Black defendant | -.996*** | .003 | .338 | .369 |
| Male defendant | 1.17* | .086 | .681 | 3.22 |
| Previous violent felony | 1.48*** | .000 | .253 | 4.42 |
| Crime traits | ||||
| Urban county | .647** | .016 | .268 | 1.91 |
| Three or more victims | -.287 | .554 | .485 | .750 |
| Abnormal method of killing# | .-.215 | .410 | .261 | 1.24 |
| Dangerous concurrent crime^ | .082 | .730 | .239 | 1.08 |
| Concurrent rape | .101 | .834 | .481 | 1.11 |
| Evidence | ||||
| Coperpetrator testified | 1.65*** | .000 | .386 | 5.22 |
| Familiar witness ID | 1.29** | .014 | .524 | 3.63 |
| Confessed | 1.17*** | .001 | .339 | 3.21 |
| Scientific evidence | 1.49*** | .001 | .450 | 4.41 |
| Constant | -3.02 | .000 | .746 | |
| Pseudo R-squared | .199 | |||
| Correctly classified | 73.66% | |||
| Number of cases | 410 |
Table 3: Logit model of jury's decision to impose the death penalty
Dependent variable = jury returned death sentence
# = stabbing, throat-slashing, drowning, beating, strangle/suffocate, poisoning, burning, pushing off high building, or hitting with a vehicle
^ = arson, robbery, burglary, kidnap, aircraft piracy, child abuse, theft, or bombing
*= p<.10; **= p<.05; ***= p<.01; two-tailed test
The race and sex of the defendant do have some impact on juries—but maybe in a manner that some would find surprising. First, Black defendants actually are less likely than Whites to get the death penalty (odd ratio of .369); males, though, are much more likely than females to be sentenced to death (odds ratio of 3.22).
It is noteworthy that juries appear to be strongly influenced by the nature of the evidence. The testimony of an alleged coperpetrator (5.22 times), a confession by the defendant (3.21 times), an identification of the defendant by a familiar witness (3.63 times), and the presence of scientific evidence (4.41 times) all make juries much more likely to hand down death sentences. The defendant having a previous felony conviction also appears to have a large impact in the same direction, just as it did with prosecutors (odds ratio of 4.42). Ultimately, this may serve as a positive pronouncement regarding the imposition of capital punishment in Tennessee, as the evidence variables appear to carry greater explanatory clout than do variables related to racial characteristics (whether of the defendant or the victim). Finally, we also note that juries in urban counties appear to be more likely to return a death sentence than juries in rural counties (odds ratio of 1.91). A theoretical explanation for this finding might be related to increased crime rates in such regions, and a potential for jurors to respond with a “tougher” stance on criminal conduct; future research may wish to address this matter more specifically.
Discussion
Our hypotheses were only partially supported by the analysis. Although Tennessee prosecutors were more likely to seek the death penalty when the victim of a death-eligible homicide was White, juries were not impacted by the race of the victim when it came to imposing a death sentence, while controlling for a litany of variables related to the victim, the defendant, the homicide itself, and the nature of available evidence. Moreover, race-of-defendant effects are not apparent in our research, as Black defendants in Tennessee were neither more likely to be charged with a capital crime by prosecutors nor more likely to be sentenced to death by a jury. Additionally, our research demonstrates that a defendant’s criminal history and whether a victim was a law enforcement or public official are very strong predictors of both prosecutorial decisions to seek and jury decisions to impose capital punishment. Generally, it seems likely that high-profile killings—such as those of public figures and those whom members of the community look up to as providing an important public service—would engender sentiments leading both prosecutors and jurors to support capital punishment. Along the same lines, the statistical significance of our criminal history variables could be indicative of a perception that defendants with prior violent felony convictions may be incapable of rehabilitation.
Furthermore, when it comes to juries, the types of evidence available, more so than the race of a victim, seem to have a powerful impact on the likelihood of a death sentence. Perhaps for some jurors, it follows, the quality of evidence can play a role in reducing concerns related to imposing a capital sentence on an innocent person. In that regard, our results may instill confidence in the jury system, especially since prosecutors could have motives other than seeking justice (e.g., electoral considerations) influencing their decisions. Buttressing this assertion is the finding that a prosecutor is more likely to seek a death sentence when a homicide victim is female; however, our research also demonstrates that a victim’s sex does not affect juries that are deciding whether to impose a capital sentence. Even so, juries appear less likely to impose a death sentence on female defendants than on male defendants, which may suggest that jurors are less sympathetic to male defendants sitting before them.
Concluding Thoughts
Our findings suggest that future research regarding capital punishment in this country should separate the prosecutorial decision to seek the death penalty from the jury decision to impose it, as different influences can impact each phase. Beyond that, future research also should account for the evidence that juries consider while pondering the implementation of this nation’s most severe criminal sentence; our results demonstrate that the nature and quality of evidence, perhaps even more than the racial demographics of relevant parties, plays a critical role in the imposition of capital punishment in the state of Tennessee.
Finally, given the importance of these evidence variables and the variables related to prior criminal history, we suggest that future research examine the interaction between the racial characteristics in our models and the variables that address evidence and prior criminal history—to assess whether the interplay between and among key variables holds any relevance for this process. In short, future research might wish to consider if the race of the victim might impact the level of urgency driving the evidence-collection process; thus, a subsequent paper could intersect evidence collection variables with the race of the victim and the race of the defendant in capital cases. Moreover, while our paper does not show evidence of explicit bias against defendants along racial lines, our finding that prior criminal history is a strong predictor of a death sentence could be masking underlying discrepancies in felony convictions across races, a matter that future research should confront more directly.[12] Overall, although this paper focuses only on the state of Tennessee, our work adds to a body of literature examining racial influences on prosecutorial discretion and jury decision-making in states that still utilize capital punishment.
References
Allyn, Bobby. 2019. “NC Supreme Court Hears Arguments on Racial Bias in Death Penalty Cases.” NPR, August 2019, https://www.npr.org/2019/08/26/754410571/n-c-supreme-court-hears-arguments-on-racial-bias-in-death-penalty-cases.
Baldus, David, Charles D. Pulaski, and George Woodworth. 1983. “Comparative Review of Death Sentences: An Empirical Study of the Georgia Experience.” Journal of Criminal Law and Criminology 74:661–753.
Baldus, David, Julie Brain, Neil Weiner, and George Woodworth. 2009. “Evidence of Racial Discrimination in the Use of the Death Penalty: A Story from Southwest Arkansas with Special Reference to the Case of Death Row Inmate Frank Williams, Jr.” Tennessee Law Review 76:555–613.
Barchenger, Stacey. 2018. “What 2,000 Cases Show about Tennessee’s Death Penalty.” Tennessean, October 1, 2018. https://www.tennessean.com/story/news/2016/10/01/what-2000-cases-show-tennessees-death-penalty/90426940/.
Berk, Richard, Azusa Li, and Laura Hickman. 2005. “Statistical Difficulties in Determining the Role of Race in Capital Cases: A Re-analysis of Data from the State of Maryland.” Journal of Quantitative Criminology 21:365–90.
Bowers, William J., and Glenn L. Pierce. 1980. “Arbitrariness and Discrimination under the Post-Furman Capital Statutes.” Crime and Delinquency 26 (4): 563–635.
Bowers, William J., Glenn L. Pierce, and John F. McDevitt. 1984. Legal Homicide: Death as Punishment in America, 1864–1982. Boston: Northeastern University Press.
Cheatwood, Derral. 2002. “Capital Punishment for the Crime of Homicide in Chicago, 1870–1930.” Journal of Criminal Law and Criminology 92:843–66.
Hindson, Stephanie, Hillary Potter, and Michael L. Radelet. 2006. “Race, Gender, Region and Death Sentencing in Colorado, 1980–1999.” University of Colorado Law Review 77:549–94.
Garfinkel, Harold. 1949. “Research Note on Inter- and Intra-racial Homicides.” Social Forces 27:369–81.
Gross, Samuel R., and Robert Mauro. 1989. Death and Discrimination: Racial Disparities in Capital Sentencing. Boston, MA: Northeastern University Press.
Johnson, Elmer. 1957. “Selective Factors in Capital Punishment.” Social Forces 6:165–69.
Johnson, Sherri Lynn. 2003. “Race and Capital Punishment.” In America’s Death Penalty, edited by S. Garvey, 121–43. Durham, NC: Duke University Press.
Keil, Thomas J., and Gennaro F. Vito. 1995. “Race and the Death Penalty in Kentucky Murder Trials: An Analysis of Post-Gregg Outcomes.” Justice Quarterly 19 (4): 633–72.
Kleck, Gary. 1981. “Racial Discrimination in Criminal Sentencing: A Critical Evaluation of the Evidence with Additional Evidence on the Death Penalty.” American Sociological Review 46:783–805.
Kremling, Janine M., Dwayne Smith, John K. Cochran, Beth Bjerregaard, and Sondra J. Fogel. 2007. “The Role of Mitigating Factors in Capital Sentencing before and after McKoy v. North Carolina.” Justice Quarterly 24:357.
Lenza, M., D. Keys, and T. Guess. 2005. “The Prevailing Injustices in Application of the Missouri Death Penalty (1978 to 1996).” Social Justice 32 (2): 151–66.
MacLean, Bradley A., and H. E. Miller Jr. 2018. “Tennessee’s Death Penalty Lottery.” Tennessee Journal of Law and Policy 13 (1): 84–256.
Paternoster, Raymond. 1984. “Prosecutorial Discretion in Requesting the Death Penalty: The Case of Victim-Based Discrimination.” Law & Society Review 18 (3): 437–78.
Paternoster, Raymond, Robert Brame, Sarah Bacon, and Andrew Ditchfield. 2004. “Justice by Geography and Race: The Administration of the Death Penalty in Maryland, 1978–1999.” Margins: The University of Maryland Law Journal of Race, Religion, Gender, and Class 4 (1): 1–98.
Paternoster, Raymond, Linda Soltzman, Gordon P. Waldo, and Theodore G. Chiricos. 1983. “Race of Victim and Location of Crime: The Decision to Seek the Death Penalty in South Carolina.” Journal of Criminal Law and Criminology 74:701–31.
Phillips, Scott. 2008. “Racial Disparities in the Capital of Capital Punishment,” Houston Law Review 45 (3): 807–40.
Pierce, Glenn, and Michael Radelet. 2002. “Race, Region and Death Sentencing in Illinois, 1988–1997.” Oregon Law Review 81:39–96.
———. 2005. “The Impact of Legally Inappropriate Factors on Death Sentencing for California Homicides.” Santa Clara Law Review 46:1–47.
———. 2011. “Death Sentencing in East Baton Rouge Parish, 1990–2008.” Louisiana Law Review 71:647–73.
Radelet, Michael, and Marian J. Borg. 2000. “The Changing Nature of Death Penalty Debates.” Annual Review of Sociology 26:43–61.
Radelet, Michael L., and Glenn L. Pierce. 1985. “Race and Prosecutorial Discretion in Homicide Cases.” Law & Society Review 19:587–621.
Songer, Michael J., and Isaac Unah. 2006. “The Effects of Race, Gender, and Location on Prosecutorial Decisions to Seek the Death Penalty in South Carolina.” South Carolina Law Review 58:161–210.
Streib, Victor. 1990. “Death Penalty for Female Offenders.” University of Cincinnati Law Review 58:845–80.
Unah, Isaac. 2009. “Choosing Those Who Will Die: The Effect of Race, Gender, and Law in Prosecutorial Decisions to Seek the Death Penalty in Durham County, North Carolina.” Michigan Journal of Race and Law 15:135–79.
Weiss, Robert, Richard Berk, and Catherine Lee. 1996. “Assessing the Capriciousness of Death Penalty Charging.” Law & Society Review 30:607–38.
White, Welsh. 1991. The Death Penalty in the Nineties: An Examination of the Modern System of Capital Punishment. Ann Arbor: University of Michigan Press.
Williams, Marian, Stephen Demuth, and Jefferson Holcomb. 2007. “Understanding the Influence of Victim Gender in Death Penalty Cases: The Importance of Victim Race, Sex-Related Victimization, and Jury Decision-Making.” Criminology 45:865–92.
Woolverton, Paul. 2018. “NC Supreme Court to Hear Racial Justice Act Death Row Cases.” Fayetteville Observer, March 2, 2018. https://www.fayobserver.com/news/20180302/nc-supreme-court-to-hear-racial-justice-act-death-row-cases.
Zeisel, Hans. 1981. “Race Bias in the Administration of the Death Penalty: The Florida Experience.” Harvard Law Review 95:456–68.
Classroom Exercises
- Have a discussion on the problem of selection bias as it relates to the instant research. Could it be that African Americans are overrepresented in the data set because White defendants were more likely to be convicted of lesser forms of homicide as the result of plea bargaining? If this were true, would it affect the findings regarding discrimination based on the race of defendants as well as crime victims?
- Ask students to find the statutory aggravating factors provided in different state statutes. Each student could be assigned a different state. This would require students to learn how to locate and read state statutes. When the information has been collected, have a discussion on how these factors vary across states. To facilitate this exercise, a compendium of statutory aggravating factors can be found at https://deathpenaltyinfo.org/facts-and-research/crimes-punishable-by-death/aggravating-factors-by-state.
- Buck v. Davis, 580 U.S. ___ (2017), https://supreme.justia.com/cases/federal/us/580/15-8049/#tab-opinion-3694347. ↵
- Flowers v. Mississippi, 588 U.S. ___ (2019), https://www.supremecourt.gov/opinions/18pdf/17-9572_k536.pdf. ↵
- State of North Carolina v. Cedric Theodis Hobbs Jr., No. 263PA18 (Supreme Court of North Carolina, May 1, 2020), https://appellate.nccourts.org/opinions/?c=1&pdf=39338; for additional reading, see Allyn (2019); Woolverton (2018). ↵
- State of Washington v. Allen Eugene Gregory, no. 88086-7, October 11, 2018, 40, https://cases.justia.com/washington/supreme-court/2018-88086-7.pdf?ts=1539270669. ↵
- Barchenger (2018). ↵
- Tennessee Department of Correction, “Death Row Facts,” https://www.tn.gov/correction/statistics-and-information/death-row-facts.html. ↵
- Death Penalty Information Center, “Number of Executions by State and Region since 1976,” https://deathpenaltyinfo.org/number-executions-state-and-region-1976. ↵
- The authors wish to thank Kristen Wagers, Mariah Williford, William Gilman, and Sawyer Smith, all former students at the University of Tennessee, for their assistance in constructing our data set and filling in missing data. ↵
- Tennessee Code Annotated § 39-13-2004(i). ↵
- We have excluded from the analysis the small fraction of cases with multiple victims where the victims were not all of the same race. ↵
- While we have data on numerous variables in these categories, we have chosen to incorporate only those variables that are statistically significant in one or both of our models or those that are theoretically relevant to the analysis. ↵
- In our data, 48 percent of Black defendants had previously been convicted of one or more violent felonies, as opposed to 35 percent of Whites. The difference is significant at .000. ↵
