Public Opinion
29 Public Attitudes toward State Courts
Kenneth E. Fernandez and Jason A. Husser
State courts in the United States are the workhorses of the judicial system; they currently preside over 96 percent of the cases filed in the United States (National Center for State Courts 2018). In 2016, state trial courts in the United States had a caseload of over 14 million civil cases and 17 million criminal cases (National Center for State Courts 2016). Compare this to 291,851 civil cases and 77,357 criminal cases filed in US district courts that same year (United States Courts 2016). In addition, state courts have been highly active in reviewing and challenging state policies. For example, prior to federal court involvement, many state supreme courts began striking down bans on gay marriage (Kastellec 2018).
Yet state courts receive far less attention from scholars compared to courts at the federal level. Even more neglected is the study of public perceptions of state courts. Instead, researchers often focus on other branches of government, especially at the federal level. In the field of political science, there is a rich and diverse body of research on individual-level confidence in political institutions. This includes the presidency, the federal bureaucracy, Congress, and the US Supreme Court. This is driven by the concern that low levels of trust and support can be a symptom of serious problems in a democratic society, including lack of adequate political representation and even corruption. Low levels of confidence in political institutions can also produce or exacerbate problems, such as political apathy and low voter turnout or even noncompliance with the law. It is firmly believed that a healthy democracy requires a certain amount of institutional trust and support at all levels of government. However, support for national-level organizations tends to dominate scholars’ attentions at the expense of state government institutions.
Very few studies examine support for state political institutions, especially state courts (Berthelot, McNeal and Baldwin 2018). This lack of attention toward state courts is unfortunate given the caseloads these courts handle every year and that most public interaction with the courts is likely to occur at this level. In their study of state supreme courts, Curry and Romano (2018, 140) argue that well-functioning democracy requires the “perception that the system works for the benefit of citizens,” and this includes perceptions of the judicial system. Public opinion surveys allow researchers, citizens, judges, and other public officials to assess how courts are perceived in society. How the public views the courts is critical given that their power relies heavily on perceived legitimacy. As a former US Supreme Court justice, Felix Frankfurter stated in the Court’s ruling in Barr v. Carr, “The Court’s authority—possessed of neither the purse nor the sword—ultimately rests on sustained public confidence in its moral sanction” (1962, 268).
This chapter will examine public attitudes toward the state court system in a single state: North Carolina. We will first discuss the importance of studying state courts. We then briefly describe the structure of state courts. Findings from a survey conducted by the Elon University Poll in 2015 of over 1,234 state residents will then be presented. Statistical analysis of these survey data will be used to examine the various factors that influence people’s perceptions of state courts. We conclude by discussing the importance of public opinion research at the state level, especially in a federalist democracy.
The Importance of Studying State Courts and Public Opinion
The rule of law is considered one of the pillars on which democracy rests (O’Donnell 2004). O’Donnell describes the rule of law as the consistent and fair application of legal rules, where rules are applied without consideration of the “class, status, or relative amounts of power” of the parties involved. Furthermore, rules are applied through a “preestablished, knowable” (2004, 33) procedure that allows all stakeholders an opportunity to voice their case. The role of maintaining the rule of law often falls to the courts, particularly when an individual or group submits a grievance regarding the violation of or the unequal application of the law. For the courts to serve their function and help maintain the rule of law, they require a certain level of trust and support from the public (Caldeira and Gibson 1992). Although most of the scholarly (and media) attention focuses on the major decisions of higher courts (Olson and Huth 1998), the day-to-day decisions of the state and local courts address all dimensions of our social, economic, and political lives, from how land is used, to the power of public officials, to how the government itself is organized. Dolbeare (1976) makes the argument that state court cases have enormous capacity in determining the essence of politics, specifically “who gets what, when, and how” in state and local politics. William J. Brennan, a former US Supreme Court justice, once said that state courts were more important than federal courts because they deal with the issues that are most relevant to our daily lives (Brennan 1966). Clearly, such an institution deserves closer inspection by scholars and the public.
Because state courts affect our daily lives, citizens are very likely to have personal contact and experience with the state court system (Rottman 2015). They may be called to be a jury member, they may serve as a defendant or plaintiff, or they may be called to testify in court. In fact, some surveys have found that approximately half of citizens have had some contact with the lower courts (Olson and Huth 1998). Since this complex institution has frequent contact with the public, it is important that there is some level of accountability established for the court system. Elections can help hold courts accountable by removing judges who are deemed by voters as unacceptable; however, the removal of judges is very rare and only provides information that the judge was not retained. Therefore, we believe that public opinion (and public opinion surveys) can help provide specific information about how citizens feel about the courts and, in some cases, why they feel the way they do.
Unfortunately, prior literature reviews have shown that state courts are often neglected by researchers examining the judicial system in the United States. Furthermore, the study of public attitudes toward state courts is especially thin (Buckler, Cullen and Unnever 2007; Wenzel, Bowler and Lanoue 2003). Benesh points out that the “systematic analysis of public confidence in America’s lower courts has been missing” (2006, 697). This chapter will attempt to provide additional insights into how the public views state courts.
The Structure of State Courts
One reason there is less research on state courts is because the court system in each state is different, and each has changed over time. Starting in the early twentieth century, states began to reform their state judicial systems to consolidate the diverse and overlapping courts that appeared across the different localities (Hall 1999). By the 1970s, most states had combined all state and local courts into a unified, state-funded judicial system. In North Carolina, this unified state court system (which includes the supreme court, appeals courts, and trial courts) was created in 1965 and is called the General Court of Justice (https://www.nccourts.gov/). The General Court of Justice is funded and administered through the North Carolina Administrative Office of the Courts.
Even with these reforms and unifications, no two state court systems are alike. However, these systems do have many commonalities (Berkson 1980). They typically have a three-level structure that includes appellate courts, trial courts of general jurisdiction, and trial courts of limited jurisdiction.
State Supreme Court and Appellate Courts
All states have at least one state court of final resort, usually called the supreme court.[1] Most of these state supreme courts have five or seven justices, with all the justices participating in each case. These state supreme courts hear appeals of major questions arising from the lower courts. For example, in North Carolina there are seven supreme court justices who disposed of 136 cases during the 2017–18 session. There is no further appeal from decisions made by these courts regarding state law or state constitutional matters unless the issue also relates to a federal law or involves a right protected by the US Constitution. All but nine states also have an intermediate appellate court, often called the court of appeals, which hears appeals from the state trial courts (Cole and Smith 1998). For example, in the North Carolina Court of Appeals, there are fifteen judges divided into five panels of three judges to hear cases being appealed from lower courts in the state. In the 2017–18 session, the North Carolina Court of Appeals disposed of over 2,178 cases.
State Trial Courts
State trial courts are often divided into courts of general jurisdiction and limited jurisdiction. State trial courts of general jurisdiction are typically located in the county seat but are funded by the state. These courts hear both criminal (primarily felony crimes) as well as substantial civil cases. Courts of general jurisdictions go by different names depending on the state; in North Carolina, they are called superior courts. According to Berlin (2013), there are around three thousand trial courts of general jurisdictions in the United States, and each judge in these trial courts hears around 1,800 cases per year. In North Carolina, there are 107 superior court judges organized in eight divisions and forty-eight districts across the state. These judges hear all felony cases and civil cases involving amounts over $10,000. In the 2017–18 session, North Carolina superior courts disposed of 291,654 cases.
State trial courts of limited jurisdiction (also known as inferior courts or lower trial courts) hear smaller civil cases and less-serious criminal cases as well as preliminary matters in more serious cases. There are approximately 13,500 courts of limited jurisdiction in the United States (Cole and Smith 1998). In North Carolina, trial courts of limited jurisdiction are known as district courts. There are 272 district court judges in North Carolina organized into forty-one districts. These district court judges hear misdemeanor cases, preside over probable cause hearings, and hear guilty or no-contest pleas in some felony criminal cases. These lower courts also preside over civil cases involving $10,000 or less, and like most lower courts in the fifty states, they deal with domestic relations cases (e.g., divorce), juvenile cases, and commitments to mental health facilities (Silbey 1981).
Judicial Selection in the States
Unlike most judges serving in the federal court system, who receive lifetime appointments, judges in most states face some type of election. The fifty different states use a variety of methods to select and retain judges. Partisan elections for state judges, where candidates’ political party affiliations appear on the ballot, were popular in the 1800s, but in the twentieth century, many states, including North Carolina, changed to nonpartisan elections of judges (Glick 2004). Today, only eight states still elect most of their judges through partisan elections, while seven other states select some judges using partisan elections. Thirteen states use nonpartisan elections, while eight more use nonpartisan elections to elect some judges. Several states use a merit system to select judges. In a merit system, a regional or statewide panel of appointed lawyers and nonlawyers makes judicial nominations. Some states combine both a merit system and a retention election, allowing citizens to decide whether to keep an appointed judge in office. Two states, California and New Jersey, allow the governor to appoint higher-level court judges, and two other states, Virginia and South Carolina, allow the state legislature to appoint judges. Only Rhode Island appoints state judges for lifetime tenure. Massachusetts and New Hampshire appoint judges to tenured appointments that last until the age of seventy, which is the mandatory retirement age.
The selection of judges in North Carolina has been particularly interesting because of the number of procedural changes in recent years. Prior to 2002, North Carolina used partisan elections to select all judges in the state. In 2002, the state legislature passed a law that required all statewide judicial electoral races to be nonpartisan. This was designed to address the increasing level of fundraising, campaigning, and partisanship in state judicial elections (Troutman 2007). However, in 2016 and 2017, the North Carolina state legislature passed laws to return to partisan elections. Now in North Carolina, district court, superior court, appellant court, and state supreme court judges are selected through a partisan election.
Elections give the public a voice in how state courts operate by allowing voters to select judges and other court officials. Still, the public is sometimes wary of the value of these elections, suspicious that campaign contributions may cause conflicts of interest for court officials campaigning for reelection (Cann and Yates 2008; Gibson 2008). Some studies have found that electing judges can enhance the public’s trust in courts, while other studies have shown elections create skepticism among the public of judges and the courts (Gibson 2008; Rottman 2015). Public opinion surveys are useful in helping policy makers understand which selection methods promote trust in the courts and enhance the courts’ legitimacy. Furthermore, Curry and Romano (2018) maintain that elected judges, for good or bad, are more likely to take into consideration the public’s opinions when ruling on salient issues.
A Public Opinion Survey of North Carolina
As noted, there are few studies that examine public opinion of state courts; however, there are even fewer studies examining public attitudes toward the courts within a single state (Overby, Brown, Bruce, Smith and Winkle 2004). There are advantages to studying a single state. Since states differ in how they select judges, we can imagine that state variation in institutional mechanisms could influence how much the public trusts the courts (Wenzel, Bowler and Lanoue 2003). In a national survey, it is sometimes difficult to understand why an African American male respondent in California has a different opinion about his state courts than an African American male in North Carolina. It could be because one state has a higher crime rate or elects its judges and the other does not. Examining a single state allows researchers to study individuals within a single court system. All respondents in North Carolina are represented by the same judicial system and are governed by the same state laws and policies. Nicholson-Crotty and Meier (2002) argue that it is sometimes better to examine a single state than to collect data from all fifty. Many scholars of state courts believe that single-state studies can provide important insights into the judicial system (Dougherty, Lindquist and Bradbury 2006; Yates 2009).
There are also limitations to studying a single state. For example, it limits one’s ability to generalize the statistical findings to larger populations or other states (Olson and Huth 1998). For our purposes, however, we believe that collecting a healthy sample of residents in a single state helps ensure adequate coverage of certain subgroups, such as African Americans and rural county residents.
It should be noted that North Carolina is neither typical nor necessarily unique. With a population over ten million, North Carolina is the tenth most populous state in the nation. More importantly, North Carolina is a southern state, and the South has a unique history and culture, especially regarding trust in political institutions. Christensen found that “North Carolina remains culturally conservative, more like Alabama than California” (2008, 313). However, some scholars have suggested that North Carolina is different from the rest of the southern states and is more similar to the rest of the country (Vercellotti 2008).
Public Opinion and the Courts: The Elon University Poll
The Elon University Poll conducted a live-caller, dual-frame (landline and cell phone) survey of 1,330 adult residents of North Carolina between October 29 and November 2, 2015. Of these respondents, 1,234 answered all the questions used for weighting (age, gender, race, type of phone use).[2] The survey reported here has a margin of error of ±2.79 percentage points. The survey included various questions about state courts and other political issues. The list of the questions analyzed in this chapter and a link to the full survey report appears in the appendix.
The few studies that have examined public attitudes toward state courts have used different question wording to determine trust and support for state courts. For example, Olson and Huth (1998) ask respondents, “Do you believe the courts in Utah are doing a good job?” However, Benesh (2006) uses a survey item that asks respondents, “What is your level of confidence in the courts in your community?” Studies have shown how even slight wording differences in survey items can cause respondents to answer questions differently (Husser and Fernandez 2016).
Scholars have suggested that the above measures are imperfect because they are incapable of distinguishing between specific and diffuse public support. Researchers thus recommend using multiple survey items to capture different dimensions of public opinion toward the courts. Caldeira defines specific support as a “set of attitudes toward an object based upon the fulfillment of demands for particular policies or actions” (1991, 322) and therefore possibly more likely to change depending on the circumstances. On the other hand, diffuse support is described as more generalized and potentially more persistent. Caldeira and Gibson (1992) suggest that diffuse support may be based on a recognition of the basic legitimacy of the courts and their function in society. That support may persist even when a respondent is unhappy with a specific decision made by the courts (Gibson, Caldeira, and Spence 2003).
In this study, we ask about diffuse support and specific support for North Carolina state courts. To measure diffuse support, we ask respondents about the level of confidence they have in state courts (see table 1). For comparison, we also ask about confidence in five other political institutions: the federal government, the media, the US Supreme Court, local public schools, and local police or sheriffs. Respondents were specifically asked, “First, I’d like to know how much confidence you have in the following public institutions using the scale of very confident, somewhat confident, not very confident, or not at all confident. In general, how would you rate your confidence in the following?” The names of the political institutions were rotated randomly to avoid bias.
| Institution | % Somewhat or Very Confident |
|---|---|
| Local Police/Sheriff | 81.0 |
| NC State Courts | 65.9 |
| Local Public Schools | 65.8 |
| US Supreme Court | 65.0 |
| Federal Government | 37.2 |
| The Media | 35.6 |
Table 1. Confidence in Political Institutions
The public in North Carolina is generally quite confident in the local police or sheriff. Eighty-one percent of those surveyed said they were somewhat or very confident in this local institution. No other institution had such a high level of confidence. These findings are consistent with Walker’s (1977) study of North Carolina. Walker found that the public had very different levels of confidence regarding political institutions and that the public tended to have the highest support for law enforcement.
Nearly 66 percent of respondents stated they were somewhat or very confident in the North Carolina state courts. This was followed closely by local public schools, with 65.8 percent, followed by the US Supreme Court, with 65 percent. Confidence in the federal government and the media was the lowest among the six institutions, with 37 percent and 36 percent, respectively.
The survey also asks respondents a question on the fairness of the courts: “How often do people receive fair outcomes when they deal with the courts? Always, usually, sometimes, seldom, or never?” (see table 2). This question is more specific than just asking respondents about how confident they are in the courts; it requires them to evaluate court performance and behavior. Overall confidence may tap into “diffuse support” for the courts, whereas fairness may tap into “specific support” by stressing the institution’s performance and quality of service (Olson and Huth 1998; Tyler 1988). In addition, the survey asked respondents how they felt the state courts treated certain groups, including African Americans, whites, Hispanics, and people who are low income (see table 3).
| % | |
|---|---|
| Always | 3.1 |
| Usually | 36.9 |
| Sometimes | 41.6 |
| Seldom | 8.5 |
| Never | 2.2 |
| Don't Know | 7.6 |
| Refused | 0.1 |
| N= | 100% |
Table 2. Fairness of the Courts
| NC courts free from political influence | Judges influenced by political parties | Judges influenced by elections | |
|---|---|---|---|
| Strongly | 2.8% | 4.2% | 23.6% |
| Agree | 14.3% | 51.7% | 51.8% |
| Disagree | 44.7% | 16.3% | 16.2% |
| Strongly Disagree | 31.0% | 2.5% | 1.8% |
| Don't Know | 7.1% | 5.1% | 6.2% |
| Refuse | 0.1% | 0.2% | 0.5% |
Table 3. Political Influences on the Courts and Judges
A large proportion of respondents, nearly 42 percent, felt that people only sometimes receive a fair outcome in state courts (see table 2). Forty percent of respondents felt that people always (3.1 percent) or usually (36.9 percent) receive a fair outcome. Only about 2 percent of respondents said that people never get a fair outcome. However, when asked how the courts treat various groups, very different opinions emerged (see table 3). Approximately 76 percent of respondents believe that people without legal representation are treated worse by the courts. Low-income people were also seen as likely to receive unfair treatment (64 percent). Over half of those surveyed (53 percent) said non-English-speaking individuals were generally treated worse by courts. Forty-six percent of respondents believe African Americans are treated worse. Very few respondents believe that whites (4.1 percent) or wealthy individuals (1.6 percent) are treated worse by the courts. In fact, most respondents (51 percent) said the wealthy receive “far” better treatment in the courts.
| Group | % Saying Group is Treated (Somewhat or Far) Worse |
|---|---|
| People without a Lawyer | 76.2% |
| Low-income People | 63.8 |
| Non-English Speaking People | 53.4 |
| African Americans | 46.2 |
| Hispanics | 45.6 |
| Middle Class/Working Class People | 16.9 |
| White People | 4.1 |
| Wealthy People | 1.6 |
Table 4. Group Treatment by the Courts
Respondents were also asked about how politics influence judges’ decisions in North Carolina. They were asked if they agree or disagree that courts were free from political influence, that judges were influenced by political parties, and that judges were influenced by running for reelection (see table 4). Just over 75 percent of respondents disagreed or strongly disagreed that courts were free from political influence. Seventy-five percent also agreed (somewhat or strongly) that judges are influenced by political parties. Similarly, just over 75 percent agreed that judges are influenced by having to run for reelection.
It may be surprising that a survey can find that most residents not only have confidence in state courts but also believe the courts treat certain groups unequally and that judges are influenced by political forces. Prior research has also found similar contradictions in public attitudes toward the courts (Dougherty, Lindquist and Bradbury 2006; Silbey 1981). One reason for this is the complexity of public opinion. As noted earlier, the public can have diffuse support for the courts, where citizens are aware of the important role that courts play in our political systems. The public can also have more specific opinions about certain actions, policies, and even candidates. A citizen may not like a particular governor or a president, but she may have faith in the executive branch to function appropriately. Similarly, the public may be very aware that courts do not always produce fair outcomes but at the same time are relieved that the courts and the legal system are there to deal with local and state problems and disputes and respect the difficult job that judges do.
The above tables and results present a simple univariate analysis of the public attitudes toward state courts in North Carolina. Univariate analyses are useful for presenting a broad picture of public opinion; however, further analysis is required to better understand public opinion. In the next section, we will present findings from several ordered logistic regression models to explore more carefully how and why respondents have different attitudes toward the courts.
Regression Analysis: Examining Public Attitudes toward State Courts
In this section, we will use some of the survey questions discussed above as dependent variables in a series of regression models. These measures are all ordinal measures, meaning they measure attitudes using an ordered ranking, such as a four-point scale ranging from strongly agree to strongly disagree or a five-point scale ranging from far better to far worse. Because these measures are ordinal, an ordered logistic regression is used. In the following regression models, these measures (dependent variables) are regressed on a set of independent variables, which are discussed below. These independent variables are used to explain the variation in public attitudes toward state courts.
When deciding which independent variables may explain public attitudes, researchers often turn to different theories and models developed by prior scholars. A review of prior studies on public opinion of political institutions points to the following variables as important in understanding opinions toward state courts: respondent’s race, political party and ideology, age, gender, education level, prior experience with the courts, and knowledge of the courts. In addition, to these commonly used independent variables, this study will include a variable that also indicates if a respondent lives in a rural county.
Race of the Respondent: Race is one of the most studied variables when examining attitudes toward the legal system. Minority groups often have different experiences and perceptions of the role of courts and how courts apply the law across individuals from different ethnic and racial backgrounds. Much of the literature in the field of criminal justice has adopted a conflict perspective on the role of the criminal justice system in society. This perspective argues that laws, law enforcement, and the courts have been used to control subordinate/minority groups who are perceived to be a threat (Fernandez and Bowman 2004). Thus many studies have found that minorities are more distrustful of and less confident in the courts and law enforcement agencies (Berthelot, et al. 2018; Overby, et al. 2005). Here, we predict that African Americans, all things being equal, will have less positive attitudes toward state courts than whites.
Knowledge of the Court: One might expect that more knowledge about the courts would make it easier for citizens to evaluate the judicial system and its performance. However, Harris (1993) notes that many citizens probably obtain their knowledge of the courts through the media—mostly likely from television news and even crime dramas (Johnston and Bartels 2010; Rottman 2015; Selya 1996). As the media and TV shows tend to focus on more controversial behavior, more knowledge of the courts may actually result in less trust in the legal system (Daniels 1973; Olson and Huth 1998).
In this study, we measure knowledge through a survey item that asks respondents, “How much would you say you know about the courts in North Carolina? A lot, some, a little, or nothing at all?” A dichotomous independent variable was created where respondents who self-reported that they had a lot or some knowledge of the courts are coded as 1, and those respondents who reported that they had little or no knowledge were coded as 0. There are problems in relying on self-reported levels of knowledge. Some respondents may be embarrassed to admit they know little about a subject matter; however, the survey found that over 40 percent of those surveyed said they had little to no knowledge about state courts.
Experience with the Courts: Several studies test the independent effects of personal experience in the court system. It is difficult to predict how experience with the court may influence one’s attitude. The court system works in a complex way, and participants may leave the courtroom feeling far from satisfied (Walker, Richardson, Denyer and Williams 1972). Some studies have found that prior experience with the courts is strongly associated with perceptions of the court (Kritzer and Voelker 1998). In fact, Walker (1977, 11–12) found that prior interaction with the court was a stronger predictor of support than income, age, or even race. Others have found that prior experiences with courts had little or no correlation with an individual’s support for the courts (Buckler, Cullen and Unnever 2007). Other studies have found that certain types of interactions can influence one’s attitude toward the courts positively or negatively. Boyum (1992) found that jury duty in California was associated with increased levels of support for the courts. Benesh and Howell (2001) and Wenzel, Bowler, and Lanoue (2003) found that defendants were less supportive of the courts. In this study, we use two dichotomous variables, one that measured respondent’s jury service and one that measured respondent’s status as a party to a case.
Education Level: Education is included in almost all studies of public attitudes toward state courts because it is likely associated with a variety of other important underlying characteristics, including social status and knowledge of the court system. More educated residents will likely have more information about the legal system and the performance of courts. More educated respondents are also more likely to be concerned about inequalities in the political system (McCall and Kenworthy 2009). Education is measured using a dummy variable that indicates whether a respondent has a college or graduate or professional degree (coded as 1) or not (coded as 0).
Party Identification and Ideology: Although it may seem intuitive that ideology and partisanship are related to attitudes toward the courts, several studies found no correlation between court support and ideology or partisanship. Caldeira and Gibson (1992) argue that since most measures of support for the courts measure diffuse support, and diffuse support is so widespread across different individuals, ideology should not be related to such measures. Perhaps this is the reason most studies examining public opinion on state courts do not include an ideology measure in their analysis. Instead, most studies use party identification. Scholars may believe that partisanship is more important to understanding public opinion of the courts because the selection of judges has become such a partisan issue among politicians and elected officials (Bonica and Sen 2017). Research has suggested that Democrats have a more favorable opinion of the US Supreme Court than Republicans, and this may hold true for state courts as well (Cann and Yates 2008).
It should be noted that party identification is often correlated with ideology, but in the South, there are still conservative Democrats who have not switched over to the Republican Party. These Democrats are often called Dixiecrats. Because of this, we include two dichotomous variables that indicate whether a respondent is a self-identified Democrat or a Republican, and we include a scale to measure self-reported ideology that ranges from 1 (extremely liberal) to 7 (extremely conservative).
Sex: On average, survey research has shown that men and women differ on a wide range of political attitudes. Kelleher and Wolak (2007) found that women were typically more confident in state courts then men; however, Cann and Yates (2008) found that women had less support for courts than men. One might theorize that Cann and Yates’s finding that women were less supportive of courts than men could be caused by women’s greater concern with crime and their belief that courts have in the past been too lenient on criminals (Myers 1996). In our study, we include a dichotomous independent variable where women are coded as 1 and men are coded as 0.
Age: Younger citizens tend to be more skeptical of government institutions than older citizens (Kelleher and Wolak 2007). There are a variety of reasons younger people have different attitudes than older individuals. First, younger respondents have had less time to complete their education, suggesting they may have less knowledge of court systems and their performance. Furthermore, younger respondents are less likely to have had experience with the courts. In addition, younger respondents tend to be more concerned with social justice issues (Overby, et al. 2004). We include age as an independent variable in each of the regression models.
Rural County: We include a county-level variable that indicates whether a respondent in our survey lives in a rural county.[3] Huckfeldt argued that “political opinions and behavior of individuals cannot be understood separately from the environment within which they occur” (1987, 1). Glick (2004) suggests that courts in urban areas tend to deal with more serious and controversial cases than courts in rural areas. In addition, rural courts have fewer judges, and there may be a better chance that the public is aware of who judicial candidates are in rural areas. McKenzie, Rugeley, Bailey, and McKee (2017) also found that rural residents tended to know more about local courts and judges. For these reasons, we predict that respondents living in rural areas will tend to view the state court system more favorably.
Statistical Findings: What Variables Explain Public Attitudes toward State Courts?
Table 5 shows the results of two ordered logistic regressions. Model 1 uses the dependent variable that measures a respondent’s “confidence” in the North Carolina courts. The explanatory variables race, knowledge of the courts, experience as a jury member, education, party identification, sex, age, and living in a rural county were not associated with confidence at a statistically significant level. One of the most interesting findings was that race was not associated with confidence in the courts. This was somewhat surprising given that so many studies have found a correlation between race and public opinion toward the courts at both the federal and state levels. However, some scholars have noted that blacks and whites generally have a basic level of diffuse support for the courts’ legitimacy and that differences only emerge when asking more specific court-performance questions (Overby, et al. 2004).
| Independent Variables | Dependent Variable - Model 1 - Confidence in State Courts - Not at all Confident to Very Confident | Dependent Variable - Model 2 - Fair Outcome in Court - Never to Always |
|---|---|---|
| Age | 0.001 (0.004) |
0.006+ (0.004) |
| White | 0.461 (0.416) |
0.965*** (-0.279) |
| Black | -0.046 (0.364) |
0.123 (0.312) |
| Female | -0.120 (0.115) |
-0.279*** (0.107) |
| Ideology (7 point scale) | 0.115*** (0.044) |
0.089* (0.044) |
| Democrat | 0.060 (0.158) |
0.222+ (0.131) |
| Republican | -0.097 (0.119) |
0.132 (0.141) |
| College | 0.166 (0.154) |
0.450*** (0.146) |
| Jury Experience | -0.010 (0.171) |
0.046 (0.117) |
| Defendant or Plaintiff | -0.650*** (0.156) |
-0.492*** (0.145) |
| Knowledge of Courts | 0.131 (0.114) |
-0.019 (0.136) |
| Rural County | -0.054 (0.151) |
-0.167 (0.152) |
| N (# of respondents) | 1011 | 1133 |
| # Countries | 89 | 91 |
| Pseudo R2 | 0.021 | 0.041 |
Table 5. Ordered Logistic Regression
+p<0.10, *p<0.05, **p<0.01, ***p<0.001
Only two independent variables in model 1 were associated with confidence in state courts. A respondent’s ideology was positively associated with the dependent variable. That means that respondents with higher scores in our seven-point scale (more conservative) tended to have more confidence in the courts in North Carolina. This is an interesting finding, since prior studies have found that conservatives tend to be less trusting of the government and especially of the US Supreme Court (Cook and Gronke 2005). Yet conservatives in our sample were more confident in state courts than liberals.
No other study we reviewed found such a finding, for the most part because studies did not typically include ideology as an independent variable when examining public attitudes toward state courts. Our study shows that for North Carolina, ideology is an important variable in understanding support for state courts. Curry and Romano (2018) suggest that ideology and ideological cues help create a connection between the courts and the public and help increase accountability.
Our regression models also include variables measuring prior experience with the courts. Like other studies, such as Benesh and Howell (2001) and Wenzel, Bowler, and Lanoue (2003), our study found that individuals who have experience as a defendant or a plaintiff tended to have less confidence in the courts. Unlike Boyum (1992), who found that jury duty in California was linked to increased levels of support for the courts, we found no relationship between jury duty and confidence in the courts in North Carolina.
Model 2 uses the same independent variables to explain variation in perceptions of fairness in the North Carolina court system. Respondents were asked, “How often do people receive fair outcomes when they deal with the courts? Always, usually, sometimes, seldom, or never?” This dependent variable is not as commonly used by scholars as the “confidence” question. This “fairness” variable measures more specific support for courts. The results for model 2 are different from model 1 and show that whites are more likely to believe the courts usually treat people fairly. Race was not an important factor in explaining general confidence in courts in model 1, but race does matter when looking at a more specific question about court performance. This supports findings from prior research in Mississippi by Overby et al. (2004), which found that race mattered for specific support but not for diffuse support for courts. Conservatives also tended to believe courts produced fair outcomes. Similarly, more-educated respondents were also more likely to believe the courts were fair. Women were more likely to believe that state courts seldom treat people fair; so were people who had been a defendant or a plaintiff in a courtroom.
It is important to know that women, African Americans, and residents with prior experience with the courts were more likely to believe the courts were not always fair. When different groups of residents have different levels of trust in the courts, it calls into question whether courts are serving all interests and individuals in society. Even if these differences in trust are unfounded, such beliefs may diminish the legitimacy of the courts.
| Independent Variable | Dependent Variables - Far Worse (1) to Far Better (5) - Model 3 - Low Income | Dependent Variables - Far Worse (1) to Far Better (5) - Model 4 - African Americans | Dependent Variables - Far Worse (1) to Far Better (5) - Model 5 - Whites | Dependent Variables - Far Worse (1) to Far Better (5) - Model 6 - Hispanics |
|---|---|---|---|---|
| Age | 0.002 (0.003) |
0.002 (0.003) |
-0.001 (0.003) |
0.009* (0.004) |
| White | 0.426 (0.303) |
0.209 (0.315) |
-0.650* (0.295) |
-0.057 (0.329) |
| Black | -0.690+ (0.390) |
-0.744* (0.338) |
0.739** (0.279) |
-0.331 (0.375) |
| Female | -0.065 (0.122) |
-0.137 (0.124) |
-0.154 (0.116) |
-0.299* (0.146) |
| Ideology (7 point scale) | 0.224*** (0.038) |
0.294*** (0.037) |
0.290*** (0.037) |
0.237*** (0.039) |
| Democrat | -0.072 (0.168) |
-0.111 (0.155) |
0.188 (0.153) |
0.006 (0.133) |
| Republican | 0.082 (0.136) |
0.207 (0.133) |
0.003 (0.160) |
0.204 (0.136) |
| College | -0.263** (0.092) |
-0.613*** (0.113) |
0.211+ (0.119) |
0.425*** (0.121) |
| Jury experience | -0.065 (0.114) |
-0.216 (0.161) |
-0.177+ (0.102) |
-0.015 (0.112) |
| Defendant or Plaintiff | -0.421** (0.144) |
-0.216 (0.161) |
-0.267* (0.116) |
-0.138 (0.118) |
| Knowledge of Courts | 0.135 (0.108) |
-0.031 (0.116) |
-0.165 (0.144) |
0.027 (0.133) |
| Live in Rural County | 0.589*** (0.155) |
0.423** (0.140) |
-0.473*** (0.133) |
0.609*** (0.158) |
| N (# of respondents) | 1051 | 1043 | 1049 | 980 |
| # of countries | 91 | 91 | 90 | 87 |
| Pseudo R2 | 0.06 | 0.077 | 0.09 | 0.05 |
Table 6. Ordered Logistic Regression - Court Treatment of Groups
+p<0.10, *p<0.05, **p<0.01, ***p<0.001
Table 6 presents the results of a set of ordered logistic regression models that use dependent variables that measure the beliefs about how state courts treat specific groups. These dependent variables are based on a survey item that asks respondents to evaluate if a particular group receives far better, somewhat better, the same, somewhat worse, or far worse treatment in the state courts. The most consistent finding was how ideology was related to perceptions of court treatment of different groups. Conservatives were more likely to believe the courts treat low-income people, African Americans, and Hispanics better and were more likely to believe that whites were treated worse. This is not necessarily a surprising finding, but it is an important finding because very few studies on state courts use ideology as an independent variable.
Living in a rural county was also consistently associated with the four dependent variables. Like conservative respondents, respondents living in rural counties were more likely to believe the courts treat low-income people, African Americans, and Hispanics better and treat whites worse. This means that even when controlling for a respondent’s race, ideology, partisan identification, and other characteristics (independent variables), we found that individuals living in a rural county tend to evaluate North Carolina courts very differently. These regional and geographic differences are highly relevant in state politics and the state court system. Elected officials, including judges, are elected within certain districts. Differences between rural and urban counties might produce district elections that select very different judges and may produce different outcomes (Fernandez and Bowman 2004). Furthermore, when district lines are redrawn every ten years, officials may attempt to engage in gerrymandering to influence electoral outcomes.
Race was found to be associated with beliefs about group treatment. As we predicted, African American respondents were more likely to believe whites were treated better and that blacks were treated worse. The education level of a respondent was also associated with different perceptions of court treatment of groups. College-educated respondents were more likely to say that low-income people, African Americans, and Hispanics are treated worse by courts. This is perhaps because college-educated individuals are more likely to have learned about racial disparities in the criminal justice system.
People with experience as a defendant in court were also more likely to believe courts treat low-income defendants worse but were also more likely to believe whites were treated worse as well. Not all studies have found that prior experience with the courts matters. For example, Berthelot, McNeal, and Baldwin (2018) found that experience with the courts did not have a statistically significant relationship with attitudes toward state courts. Our study highlights how it is important to differentiate between types of experience, since jury duty is very different from being a defendant or a plaintiff in court.
In table 6, age and sex (being identified as female) were only found to be associated with beliefs about court treatment of Hispanics (see model 6). Older respondents tended to believe Hispanics were treated better, compared to younger respondents. Women tended to feel the opposite, believing that Hispanics are treated worse by the courts in North Carolina. Although modest in size, the Hispanic population in southern states is seeing some of the fastest growth (Fernandez and Dempsey 2017). Race relationships in the South have generally focused on white-and-black dynamics. Future research in southern state politics will need to examine public attitudes toward the growing Hispanic population (Peralta and Larkin 2011).
As noted earlier, most surveys ask questions that provide respondents with an ordered set of choices for a response: strongly agree, agree, and so on. This type of ordinal measure requires special regression models for analysis, but the coefficients produced by ordered logistic regression are not easily interpreted outside of looking at statistical significance and the sign, which indicate whether the independent variable is positively or negatively related to the dependent variable. To better understand the relationship between the independent variables and the dependent variable (public attitudes toward the state courts), researchers often compute the probabilities of observing a specific value of the dependent variables (e.g., strongly disagree) given a set of values for the independent variables.
For example, using the logistic regression coefficients in model 4 in table 6, we can calculate the probability that a person says courts treat blacks far worse given that the respondent is a male who considers himself neither black nor white but some other race, is fifty-three years of age (the average in the sample), has not graduated college, is moderate in ideology (value 4), is neither a Democrat nor a Republican (e.g., Independent), has never served on a jury or been a plaintiff or defendant in court, and lives in a suburban or urban county. The probability of answering “far worse” for the hypothetical respondent is 0.13, or 13 percent. This is presented in table 7 under the “Overall Probability.” We can then change one of the values of an independent variable (e.g., being black) and recalculate the probabilities of giving the same answer (blacks are treated far worse). Table 7 presents these calculated probabilities along with predicted probabilities when making the hypothetical respondent above white, then a rural resident, then a college-educated individual, and then extremely conservative. These probabilities tell us that being black increases the probability of answering “far worse” by about 0.10, and graduating college increases the probability by 0.08, and moving from a moderate ideology to an extremely conservative ideology decreases the probability by about −0.07.
| Variable | Change in Value | Far Worse | Somewhat Worse | The Same | Somewhat Better | Far Better |
|---|---|---|---|---|---|---|
| Overall Probabilities | - | 0.130 | 0.344 | 0.391 | 0.117 | 0.019 |
Table 7a. Change in Probabilities Given a Change in Value for a Specific Independent Variable
| Black | 0 to 1 | .102 | .074 | -.110 | -.057 | .010 |
| White | 0 to 1 | -.025 | -.028 | .030 | .019 | .004 |
| Rural | 0 to 1 | -.040 | -.061 | .043 | .048 | .010 |
| College | 0 to 1 | -.071 | -.128 | 060 | .113 | .026 |
Table 7b. Marginal Effects on the Probabilities of Beliefs about Court Treatment of Blacks (using Coefficients in Model 4 in Table 6)
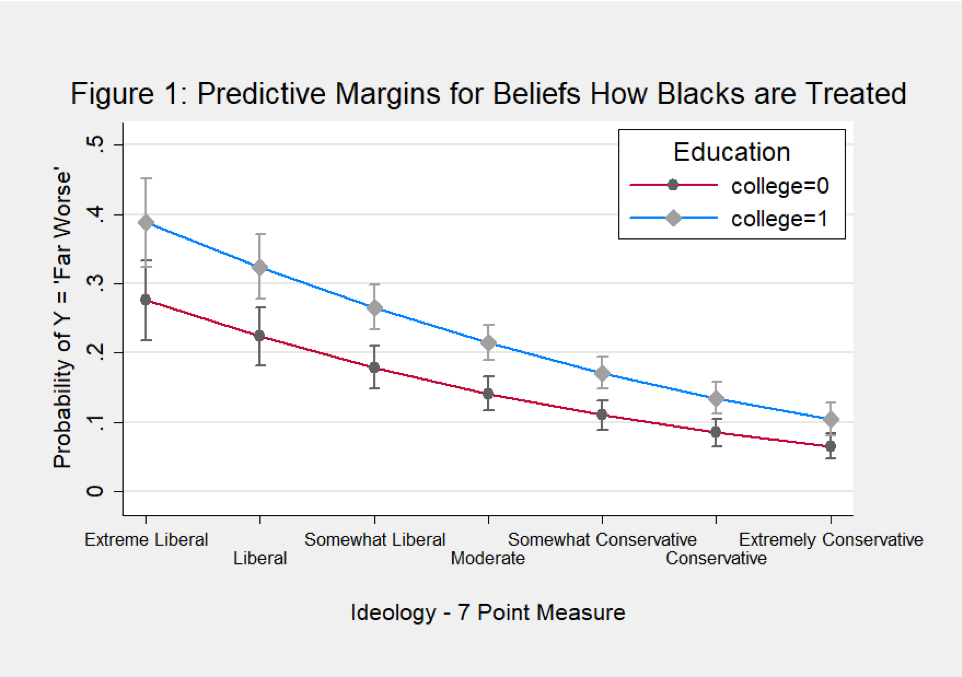
In addition, we can plot the change in the predicted probabilities for all the values in the ideology measure ranging from 1 (extremely liberal) to 7 (extremely conservative) to visualize how this important variable is related to public attitudes toward the courts. Figure 1 shows how ideology influences the probability of answering that African Americans are treated worse by the state courts. The figure presents results for both college-educated and non-college-educated respondents. Ideology is clearly related to beliefs of how state courts treat blacks. Liberal respondents are more likely to say blacks are treated worse. Furthermore, we can see how a college education also influences attitudes; however, the differences between college-educated and non-college-educated respondents are less visible once a respondent is extremely conservative. Extremely conservative respondents tend to have similar perceptions of how blacks are treated whether they have a college degree or not.
Discussion
According to Olson and Huth (1998), public opinion regarding state courts has been of low interest to most pollsters. That is unfortunate given the influence courts have on the lives of citizens. Public opinion research is valued because surveys help promote democracy and accountability by providing “systematic information on the preferences of the citizenry” (Asher 2012, 26).
The earliest survey that asked about state courts was conducted in the 1970s and found that the public was not very satisfied with the courts (Rottman 2015). Similarly, many legal experts in the 1960s saw state courts as slow and inefficient and saw many state court judges as unqualified (Hall 1999). But starting in the 1970s, state and local courts became consolidated, better funded, and better managed. Hall argues that most state courts have been transformed into “highly professionalized institutions” (1999, 114).
This study finds that the public is not unsatisfied with the state courts in North Carolina and that the public sees state courts in a more positive light than the media, the federal government in general, the US Supreme Court, and even local public schools. These findings do not seem to support arguments that “a crisis of public confidence in the American judicial system is at hand” (Selya 1996, 909). Having said that, the findings do show that the public believes the courts do not always treat people fairly. Although most respondents, regardless of background, have a general level of confidence in state courts, respondents are also keenly aware that not all groups are treated fairly by the courts. The contradiction in having confidence in political institutions but also understanding that these political institutions are influenced by politics and other external forces is perhaps a reflection of the pragmatic approach many citizens have to our democratic system. There is broad support for our political institutions even though we know they are imperfect.
These contradictions and the complexity of public attitudes toward the legal system can only be fleshed out when several different types of questions are used to measure the public’s perceptions of political institutions. Many studies have found that voters tend not to have much confidence in Congress, but they typically have favorable opinions of their representatives in Congress. Dougherty, Lindquist, and Bradbury (2006) found that different independent variables were associated with different measures of support for courts in Georgia. A measure that simply asks respondents about confidence in the courts might only measure the public’s overall respect and deference to the legal system. General questions of confidence do not capture the real differences in opinions that some groups have about the actions and behaviors of state courts. For example, Overby et al. (2004) found that blacks and whites in Mississippi had similar assessments of state courts when asked about diffuse support for the courts.
However, the similarities between blacks and whites disappear when specific questions are asked about how courts actually work and perform. In our survey, white and black respondents were very similar when it comes to confidence in state courts in North Carolina but were very different when asked about fair treatment by the courts. Therefore, it is not surprising that we found very different results when we examined attitudes toward confidence in the courts, fairness of the courts, and how courts treat different groups. Specific question wording in a survey item captures how respondents evaluate state courts in different ways. Understanding how different groups view the fairness of the legal system is critical in helping keep the courts accountable to all its citizens and ensuring that court rulings are seen as legitimate by all groups.
No single study can capture all the factors that influence a person’s opinion about a court system. In our study, we found that ideology was one of the most consistent predictors of attitudes toward the court. This is not surprising given that political science often defines ideology as a set of core beliefs and principles about how politics and government should work (Knight 2006). It is surprising how few studies include ideology in the statistical models used to examine opinions on state courts. Our review of prior studies also found that few studies examine how a person’s environment may influence his or her beliefs about courts. We found that individuals living in rural counties have different perceptions of the courts. Even when controlling for ideology, rural residents are more likely to believe that people of low income, blacks, and Hispanics are treated better in the courts and whites are treated worse. This finding highlights the importance of where people live in understanding public opinion. As Lyndon Johnson once said, “Tell me where a man comes from, how long he went to school, and where he worships on Sundays, and I’ll tell you his political opinions” (Morone and Kersh 2019, 206). Other environmental variables can be included in future research, including county crime rates, median income of a county, or the percent of a county population that is African American or Latino.
As noted, there is plenty of room for more research on state courts. The prominence and influence of state courts is expanding. Individuals living in the United States are governed and protected by a system of dual constitutionalism. Their rights are protected by both the US Constitution and the constitution of the state in which they reside. Recent decades have seen a new judicial federalism where state courts are increasingly using state laws and state constitutions to determine the degree to which individual rights and liberties are protected—and even to secure rights not articulated by the US Constitution (Tarr 1996).
Furthermore, state courts have seen important changes in their organization and how judges are selected. Just in North Carolina in the past ten years, the selection of judges has changed from partisan, to nonpartisan, and then back to partisan elections. What kind of effect has this had on public perceptions of the state courts? Around the country, more women and minorities have been elected or appointed to judicial positions in state courts. How has this diversity in the court system influenced public perceptions?
How the public perceives the courts is an important field of study given the growing caseload state courts manage. As Kelleher and Wolak argue, “trust and confidence in government is consequential. People are more likely to comply with laws when they have confidence in government” (2007, 707). Public confidence is perhaps even more important for the courts because they often lack enforcement powers. As Alexander Hamilton wrote in Federalist 78 in reference to the federal judiciary, the courts have “no influence over either the sword or the purse. . . . It may truly be said to have neither FORCE nor WILL, but merely judgment.” This applies to state courts as well, who often rely on their perceived legitimacy in hopes that other branches of government and the public abide by their rulings.
Appendix: Survey Question Wording
Introductory statement. Now I would like to ask you some questions about the North Carolina court system. This system includes the state supreme court, court of appeals, superior courts, and district courts.
Confidence in institutions. First, I’d like to know how much confidence you have in the following public institutions using the scale of very confident, somewhat confident, not very confident, or not at all confident. In general, how would you rate your confidence in the following (institutions rotated randomly): your local public schools, your local police or sheriff, the media, the US Supreme Court, the federal government in Washington, the North Carolina state courts?
Fairness of courts. How often do people receive fair outcomes when they deal with the courts? Always, usually, sometimes, seldom, or never?
Knowledge of courts. How much would you say you know about the courts in North Carolina? A lot, some, a little, or nothing at all?
Experience with courts. I’d like to ask you some questions about your personal experiences with the North Carolina state court system (jury question is first; defendant/plaintiff and testify rotated randomly): Have you ever served on a jury? Have you ever been a defendant or a plaintiff in a court case? Have you ever testified as a witness in a court proceeding?
Treatment of different groups. I would like to read you a short list of groups of people. For each, please tell me if you think the group receives far better, somewhat better, the same, somewhat worse, or far worse treatment in the state courts (groups rotated randomly): low-income people, middle-class/working-class people, wealthy people, people who have no lawyer representing them, non-English-speaking people, white people, African Americans, Hispanics.
Political influence on courts. Do you strongly agree, agree, disagree, or strongly disagree with the following statements (statements rotated randomly): North Carolina courts are free from political influences, judges’ decisions are influenced by political parties, and judges’ decisions are influenced by the fact they must run for election.
Demographic Questions
- Race. For statistical purposes only, could you please tell me your race or ethnic background?
- Party ID. Generally speaking, do you usually think of yourself as a Democrat, Republican, Independent, or something else?
- Ideology. When it comes to politics, do you usually think of yourself as liberal, moderate, conservative, or haven’t you thought much about this?
- Education. How much school have you completed?
- Age. Do you mind if I ask how old you are (continuous variable recoded for presentation)?
- Gender. Was the respondent male or female (determined by the interviewer)?
The full list of survey items and their results and cross tabulations can be found at https://www.elon.edu/u/elon-poll/wp-content/uploads/sites/819/2019/02/111915_ElonPoll_CourtsReport.pdf
References
Asher, Herbert. 2012. Polling and the Public. What Every Citizen Should Know. 8th edition. Washington D.C., CQ Press. (↵ Return)
Berkson, Larry C. 1980. “Judicial Selection in the United States: A Special Report.” Judicature 64: 176–193. Updated by Rachel Caufield and Malia Reddick (2010). (↵ Return)
Berlin, Michael M. 2013. “Courts.” In Encyclopedia of Street Crime in America, ed. Jeffrey Ross, 92–96. Los Angeles: Sage Publications. (↵ Return)
Benesh, Sara C. 2006. “Understanding Public Confidence in American Courts.” Journal of Politics 68 (3): 697–707. (↵ Return 1) (↵ Return 2)
Benesh, Sara C., and Susan E. Howell. 2001. “Confidence in the Courts: A Comparison of Users and Non‐Users.” Behavioral Sciences & the Law 19 (2): 199–214. (↵ Return 1) (↵ Return 2)
Berthelot, Emily R., Brittani A. McNeal, and Julie Marie Baldwin. 2018. “Relationships between Agency-Specific Contact, Victimization Type, and Trust and Confidence in the Police and Courts.” American Journal of Criminal Justice 43(4): 768–791. (↵ Return 1) (↵ Return 2) (↵ Return 3)
Bonica, Adam, and Maya Sen. 2017. “The Politics of Selecting the Bench from the Bar: The Legal Profession and Partisan Incentives to Introduce Ideology into Judicial Selection.” The Journal of Law and Economics 60 (4): 559–595. (↵ Return)
Boyum, Keith O. 1992. “What Is Known About General Citizen Attitudes and Knowledge About the Courts.” Report to the Judicial Council of California. San Francisco: Administrative Office of the Courts of California. (↵ Return 1) (↵ Return 2)
Brennan, William J. 1966. “State Supreme Court Judges versus United States Supreme Court Justice: A Change in Function and Perspective.” University of Florida Law Review 29: 225–237. (↵ Return)
Buckler, Kevin, Francis T. Cullen, and James D. Unnever. 2007. “Citizen Assessment of Local Criminal Courts: Does Fairness Matter?” Journal of Criminal Justice 35(5): 524–536. (↵ Return 1) (↵ Return 2)
Caldeira, Gregory A. 1991. “Courts and Public Opinion,” in The American Courts: A Critical Assessment, eds. John Gates and Charles Johnson, 303–334. Washington, DC: Congressional Quarterly. (↵ Return)
Caldeira, Gregory A., and James L. Gibson. 1992. “The Etiology of Public Support for the Supreme Court.” American Journal of Political Science, 36(3): 635–664. (↵ Return 1) (↵ Return 2) (↵ Return 3)
Cann, Damon M., and Jeff Yates. 2008. “Homegrown Institutional Legitimacy: Assessing Citizens’ Diffuse Support for State Courts.” American Politics Research 36 (2): 297–329. (↵ Return 1) (↵ Return 2) (↵ Return 3)
Christensen, Rob. 2008. The Paradox of Tar Heel Politics; the Personalities, Elections, and Events That Shaped Modern North Carolina. Chapel Hill: University of North Carolina Press. (↵ Return)
Cole, George F., and Christopher E. Smith. 1998. The American System of Criminal Justice. Belmont, CA: Wadsworth. (↵ Return 1) (↵ Return 2)
Cook, Timothy E., and Paul Gronke. 2005. “The Skeptical American: Revisiting the Meanings of Trust in Government and Confidence in Institutions.” Journal of Politics 67 (3): 784–803. (↵ Return)
Curry, Todd A., and Michael K. Romano. 2018. “Ideological Congruity on State Supreme Courts.” Justice System Journal 39 (2): 139–154. (↵ Return 1) (↵ Return 2) (↵ Return 3)
Dolbeare, Kenneth M. 1976. Trial Courts in Urban Politics: State Court Policy Impact and Functions in a Local Political System. New York: John Wiley & Sons. (↵ Return)
Dougherty, George W., Stefanie A. Lindquist, and Mark D. Bradbury. 2006. “Evaluating Performance in State Judicial Institutions: Trust and Confidence in the Georgia Judiciary.” State and Local Government Review 38 (3): 176–190. (↵ Return 1) (↵ Return 2) (↵ Return 3)
Fernandez, Kenneth E., and Timothy Bowman. 2004. “Race, Political Institutions, and Criminal Justice: An Examination of the Sentencing of Latino Offenders.” Columbia Human Rights Law Review 36 (1): 41–70. (↵ Return 1) (↵ Return 2)
Fernandez, Kenneth E., and Matthew C. Dempsey. 2017. “The Local Political Context of Latino Partisanship.” Journal of Race, Ethnicity and Politics 2 (2): 201–232. (↵ Return)
Gibson, James L. 2008. “Campaigning for the Bench: The Corrosive Effects of Campaign Speech.” Law & Society Review 42 (4): 899–928. (↵ Return 1) (↵ Return 2)
Gibson, James L., Gregory A. Caldeira, and Lester Kenyatta Spence. 2003. “The Supreme Court and the US Presidential Election of 2000: Wounds, Self-Inflicted or Otherwise?” British Journal of Political Science 33 (4): 535–556. (↵ Return)
Glick, Henry R. 2004. “Courts: Politics and the Judicial Process.” In Politics in the American States: A Comparative Analysis, 8th edition, eds. Virginia Gray and Russel Hanson, 232–260. Washington, DC: CQ Press. (↵ Return 1) (↵ Return 2)
Hall, Melinda G. 1999. “State Judicial Politics: Rules, Structures, and the Political Game.” In American State and Local Politics: Directions for the 21st Century, eds. Ronald Weber and Paul Brace, 114–138. New York: Chatham House. (↵ Return 1) (↵ Return 2) (↵ Return 3)
Harris, David A. 1993. “The Appearance of Justice: Court TV, Conventional Television, and Public Understanding of the Criminal Justice System.” Arizona Law Review 35 (4): 785-837. (↵ Return)
Huckfeldt, R., & Sprague, J. (1987). Networks in Context: The Social Flow of Political Information. The American Political Science Review, 81(4), 1197-1216. doi:10.2307/1962585 (↵ Return)
Husser, Jason A., and Kenneth Fernandez. 2016. “Gay Marriage Tends to be More Popular than Same-Sex Marriage.” Survey Practice 9 (3): 1–8. (↵ Return)
Johnston, Christopher D., and Brandon L. Bartels. 2010. “Sensationalism and Sobriety: Differential Media Exposure and Attitudes toward American Courts.” Public Opinion Quarterly 74 (2): 260–285. (↵ Return)
Kastellec, Jonathan P. 2018. “How Courts Structure State-Level Representation.” State Politics & Policy Quarterly 18 (1): 27–60. (↵ Return)
Kelleher, Christine A., and Jennifer Wolak. 2007. “Explaining Public Confidence in the Branches of State Government.” Political Research Quarterly 60 (4): 707–721. (↵ Return 1) (↵ Return 2) (↵ Return 3)
Knight, Kathleen. 2006. “Transformations of the Concept of Ideology in the Twentieth Century.” American Political Science Review 100 (4): 619–626. (↵ Return)
Kritzer, Herbert M., and John Voelker. 1998. “Familiarity Breeds Respect-How Wisconsin Citizens View Their Courts.” Judicature 82: 59–64. (↵ Return)
McCall, Leslie, and Lane Kenworthy. 2009. “Americans’ Social Policy Preferences in the Era of Rising Inequality.” Perspectives on Politics 7 (3): 459–484. (↵ Return)
McKenzie, Mark J., Cynthia R. Rugeley, Daniel B. Bailey, and Seth C. McKee. 2017. “Americans’ Knowledge of Their Local Judges.” Political Behavior 39 (2): 259–277. (↵ Return)
Myers, Laura B. 1996. “Bringing the Offender to Heel: Views on the Criminal Courts.” In Americans View Crime and Justice: A National Public Opinion Survey, eds. Timothy Flanagan and Dennis Longmire, 46–61. Thousand Oaks, CA: Sage Publications. (↵ Return)
Morone, James A., and Rogan Kersh. 2019. By the People: Debating American Government, 4th edition. New York, NY: Oxford University Press. (↵ Return)
National Center for State Courts. 2016. “National Overview” Court Statistics Project. http://www.courtstatistics.org/NCSC-Analysis/National-Overview.aspx (↵ Return)
National Center for State Courts. 2018. Annual Report. Williamsburg, VA: National Center for State Courts. http://www.ncsc.org (↵ Return)
Nicholson-Crotty, Sean, and Kenneth J. Meier. 2002. “Size doesn’t matter: In defense of single-state studies.” State Politics & Policy Quarterly 2 (4): 411–422. (↵ Return)
O’Donnell, Guillermo A. 2004. “Why the Rule of Law Matters.” Journal of Democracy 15 (4): 32–46. (↵ Return 1) (↵ Return 2)
Olson, Susan M., and David A. Huth. 1998. “Explaining Public Attitudes toward Local Courts.” The Justice System Journal 20 (1): 41–61. (↵ Return 1) (↵ Return 2) (↵ Return 3) (↵ Return 4) (↵ Return 5) (↵ Return 6) (↵ Return 7)
Overby, L. Marvin, Robert D. Brown, John M. Bruce, Charles E. Smith Jr, and John W. Winkle III. 2004. “Justice in Black and White: Race, Perceptions of Fairness, and Diffuse Support for the Judicial System in a Southern State.” Justice System Journal 25 (2): 159–182. (↵ Return 1) (↵ Return 2) (↵ Return 3) (↵ Return 4) (↵ Return 5)
Overby, L. Marvin, Robert Brown, John Bruce, Charles Smith, & John Winkle III. (2005). Race, Political Empowerment, and Minority Perceptions of Judicial Fairness. Social Science Quarterly, 86(2), 444-462. Retrieved February 6, 2020, from www.jstor.org/stable/42956073 (↵ Return)
Peralta, J. Salvador, and George R. Larkin. 2011. “Counting Those Who Count: The Impact of Latino Population Growth on Redistricting in Southern States.” PS: Political Science and Politics 44 (3): 552–61. (↵ Return)
Rottman, David, B. 2015. “Who Trusts the Trial Courts, To What Extent, and Why?” In Motivating Cooperation and Compliance with Authority, eds. Brian Bornstein and Alan Tomkins, 117–144. Cham, Switzerland: Springer. (↵ Return 1) (↵ Return 2) (↵ Return 3) (↵ Return 4)
Selya, Bruce M. 1996. “The Confidence Game: Public Perceptions of the Judiciary.” New England Law Review 30: 909–918. (↵ Return 1) (↵ Return 2)
Silbey, Susan S. 1981. “Making Sense of the Lower Courts.” Justice System Journal 6 (1): 13–27. (↵ Return 1) (↵ Return 2)
Tarr, G. Alan. 1996. “New Judicial Federalism in Perspective.” Notre Dame Law Review 72 (4): 1097–1118. (↵ Return)
Troutman, Brian P. 2007. “Party Over-The Politics of North Carolina’s Nonpartisan Judicial Elections.” North Carolina Law Review 86 (6): 1762–1795. (↵ Return)
Tyler, Tom R. and Edgar Allen Lind (1988). Critical issues in social justice. The social psychology of procedural justice. Plenum Press. (↵ Return)
United States Courts. 2016. “Judicial Business.” https://www.uscourts.gov/statistics-reports/judicial-business-2016 (↵ Return)
Vercellotti, Timothy. 2008. “How Southern is the Old North State?: Public Opinion in North Carolina.” The New Politics of North Carolina, eds. Christopher Cooper and H. Gibbs Knotts, 38–60. Chapel Hill: University of North Carolina Press. (↵ Return)
Walker, Darlene. 1977. “Citizen Contact and Legal System Support.” Social Science Quarterly 58 (1): 3–14. (↵ Return 1) (↵ Return 2)
Walker, Darlene, Richard J. Richardson, Thomas Denyer, and Oliver Williams. 1972. “Contact and Support: An Empirical Assessment of Public Attitudes toward the Police and the Courts.” North Carolina Law Review 51 (1): 43–79. (↵ Return)
Wenzel, James P., Shaun Bowler, and David J. Lanoue. 2003. “The Sources of Public Confidence in State Courts: Experience and Institutions.” American Politics Research 31 (2): 191–211. (↵ Return 1) (↵ Return 2) (↵ Return 3) (↵ Return 4)
Yates, Jeff. 2009. “On the Future of State Courts Research.” Justice System Journal 30 (3): 302-306. (↵ Return)
Class Activities
Activity 1
Research how the judges for the state supreme court in your state are selected. Describe how these judges are selected. Are they elected through a nonpartisan election, are they appointed by the governor, or are they selected through another method? How long is a state supreme court judge’s term (e.g., four years)? Are there limits on the number of terms they can serve?
Regardless of how your state selects judges, which method do you think is best in choosing judges for state courts? Should the executive (e.g., the governor of a state) appoint state judges? Should an appointed panel of lawyers and nonlawyers make judicial recommendations? Should voters choose who is best to serve as a state judge? If a state elects its judges, should those elections be partisan (a candidate’s political party affiliations listed on the ballot) or should they be nonpartisan (no party affiliations listed on the ballot)? Explain your answer.
Activity 2
Using the internet, find a recent survey that asked respondents about their feelings or opinions about courts. Provide the following information:
- What is the name of the organization that conducted or sponsored the survey?
- When was the survey conducted (provide specific date range surveys were collected)?
- What geographic area did the survey cover (e.g., the entire United States, a single state such as California)?
- What was the sample size of the survey (how many people did they reach)?
- What was one of the questions they asked about courts?
- What do you think was the most interesting finding from the survey?
- In Maine and Massachusetts, the court of last resort is referred to as the supreme judicial court, and in Maryland it is called the court of appeals. ↵
- The purpose of most survey research is to obtain a sample that is representative of the true population. However, adjustments may be needed because of sampling error or response bias (e.g., younger residents are less likely to answer political polls). To correct for biases, the sample is often weighted so that it matches known demographic information about the population (often obtained from the US Census). ↵
- When including a county-level measure (rather than an individual-level measure, such as race or education), the assumption is that respondents within a county are more similar to one another than they are to individuals in a different county. For example, in this study we believe that rural county residents are more like each other than they are to people living in urban or suburban counties. In statistical terms, this means that there are correlations between observations within counties (clusters), and this can create estimation problems when conducting a regression analysis. This can be corrected by making adjustments when estimating the standard errors of the regression coefficients. Many statistical software packages allow for estimating cluster-robust standard errors to adjust for clustering. All of the regression models in the next section are estimated using this technique. ↵
