Court Procedures
21 Time Served
Barriers to Reentry after Incarceration
Scott Hofer
Introduction
In politics and pop culture, Americans view the criminal justice system as the place that deals with the “bad guys” and punishes them for their crimes against society. Despite many policy discussions and documentaries ending with convictions of criminals, the process of punishment and incarceration continues well after the sentencing. Those convicted of crimes are often an afterthought at best or a group deserving of additional hardship and punishment at worst. There is a fairly extensive literature highlighting the popularity of “tough on crime” legislation and attitudes among the general public that (at least historically) seek to further punish those who have been convicted of crimes (Kuehn and Vosgerau 2022). Perhaps the most visceral illustrations of this tendency among the public can be illustrated by the prevalence of jokes about sexual assault occurring in prisons (Buchanan 2010; Minogue 2011). A society so comfortable with the idea of prisoners being assaulted in such a heinous way is a clear illustration of their disadvantage in the public sphere. It offers a glimpse into the minds of the voting public as they determine which policies they will endorse and politicians gauge which policies to pursue. Still, there is a need to understand the aftermath of the often brutal and inhumane system of incarceration in the United States and the practical matter of transitioning prisoners into life on the outside.
In this chapter, I review the obstacles to reentry into society with a focus on the relationship between policies, restrictions, and programs focused on reentry and the rate of recidivism in the United States. First, I focus on a qualitative description of obstacles to reentry and the scope of restrictions on convicted felons in particular. Utilizing this information, I then analyze the relationship between the degree of punitive restrictions on felons, policies meant to ease transitions back into society, and the rates of recidivism in the United States. Finally, I construct an index to measure the degree of reentry friendliness of each locality in the United States and then compare localities based on their reentry policies. Overall, this chapter adds to the existing literature by providing a basic quantitative and qualitative overview of differing programs meant to help justice-involved individuals navigate life after their interaction with the legal system.
Research Questions
Understanding that the incarcerated population in the United States, by nature of their convictions, are among the most vulnerable and stigmatized populations in the country, I seek to answer the following questions:
- What policies are currently in place regarding restrictions on the formerly incarcerated? How do policies related to the formerly incarcerated help or harm their reentry process?
- How do states compare in terms of their friendliness to reentry through public policy? What are some proactive reentry programs that aid the reentry process? How does state-level policy meant to help the formerly incarcerated correspond with recidivism rates?
Literature Review
In order to fully understand the dynamics surrounding reentry into society, it is important to consider some background of incarceration and its aftermath. The American legal system operates within an imperfect society and reflects its norms and values. Choices about what ought to be criminal and practical differences in resources, enforcement, and socioeconomic factors have led to a system with huge disparities. Additionally, there is a strong social stigma related to being convicted of a crime, particularly a felony, with many Americans believing convicted felons to be irredeemably immoral (Kuehn and Vosgerau 2022). Within this context, the formerly incarcerated enter back into a society that is still unequal and now do so with an additional stigma.
Cycles of Inequality and Interaction with the Legal System
No discussion of the American prison-industrial complex can begin without a basic understanding of the inequality within and as a result of the justice system. Extensive work has been done to prove what is largely believed by the general public—racial minorities make up a disproportionate number of prisoners in the United States (Carson and Golinelli 2013; Percival 2010). This disproportionate number of prisoners contrasts with academic findings that largely illustrate racial groups to be equally likely to violate the law (Russell 1998; Gilliam et al. 1996; Kennedy 2012). The problem for academic study is the multifaceted, diverse, and increasingly political conceptions of the American justice system. While there is a general consensus that the incarceration rates in the United States are a result of racial discrimination, privilege, or socioeconomic disparities, this is hard to clearly illustrate among a diverse range of systems and street-level bureaucrats. The disparate likelihood of people of color and the poor ending up incarcerated is the result of many causal forces, including a higher likelihood of being questioned by police, a higher likelihood of being searched, a higher likelihood that charges will be filed, and a higher likelihood to receive longer sentences (Alexander 2012; Brunson 2007). The inequality within the justice system has also been linked to inequality outside of the prison walls. Inequality in terms of wages (Geller, Garfinkel, and Western 2006; Western and Sirois 2017), rates of marriage (Western, Lopoo, and McLanahan 2004), infant mortality (Wildeman 2009; Wakefield and Wildeman 2011), and asthma prevalence (Wang and Green 2010) have all been illustrated through large-scale empirical works.
The multifaceted issues that lead to inequality in incarceration persist even after a prisoner has served their time. Those who become justice-involved tend to be from socioeconomic backgrounds without as much opportunity as the general public and tend to receive longer punishments during sentencing (Van Eijk 2017). After lockup, these limited opportunities are reduced even further, which can frequently lead to recidivism (Wehrman 2011; Reisig et al. 2007; Hirsch, Dierkhising, and Herz 2018). As the formerly incarcerated struggle to meet their basic needs in terms of housing, employment, and food, illegal means of providing for themselves become more and more appealing (Augustine 2019; Valera et al. 2017). Many interviews with repeat offenders offer a qualitative description of this phenomenon: “This felony is—it’s over the top of your head, right, not having an established credit long enough, so I’m not able to go and purchase a house or get the assistance I need. It is just always a burden. They are letting you know that you made a mistake, and, for this mistake, that these burdens are going to be placed in front of you” (Nawaz and Carlson 2022). With all of these factors working against those exiting prisons and joining society, it is no wonder why the United States has a very high rate of recidivism compared to peer countries (Gendreau et al. 2000; Jones 2021). An academic analysis of recidivism largely confirms the more qualitative accounts mentioned above. In the United States, 82% of released prisoners can be expected to be back in the legal system within a 10-year period; although 10 years is a large period of time, 43% of formerly incarcerated people are arrested during their first year of release (Antenangeli and Durose 2021). There are a large number of reasons for this high recidivism rate. They include personal/individual reasons, such as consistent issues with aggressive behavior, but also larger issues within society, including the difficulty of finding employment and housing while branded as a felon (Weiman 2007; Roman 2004; Katsiyannis et al. 2018).
Stigma, Deservingness, and the Political Push for Punitive Policy
The inequality in American society, which translates into inequality in incarceration, extends to post-incarceration life as well. As social science research has indicated, perceptions of the targets of public policy tend to play an important role in whether or not they will be treated generously or punitively (Oorschot 2000). When it comes to the recipients of government actions, those who have been incarcerated are unlikely to be considered “deserving” of generous social policies. The process of societal legitimation of policy is unlikely to create solidarity with the general public as the path into the legal system is perceived to be made by choice; additionally, despite disadvantages, many post-incarceration individuals are healthy and able-bodied, garnering less public sympathy (Oorschot 2000). The policy positions in the United States illustrate the validity of this assessment. After incarceration, despite their debt to society being paid, the formerly incarcerated are still subject to harsh judgment from society and are a politically stigmatized group (Wilson et al. 2015). As a result, many states have strict prohibitions and regulations on felons that usually extend well beyond their prison term despite very modest amounts of support for many of these restrictions from the general public (Johnston and Wozniak 2021). Although many of the policies have been shown to be counterproductive, harm caused to felons generates little sympathy from society at large, and risk-averse politicians tend to avoid bold reentry reforms that may create a backlash with only modest political upside (Johnston and Wozniak 2021). There are over 40,000 restrictions placed on the formerly incarcerated in the United States, most of them imposed at the state level as a result of state-level criminal infractions and the significantly larger body of state criminal law relative to federal (Alexander 2020; Uggen and Manza 2002; McElhattan 2022). These restrictions include prohibition from working in various industries depending on the state, prohibitions from working certain jobs entirely, limits on their ability to be alone with minors, disenfranchisement, and numerous other examples. Although some restrictions on felons based on their crime and the nature of the restriction may make sense, many times, restrictions on felons are overly broad and do not take into account the severity of the crime or the circumstances at play (Wheelock 2005).
While the formal prohibitions placed on people labeled as felons are severe, the informal and self-imposed restrictions can often be just as burdensome. For example, many with a felony conviction will stop filling out applications for jobs, schools, or housing if there is a requirement to list the details of their conviction (Vuolo, Schneider, and LaPlant 2022). This is a form of self-selection imposed due to a sense of defeat based on the assumption that their record will be disqualifying. And this self-limiting makes sense given the patterns illustrated by social scientists. Employers looking at a crowded group of applicants frequently discard anyone with a criminal record (Agan and Starr 2018; Holzer, Raphael, and Stoll 2006); despite changing views in society, the stigma placed on those who have served time has already created an environment detrimental to the goal of smooth reentry. This societal stigma has led to punitive policies, a lack of political concern, and, many times, increased recidivism despite lacking popular support today. Ultimately, moods on felon restrictions are changing toward a less punitive view, but many barriers erected during the “tough on crime” era still remain (Johnston and Wozniak 2021).
Philosophically, consideration of the purpose of incarceration and whether punishment should be lifelong is an important starting point regarding reentry programs and barriers to successful reentry. It is important to note that extended use of incarceration is a relatively recent phenomenon and that the reliance on incarceration as a form of punishment has problematic connections with the Jim Crow system (Wacquant 2017). Americans remain divided on whether incarceration is used too much (28%), too little (32%), or about the right amount of time (37%) (Gramlich 2021). However, in terms of crime and punishment, time served should complete one’s debt to society, or else the necessary punishment should be given at the time of sentencing. Obviously, some exceptions to the idea of a clean slate after incarceration might be prudent, but lifelong restrictions on things like political participation (voting), public assistance, housing, or employment go well beyond the terms of incarceration into a form of lifelong punishment.
Policy Responses and Post-incarceration Life
To assess the obstacles in place for reentry, it is first essential to explore the different policies that target convicted felons or those who have been incarcerated. During past eras, when fear of crime and a “tough on crime” approach had bipartisan support, many policy restrictions were put in place, and most of them remain in place (Johnston and Wozniak 2021). These provisions limited those convicted of felonies from things like public assistance and welfare programs, political participation, and employment in certain industries. In addition to formal restrictions, housing, employment, and education applications began to see an uptick in questions about criminal history as well as criminal background checks. Most of these policies vary considerably at the state and local levels, with politicians pursuing policies that they believe will help them maintain their electoral support.
Political Participation
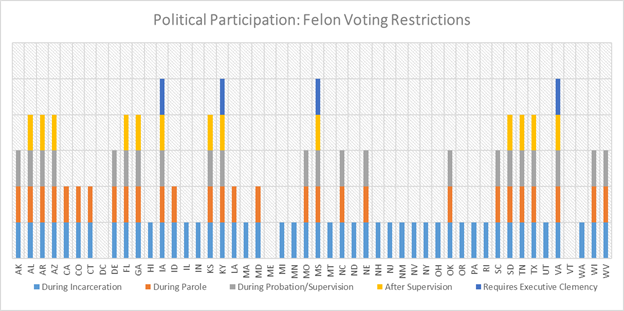
One of the most studied restrictions on felons is the restriction on political participation—in particular, voting. Most States in the United States ban those actively incarcerated from taking part in the electoral system through the vote, only two states (Maine and Vermont) and Washington, DC, allow voting from prison. Beyond the common restriction on voting while serving time, other states limit the ability of convicted felons to vote while on parole or probation. As you can see in figure 1[1], there is considerable variation across the states in regard to these restrictions, with higher bars on the graph illustrating greater barriers to political participation (labeled below). Felon voting restrictions after incarceration are very common, with 29 states limiting the right to vote while on parole and 23 doing so until the end of probation/supervision. Additionally, 14 states have additional requirements for voting rights restoration that extend even after supervision has been completed, and 4 states require executive clemency for the restoration of voting rights. These differences dramatically shape the power of post-incarceration felons to voice their political opinions and take part in democratic processes as full citizens.
Beyond restrictions on voting, political participation is constrained in terms of basic service to democratic governance in the form of holding public office. These laws also vary considerably but fall along restrictiveness lines similar to those placed on voting. States that deny the right to vote for anyone with a felony record, even after time served, generally do not allow those with a felony conviction to run for public office. Given the extremely specific and nuanced nature of these restrictions, they are not easy to categorize but do serve as an obstacle to full reentry into society. In a democratic country, the ability to take part in collective decision making through politics is a basic part of being a full citizen.
Public Assistance
The restrictions placed on those reentering society after incarceration are not limited to political participation. In fact, restrictions for those convicted of felonies extend to public assistance programs (commonly known as welfare) that determine whether or not a needy individual is entitled to government benefits. Those released from prison tend to be in dire financial straits, as they tend to be unemployed and are statistically likely to be living in poverty (Harding, Morenoff, and Herbert 2013). For non-justice-involved individuals, they can apply for government assistance programs that are run through their state government; however, in many states, restrictions limit the ability of felons to receive this public assistance. One legacy of the war on drugs and tough-on-crime stance of yesteryear is the continued disqualification of felons from welfare programs—specifically, felons with drug-related criminal backgrounds. As table 1 illustrates, cash assistance through the Temporary Assistance for Needy Families (TANF) program is forbidden for drug-related offenders entirely in 10 states. Meanwhile, 14 states do not disqualify potential recipients at all based on their felony status related to drug crimes. In the 27 other states, restrictions do still apply in some form or another, including requirements like drug testing, supervision, evidence of no longer engaging in a criminal lifestyle, or simpler requirements like disqualification for a certain period of time (McCarty et al. 2016).
| No disqualification (14) | Partial disqualification (27) | Lifetime ban (10) |
|---|---|---|
| AL | AK | AZ |
| CA | AR | DE |
| DC | CO | GA |
| NH | CT | MS |
| NY | FL | MO |
| OH | HI | NE |
| OK | ID | SC |
| OR | IL | SD |
| RI | IN | TX |
| VT | IA | VA |
| WA | KS | – |
| WV | KY | |
| WI | LA | |
| WY | ME | |
| – | MY | |
| MA | ||
| MI | ||
| MN | ||
| MT | ||
| NV | ||
| NJ | ||
| NM | ||
| NC | ||
| ND | ||
| PA | ||
| TN | ||
| UT |
When it comes to restrictions on food-based aid through the Supplemental Nutrition Assistance Program (SNAP), which is also administered by the states, there are similar restrictions in place that disallow felons, particularly those with drug-related crimes, to receive this form of public assistance. SNAP, commonly called “food stamps” or “EBT” colloquially, provides an allowance of vouchers that can be exchanged at participating grocers/retailers for food products. Unlike restrictions on cash assistance, states tend to be less restrictive with this form of public assistance, in part because it is limited to purchasing select items using a voucher rather than a direct cash payment. As table 2 illustrates, 21 states do not consider felon status at all in regard to eligibility for food assistance, in contrast with the 4 states that have lifetime bans on food assistance for those convicted of drug-related felonies. The remaining 26 states do consider drug-related felonies in their eligibility requirements, with many imposing limited-time disqualifications, drug testing, or some other form of verification of a lack of drug involvement.
| No disqualification (21) | Partial disqualification (26) | Lifetime ban (4) |
|---|---|---|
| AL | AK | AZ |
| CA | AR | MS |
| DE | CO | SC |
| DC | CT | WV |
| GA | FL | – |
| IL | HI | |
| IA | ID | |
| ME | IN | |
| MA | KS | |
| NH | KY | |
| NJ | LA | |
| NM | MD | |
| NY | MI | |
| OH | MN | |
| OK | MO | |
| RI | MT | |
| SD | NE | |
| UT | NV | |
| VT | NC | |
| WA | ND | |
| WY | OR | |
| – | PA | |
| TN | ||
| TX | ||
| VA | ||
| WI |
Finally, when it comes to subsidized or public housing programs, there is incomplete data on restrictions in place on a state-by-state basis. This is because localities are given considerable discretion in how they prioritize and distribute available low/no-cost housing; additionally, individual property owners also have considerable discretion about who they will rent to under subsidized Section 8 housing programs. While this analysis will not include consideration of housing policies, it is important to note the wide variance in restrictions on the formerly incarcerated when it comes to these forms of public assistance programs in the United States. The trend for all forms of public assistance restrictions for drug felons has been toward fewer restrictions, with a number of states softening their stance on felon eligibility requirements or removing all distinctions entirely since the mid-2010s (Beitsch 2015). While these changes are moving policy closer to the preferences of the general public today, reform efforts still remain focused on mostly small, politically innocuous changes.
Employment Practices
When it comes to reentry into society, one of the biggest obstacles to a smooth transition is finding employment. In fact, in the United States, over 60% of formerly incarcerated people are unemployed (Wang and Bertram 2022). This high rate of unemployment among those released from prison is not the result of mere chance. In fact, unemployment rates being so high among the formerly incarcerated is the result of potential employment issues that predated incarceration, hesitation among employers to hire the formerly incarcerated, laws and restrictions on felon employment, and self-selection out of positions requiring information about past interactions with law enforcement (Gubernick 2017). While there are many barriers to employment, this analysis focuses on the process of finding a job. Before recent trends emerged, mostly within the last decade, many employers would ask on employment application forms whether the applicant had a criminal record (Flake 2018; Smith 2014; Gubernick 2017). This “box” served as a major barrier to employment, as it highlights past indiscretions that may hurt employment opportunities, but also potential applicants with a criminal background frequently would stop the application process after realizing the question would be asked (Smith 2014; Gubernick 2017). Additionally, preemployment screenings frequently require background checks that look into the past criminal history of applicants. This practice also hurts the prospects of employment for the formerly incarcerated, as their conviction record could scare away employers (Gubernick 2017). In response to the issues caused by these practices, many states have implemented limits on what an employer can ask an applicant, during what stage of the process they can conduct a background check, and the length of time that background checks are allowed to cover.
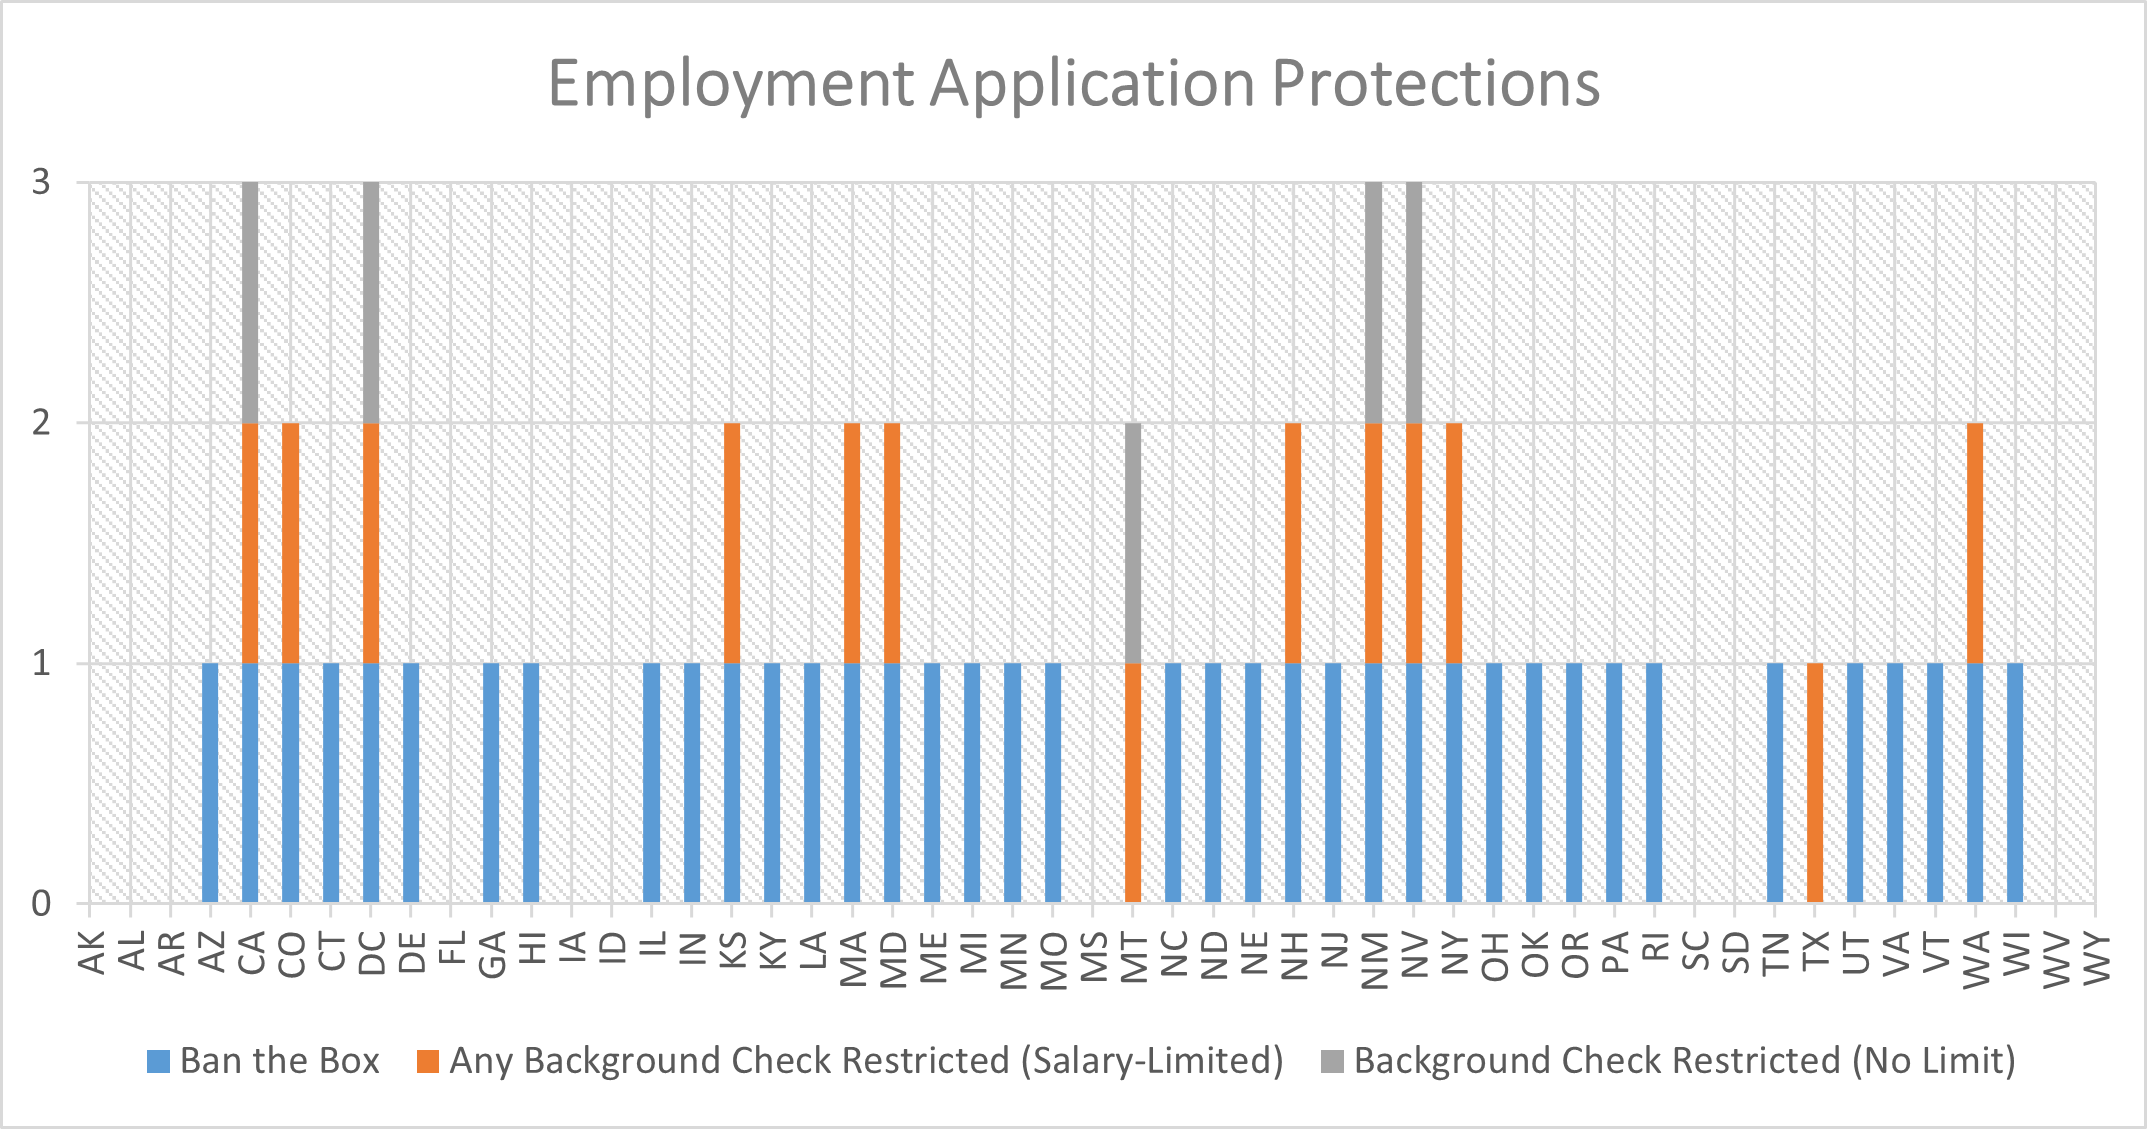
Using data tabulated from the Prison Ed Foundation, I identified states with employment application rules meant to protect the formerly incarcerated from discrimination through the criminal background question and the use of criminal background checks. As figure 3[4] illustrates, 11 states have no restriction on whether an employer can ask about criminal background on an application as well as no restriction on criminal background checks for employment. Meanwhile, 37 states have implemented the policy known as “ban the box,” which prohibits employers from asking about criminal background status on employment applications. Additionally, 8 states implement a salary cap that restricts background checks for lower-paying jobs; meanwhile, 5 states restrict the ability of employers to conduct background checks for employment without meeting strict requirements regardless of the salary offered. The increasingly popular use of a salary cap provision means that applications for positions paying below a certain annual salary cannot require a background check, with most caps for background checks being set at $20,000–$25,000 in annual salary, although Texas and Colorado have a cap of 75,000. There are 13 localities that restrict criminal background checks for employment in some form—either with or without a salary cap.[5] While policies meant to prevent employers from discriminating during the hiring process can smooth the transition to life post-incarceration, some states have taken more proactive steps to help guide justice-involved individuals returning back to society.
Jobs Training and Much More: New Jersey Reentry Corporation
Established in 2014, the New Jersey Reentry Corporation (NJRC) is a nonprofit that works with state and county agencies to help participants meet their basic needs upon reentry. The rationale behind the program is both humanitarian, giving people a second chance, and also very practical. In New Jersey, questions about the cost of incarceration, probation, and supervision of justice-involved people were also discussed in terms of public safety. As leaders began to recognize the high costs of incarceration (nearly 20 times more expensive than probation in NJ) and the indirect connection with public safety, pilot programs were developed to look for a better approach to reintegration.[6] Insight from the reentry programs in Hudson County and Jersey City illustrated the benefits of transition programs for the formerly incarcerated. Officials quickly found that a more cost-effective way to deal with issues of public safety was to connect those reentering society with resources that they could use to smoothly reintegrate with the community. The program began connecting participants with vital services such as health insurance, counseling, housing, public benefits, and job training to improve employment chances. The NJRC has had over 17,000 participants and has helped to connect participants with nearly 9,000 employment opportunities. Further, while New Jersey overall has a one-year recidivism rate of 30.4%, NJRC participants have a recidivism rate of 19.7%, a dramatically lower rate. The program has also helped to connect the formerly incarcerated with assistance that is essential for their successful transition, including over 12,000 participants enrolled with Medicaid programs for health insurance and over 10,000 participants receiving help with substance abuse and addiction services.
By helping to bridge the gap between services like job training and public assistance for people who may not be aware of these programs’ existence, more people are making the transition successfully. While this rate of success is beneficial in its own right, it has achieved broad political support from governors of both parties, in part due to the cost savings to the state in terms of decreased involvement with the legal system and improved public safety (New Jersey Reentry Corporation 2023). New Jersey’s program is just part of a growing trend in the United States that is recognizing the societal benefits and political support for programs like job training. These programs get the post-incarcerated into stable employment, which statistics show will lead to a reduction in recidivism as well as a reduction in the long-term cost for the government.
Assessing State-Level Policies for Post-incarceration
Utilizing the data that were compiled from the Congressional Research Service and the Collateral Consequences Research Center above, I generated a measure for reentry-friendly policies and ranked the states (see table 3). To generate this ranking of policies, I created indices for each of the policy positions of the states in the areas of food assistance (SNAP restrictions), cash assistance (TANF restrictions), employment friendliness (background and ban-the-box policies), and political friendliness (from restrictions on participation after incarceration). An index is an effective way to measure complex concepts, covering a variety of related policy areas and summarizing the findings with one comparable metric. Since the index creates a general score or ranking for each locality in terms of its support for people post-incarceration, it becomes easier to compare the overall degree of reentry friendliness in places that may have very restrictive policies in one issue area but generous policies in another.
The first step in creating a useful index is to identify different components of the index and a justification for the inclusion of each component. In the case of local policies for post-incarceration individuals, the policies already covered in the chapter are suitable, as they all pertain to different aspects or dimensions of reentry-friendly policy. The next step is to quantify each individual component and make sure that they are moving in the same direction. Since the index in this project is focused on reentry friendliness, higher values should indicate a greater degree of reentry friendliness, and lower values should indicate policies that are not friendly for the post-incarcerated. For the social assistance policies, an additive index was created with states creating lifetime bans on assistance due to felony status scoring 0, partial restrictions 1, and no restrictions 2. The employment friendliness indicator ranged from 0–3, with 0 representing no legislation to “ban the box” as well as no legislation limiting the use of criminal background checks in the employment process. States with ban-the-box policies and severe restrictions on the use of criminal background checks for employment scored the highest at 3; meanwhile, states with either limited restrictions on background checks (based on salary) or ban-the-box policies were counted as 2; states with only ban-the-box policies scored 1 in this index. Finally, for the political friendliness measure, the index was created based on when voting rights were restored to the incarcerated, with 5 representing the localities that do not restrict voting while incarcerated and 0 representing states that require executive clemency after incarceration and supervision in order for rights to be restored.
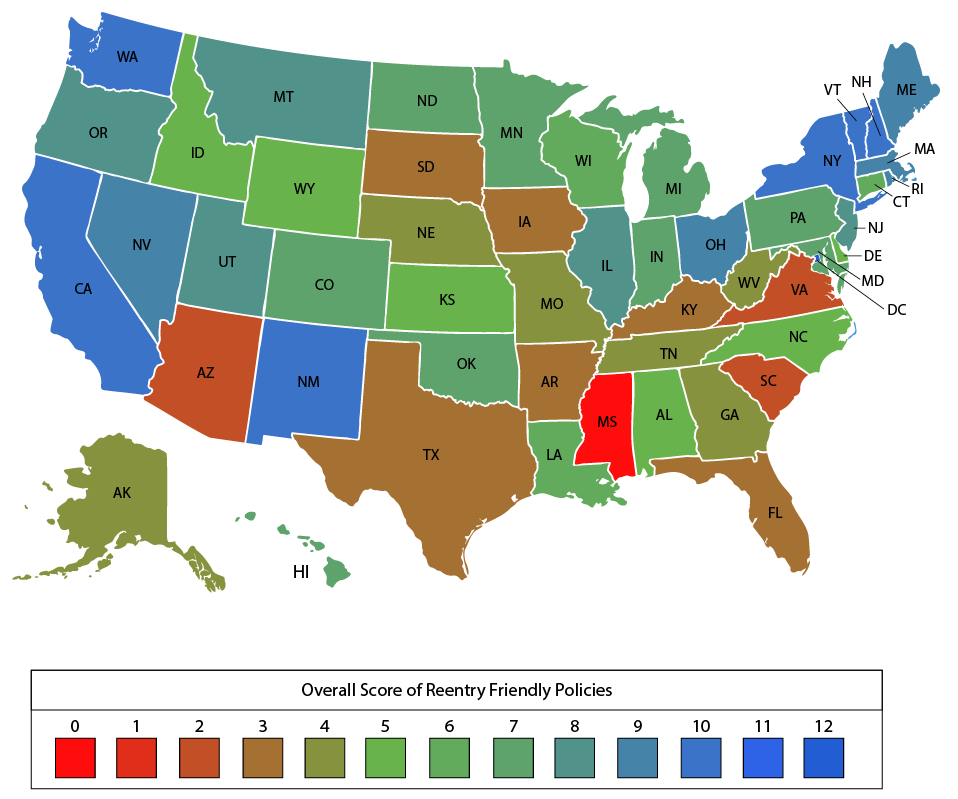
Now that the components have all been oriented so that a higher score represents a friendlier approach toward the post-incarcerated, all that needs to be done is to add up the individual components of the index. An overall score of reentry friendliness was generated by adding up the sum from the four baseline indices and ranges from 0 to 12. A 0 score means that across all of these measures of reentry programs, there is no policy in place that is deemed as friendly toward those reentering society after incarceration. Mississippi is the only state to score a 0 on the 0–12 scale of reentry friendliness. Meanwhile, a 12 represents implementation of all of the policies listed above as friendly to those reentering society, and the only locality that scored a 12 was the District of Columbia.
In terms of policies most friendly for the formerly incarcerated, DC, California, New Hampshire, New Mexico, New York, Vermont, and Washington all rank the highest at 10 or above on the 0–12 scale. Meanwhile, the bottom states scoring 2 or less are Arizona, South Carolina, Virginia, and Mississippi. Although this index is in no way comprehensive and does not capture all of the variation in conditions for reentry, it does illustrate the significant variation in treatment toward those reentering society after incarceration.
| State | Overall score (0–12) | Food assistance (0–2) | Cash assistance (0–2) | Employment friendliness (0–3) | Political friendliness (0–5) | Recidivism rate (1 year) |
|---|---|---|---|---|---|---|
| Washington, DC | 12 | 2 | 2 | 3 | 5 | 17.76 |
| California | 10 | 2 | 2 | 3 | 3 | 44.6 |
| New Hampshire | 10 | 2 | 2 | 2 | 4 | 41.5 |
| New Mexico | 10 | 2 | 1 | 3 | 4 | 49.1 |
| New York | 10 | 2 | 2 | 2 | 4 | 43 |
| Vermont | 10 | 2 | 2 | 1 | 5 | 43.8 |
| Washington | 10 | 2 | 2 | 2 | 4 | 30.7 |
| Massachusetts | 9 | 2 | 1 | 2 | 4 | 33 |
| Maine | 9 | 2 | 1 | 1 | 5 | 26.3 |
| Nevada | 9 | 1 | 1 | 3 | 4 | 24.6 |
| Ohio | 9 | 2 | 2 | 1 | 4 | 32.7 |
| Rhode Island | 9 | 2 | 2 | 1 | 4 | 50 |
| Illinois | 8 | 2 | 1 | 1 | 4 | 38.5 |
| Montana | 8 | 1 | 1 | 2 | 4 | 38.6 |
| New Jersey | 8 | 2 | 1 | 1 | 4 | 30.4 |
| Oregon | 8 | 1 | 2 | 1 | 4 | 13.1 |
| Utah | 8 | 2 | 1 | 1 | 4 | 46.0 |
| Colorado | 7 | 1 | 1 | 2 | 3 | 44.9 |
| Hawaii | 7 | 1 | 1 | 1 | 4 | 48.9 |
| Indiana | 7 | 1 | 1 | 1 | 4 | 38.2 |
| Maryland | 7 | 1 | 1 | 2 | 3 | 40.5 |
| Michigan | 7 | 1 | 1 | 1 | 4 | 26.6 |
| Minnesota | 7 | 1 | 1 | 1 | 4 | 25.0 |
| North Dakota | 7 | 1 | 1 | 1 | 4 | 41.2 |
| Oklahoma | 7 | 2 | 2 | 1 | 2 | 22.6 |
| Pennsylvania | 7 | 1 | 1 | 1 | 4 | 47.1 |
| Connecticut | 6 | 1 | 1 | 1 | 3 | 49.0 |
| Louisiana | 6 | 1 | 1 | 1 | 3 | 29.6 |
| Wisconsin | 6 | 1 | 2 | 1 | 2 | 38.1 |
| Alabama | 5 | 2 | 2 | 0 | 1 | 28.7 |
| Delaware | 5 | 2 | 0 | 1 | 2 | 60.2 |
| Idaho | 5 | 1 | 1 | 0 | 3 | 36.3 |
| Kansas | 5 | 1 | 1 | 2 | 1 | 34.7 |
| North Carolina | 5 | 1 | 1 | 1 | 2 | 35.8 |
| Wyoming | 5 | 2 | 2 | 0 | 1 | 33.8 |
| Alaska | 4 | 1 | 1 | 0 | 2 | 61.6 |
| Georgia | 4 | 2 | 0 | 1 | 1 | 23.3 |
| Missouri | 4 | 1 | 0 | 1 | 2 | 37.2 |
| Nebraska | 4 | 1 | 0 | 1 | 2 | 30.2 |
| Tennessee | 4 | 1 | 1 | 1 | 1 | 47.2 |
| West Virginia | 4 | 0 | 2 | 0 | 2 | 29.3 |
| Arkansas | 3 | 1 | 1 | 0 | 1 | 47.5 |
| Florida | 3 | 1 | 1 | 0 | 1 | 25.4 |
| Iowa | 3 | 2 | 1 | 0 | 0 | 38.7 |
| Kentucky | 3 | 1 | 1 | 1 | 0 | 46.4 |
| South Dakota | 3 | 2 | 0 | 0 | 1 | 44.0 |
| Texas | 3 | 1 | 0 | 1 | 1 | 20.3 |
| Arizona | 2 | 0 | 0 | 1 | 1 | 36.3 |
| South Carolina | 2 | 0 | 0 | 0 | 2 | 21.0 |
| Virginia | 2 | 1 | 0 | 1 | 0 | 22.3 |
| Mississippi | 0 | 0 | 0 | 0 | 0 | 36.8 |
With the creation of measures for reentry-friendly localities, the ability to conduct some preliminary analysis of the relationship between these policies and actual outcomes for the formerly incarcerated is possible. In table 4, I assess the relationship between these measures and the one-year recidivism rates for each state. Correlation is a useful tool to determine relationships between two statistics, as it measures the degree to which changes in one measurement correspond with changes in another. It can provide details about the relationship in terms of direction as well, with positive correlation implying that both variables are moving in the same direction and a negative correlation implying that the measures move in the opposite direction. In terms of the correlation between reentry-friendly policies and recidivism rates, there is not a strong relationship; correlation coefficients resulting from the comparison are very close to 0. For the overall additive index of reentry-friendly policies, the correlation coefficient is positive and 0.02; it is also not statistically significant. This implies that there is no evidence of a meaningful connection between the two and that reentry-friendly policies are not associated with any change in recidivism rates, which is counterintuitive. Since the causal relationship here is not clear, it could be that states with higher rates of recidivism are more likely to look toward reentry-friendly policies to address this issue, although the lack of statistical significance implies a lack of relationship.
| Friendliness measure | Recidivism |
|---|---|
| Overall score | 0.0200 |
| Food assistance | 0.1146 |
| Cash assistance | −0.0198 |
| Employment friendly | −0.0129 |
| Politically friendly | 0.0051 |
Despite failing to find a relationship between reentry-friendly policies and reduced amounts of recidivism within one year of arrest, these policies are important. Recidivism is one metric to judge how effective the formerly incarcerated are at integrating back into society, but it is a fairly incomplete measure, as it only captures the worst possible outcome, returning to prison and doing so quickly. Policies that give formerly incarcerated people access to public assistance programs may allow them to live more fulfilling and less precarious lives. Employment policies meant to limit discrimination based on criminal background can give them opportunities to start fresh after their time served. Political rights restoration through voting can allow them to have a voice in their community and in the overall direction of the government. While the relationship is weak, it does not mean that these policies should be abandoned.
Additionally, a variable that has mostly gone unaddressed in this analysis but is vitally important is the overall discussion of inequality in American society. Income, race, ethnicity, gender, and other areas of inequality dramatically shape who has better opportunities for successful reintegration back into society because these inequalities shape access to resources. In particular, race and income have been noted as significant indicators of the likelihood of avoiding recidivism. There are complicated relationships between policies, individual circumstances, and recidivism that make the impact of any one policy hard to truly quantify.
Discussion
Although many TV shows and movies end with convicts being hauled off to prison, for those who are sentenced to incarceration in the legal system, this is just the first step toward paying their debt to society. Existing inequalities in our society mean that frequently, the legal system is disproportionately punitive for people of color and those from lower socioeconomic backgrounds. Once released, they enter back into society with further disadvantages of social stigma and public policies that can ban them from assistance meant to help provide basic essentials. As a result, 82% of them can expect to become involved with the legal system again within the next decade (Antenangeli and Durose 2021). This bleak outlook and high recidivism rate illustrate the barriers in place to successful reintegration.
The poor outcomes for the formerly incarcerated in the United States reflect a failure to rehabilitate during incarceration and aid in the transition back into society. Ultimately, the policies that are unfriendly to those reentering society come at a human cost of repeat offenses and years of incarceration, a financial cost significantly higher than reentry programs, and an equity cost that denies underprivileged people the ability to put past mistakes behind them. Subjecting them to a task with an 82% failure rate over a decade is not a practical way to improve public safety, ensure equality, or practice financial prudence. The fact that a disproportionate number of people trapped in this cycle are people of color only further perpetuates systemic biases in the legal system and society at large. While public opinion has begun to favor less punitive policy for the formerly incarcerated, public policy in many states still lags significantly behind public sentiment toward a form of lifetime punishment imposed beyond that read by the judge. Although reentry programs on both large and small scales have produced positive (and cost-effective) outcomes for participants, a lack of resources for reentry still exists and is almost certainly part of the explanation for the United States’ high rates of recidivism.
Learning Activity
Reentry Policy Assignment
For this assignment, you will be asked to create a plan for your reentry into society after serving a 5-year term in prison for a drug-related crime. As you create the plan, try to consider as many potential issues that someone reentering society might face and the difficulties that are specific to your locality.
After being sentenced to a term of 8-years in prison, you have been released early due to good behavior after 5 years of incarceration. Considering the time since your initial arrest, it has been nearly 7 years of time you have spent dealing with lawyers, court dates, and of course, incarceration. Unfortunately, during the criminal proceedings, you spent all of your savings to hire a private defense attorney rather than trust a public defender. Additionally, like many justice-involved individuals, you lost your job shortly after your arrest due to stigma and scheduling issues. It has been 7 years since you were employed outside of incarceration and you have no money to your name. You have been released back out into the world with your cellphone, which no longer has service, and the clothes on your back.
Answer the following questions (5-8 sentences).
- Prioritize: What are your first steps? What basic necessities would you prioritize and how would you go about getting them?
- Assess: What laws exist in your state relating to cash assistance, food assistance, and public housing for the formerly incarcerated? Are you eligible for these programs (remember you have a drug offense)?
- Identify: What reentry programs would you be eligible for in your state and city? What do these programs look like? How did you find out about them?
- Determine: What are the prospects for you to find employment? What kind of jobs are most likely to hire someone with a criminal background? What is the timeframe for finding employment?
- Analyze: How likely are you to have a successful reentry into society and avoid being back in the criminal justice system? What changes (if any) should be made to the existing system to help produce better outcomes for those attempting to reenter society after incarceration?
References
Agan, A., and Starr, S., 2018. Ban the box, criminal records, and racial discrimination: A field experiment. Quarterly Journal of Economics, 133(1), 191–235.
Alexander, A., 2020. Banned from the jury box: Examining the justifications and repercussions of felon jury exclusion in the District of Columbia. American Criminal Law Review, 57, 11–17.
Alexander, M., 2012. The new Jim Crow: Mass incarceration in the age of colorblindness. New Press.
Antenangeli, L., and Durose, M. R., 2021. Recidivism of prisoners released in 24 states in 2008: A 10-year follow-up period (2008–2018). US Department of Justice, Office of Justice Programs, Bureau of Justice Statistics.
Augustine, D., 2019. Working around the law: Navigating legal barriers to employment during reentry. Law & Social Inquiry, 44(3), 726–51.
Beitsch, R., 2015. States rethink restrictions on food stamps, welfare for drug felons. Stateline. https://stateline.org/2015/07/30/states-rethink-restrictions-on-food-stamps-welfare-for-drug-felons/. Accessed June 15, 2023.
Brunson, R. K., 2007. “Police don’t like Black people”: African-American young men’s accumulated police experiences. Criminology & Public Policy, 6(1), 71–101.
Buchanan, K. S., 2010. Our prisons, ourselves: Race, gender and the rule of law. Yale Law & Policy Review, 29, 12-23.
Carson, E. A., and Golinelli, D., 2013. Prisoners in 2012: Trends in admissions and releases, 1991–2012. Bureau of Justice Statistics.
Collateral Consequences Research Center, 2020. 50-state comparison: Loss & restoration of civil/firearms rights. Restoration of Rights Project. https://ccresourcecenter.org/state-restoration-profiles/chart-1-loss-and-restoration-of-civil-rights-and-firearms-privileges-2/. Accessed June 15, 2023.
Eyer, K. R., 2019. The new Jim Crow is the old Jim Crow. Yale Law Journal, 128(4), 1002–77.
Flake, D. F., 2018. Do ban-the-box laws really work? Iowa Law Review, 104, 1079–1127.
Geller, A., Garfinkel, I., and Western, B., 2006. The effects of incarceration on employment and wages: An analysis of the fragile families survey. Center for Research on Child Wellbeing, Working Paper, 1–37.
Gendreau, P., Goggin, C., Cullen, F. T., and Andrews, D. A., 2000. The effects of community sanctions and incarceration on recidivism. In Forum on corrections research (vol. 12, no. 2, 10–13). Correctional Service of Canada.
Gilliam, F. D., Jr., Iyengar, S., Simon, A., and Wright, O., 1996. Crime in black and white: The violent, scary world of local news. Harvard International Journal of Press/Politics, 1(3), 6–23.
Gramlich, J., 2021. U.S. public divided over whether people convicted of crimes spend too much or too little time in prison. Pew Research Center. https://www.pewresearch.org/short-reads/2021/12/06/u-s-public-divided-over-whether-people-convicted-of-crimes-spend-too-much-or-too-little-time-in-prison/.
Gubernick, L., 2017. Erasing the mark of Cain: An empirical analysis of the effect of ban-the-box legislation on the employment outcomes of people of color with criminal records. Fordham Urban Law Journal, 44, 1153–1215.
Harding, D. J., Morenoff, J. D., and Herbert, C. W., 2013. Home is hard to find: Neighborhoods, institutions, and the residential trajectories of returning prisoners. Annals of the American Academy of Political and Social Science, 647(1), 214–36.
Hirsch, R. A., Dierkhising, C. B., and Herz, D. C., 2018. Educational risk, recidivism, and service access among youth involved in both the child welfare and juvenile justice systems. Children and Youth Services Review, 85, 72–80.
Holzer, H. J., Raphael, S., and Stoll, M. A., 2006. Perceived criminality, criminal background checks, and the racial hiring practices of employers. Journal of Law and Economics, 49(2), 451–80.
Johnston, T., and Wozniak, K. H., 2021. Public opinion and the politics of collateral consequence policies. Punishment & Society, 23(2), 190–217.
Jones, I., 2021. “Prisons in paradise or purgatory: A comparative analysis between criminal justice systems and recidivism rates in Norway and the United States.” PhD diss., University of Colorado, Boulder.
Katsiyannis, A., Whitford, D. K., Zhang, D., and Gage, N. A., 2018. Adult recidivism in the United States: A meta-analysis 1994–2015. Journal of Child and Family Studies, 27, 686–96.
Kennedy, R., 2012. Race, crime, and the law. Vintage.
Kuehn, S., and Vosgerau, J., 2022. The public’s overestimation of immorality of formerly incarcerated people. Journal of Experimental Criminology, 20(1), 1–27.
McCarty, M., Falk, G., Aussenberg, R. A., and Carpenter, D. H., 2016. Drug testing and crime-related restrictions in TANF, SNAP, and housing assistance. Congressional Research Service.
McElhattan, D., 2022. The proliferation of criminal background check laws in the United States. American Journal of Sociology, 127(4), 1037–93.
Minogue, C., 2011. Why don’t I get the joke? Prison rape in the public discourse. Alternative Law Journal, 36(2), 116–18.
Nawaz, A., and Carlson, F., 2022. PBS NewsHour documentary explores the challenges of life after incarceration. PBS NewsHour. https://www.pbs.org/newshour/show/pbs-newshour-documentary-explores-the-challenges-of-life-after-incarceration.
New Jersey Reentry Corporation, 2023. Program at a glance. NJ Reentry Corporation. https://www.njreentry.org/.
Percival, G. L., 2010. Ideology, diversity, and imprisonment: Considering the influence of local politics on racial and ethnic minority incarceration rates. Social Science Quarterly, 91(4), 1063–82.
Prison Education Foundation Staff, 2019. The 10 best and worst states for recently released inmates. Prison Education Foundation. https://www.prisonedfoundation.org/single-post/the-10-best-and-worst-states-for-recently-released-inmates.
Reisig, M. D., Bales, W. D., Hay, C., and Wang, X., 2007. The effect of racial inequality on Black male recidivism. Justice Quarterly, 24(3), 408–34.
Roman, C. G., 2004. Taking stock: Housing, homelessness, and prisoner reentry. Urban Institute Justice Policy Center Report, 1–93.
Russell, K. K., 1998. The color of crime: Racial hoaxes, white fear, Black protectionism, police harassment, and other macroaggressions. New York University Press.
Smith, J. J., 2014. Banning the box but keeping the discrimination? Disparate impact and employers’ overreliance on criminal background checks. Harvard Civil Rights–Civil Liberties Law Review, 49, 197–227.
Uggen, C., and Manza, J., 2002. Democratic contraction? Political consequences of felon disenfranchisement in the United States. American Sociological Review, 67(6), 777–803.
Valera, P., Brotzman, L., Wilson, W., and Reid, A., 2017. “It’s hard to reenter when you’ve been locked out”: Keys to offender reintegration. Journal of Offender Rehabilitation, 56(6), 412–31.
Van Eijk, G., 2017. Socioeconomic marginality in sentencing: The built-in bias in risk assessment tools and the reproduction of social inequality. Punishment & Society, 19(4), 463–81.
Vuolo, M., Schneider, L. E., and LaPlant, E. G., 2022. Employment application criminal record questions and willingness to apply: A mixed method study of self-selection. American Journal of Sociology, 128(2), 552–92.
Wacquant, L., 2017. From slavery to mass incarceration: Rethinking the “race question” in the US. In Race, Law and Society (277–96). Routledge.
Wakefield, S., and Wildeman, C., 2011. Mass imprisonment and racial disparities in childhood behavioral problems. Criminology & Public Policy, 10(3), 793–817.
Wang, L., and Bertram, W., 2022. New data on formerly incarcerated people’s employment reveal labor market injustices. Prison Policy Initiative. https://www.prisonpolicy.org/blog/2022/02/08/employment/.
Wehrman, M. M., 2011. Examining race and sex inequality in recidivism. Sociology Compass, 5(3), 179–89.
Weiman, D. F., 2007. Barriers to prisoners’ reentry into the labor market and the social costs of recidivism. Social Research: An International Quarterly, 74(2), 575–611.
Western, B., Lopoo, L., and McLanahan, S., 2004. Incarceration and the bonds among parents in fragile families. In Imprisoning America: The social effects of mass incarceration (1–39). Center for Research on Child Wellbeing.
Western, B., and Sirois, C., 2017. Racial inequality in employment and earnings after incarceration. Harvard University.
Wheelock, D., 2005. Collateral consequences and racial inequality: Felon status restrictions as a system of disadvantage. Journal of Contemporary Criminal Justice, 21(1), 82–90.
Wildeman, C., 2009. Parental imprisonment, the prison boom, and the concentration of childhood disadvantage. Demography, 46(2), 265–80.
Wilson, D. C., Owens, M. L., and Davis, D. W., 2015. How racial attitudes and ideology affect political rights for felons. Du Bois Review: Social Science Research on Race, 12(1), 73–93.
- All data compiled from Collateral Consequences Research Center. 2020. 50-State Comparison: Loss & Restoration of Civil/Firearms Rights. Restoration of Rights Project, https://ccresourcecenter.org/state-restoration-profiles/chart-1-loss-and-restoration-of-civil-rights-and-firearms-privileges-2/, accessed June 15, 2023. ↵
- All data compiled from Congressional Research Service: McCarty, M., Falk, G., Aussenberg, R. A., and Carpenter, D. H. 2016. Drug Testing and Crime-Related Restrictions in TANF, SNAP, and Housing Assistance. Washington, DC: Congressional Research Service. ↵
- All data compiled from Congressional Research Service: McCarty, M., Falk, G., Aussenberg, R. A., and Carpenter, D. H. 2016. Drug Testing and Crime-Related Restrictions in TANF, SNAP, and Housing Assistance. Washington, DC: Congressional Research Service. ↵
- All data compiled from Prison Education Foundation Staff. 2019. The 10 Best and Worst States for Recently Released Inmates. Prison Education Foundation. https://www.prisonedfoundation.org/single-post/the-10-best-and-worst-states-for-recently-released-inmates. ↵
- All data compiled from Prison Education Foundation Staff. 2019. The 10 Best and Worst States for Recently Released Inmates. Prison Education Foundation. https://www.prisonedfoundation.org/single-post/the-10-best-and-worst-states-for-recently-released-inmates. ↵
- All data provided by New Jersey Reentry Corporation. 2023. Program at a Glance. https://www.njreentry.org/. ↵
