1 What is Epidemiology?
Learning Objectives
After reading this chapter, you will be able to do the following:
- Define epidemiology
- Provide examples illustrating each of the 5 parts of the epidemiology definition
- Describe the way in which epidemiology fits into the overall public health workforce
Public health deals with the well-being of communities, with a focus on disease prevention. This is accomplished “through the organized efforts and informed choices of society, organizations, public and private communities, and individuals.”i In other words, public health professionals first assess the health status of the population, determine the causes of any health problems, design interventions in an attempt to address those problems, and then reassess the population’s health to evaluate whether the intervention worked.ii
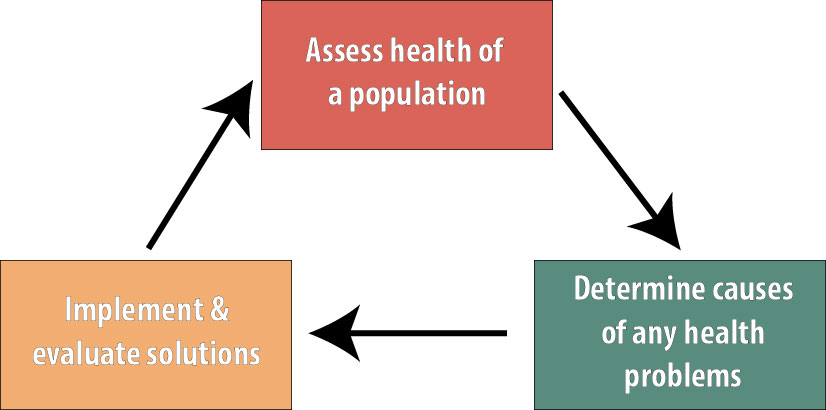
Epidemiology is the basic science of public health, and epidemiologists are heavily involved with all 3 steps shown above. We are involved with surveillance and other health assessment activities, our studies are instrumental in determining the causes of health outcomes, and we are often part of the teams that evaluate public health interventions.[1]
There exist many closely related definitions of epidemiology. This is the one I like:
Epidemiology is the study of the distribution and determinants of disease or other health-related outcomes in human populations, and the application of that study to controlling health problems.ii, iii, iv
There are several key words and phrases in that definition that relate directly back to the core public health functions. First, epidemiologists are concerned with the distribution of a disease — that is, with describing the pattern of an illness in terms of person, place, and time. This descriptive epidemiology effort is almost always a necessary first step in any public health initiative.
Disease Is Not Randomly Distributed
Epidemiology as a science works because disease is not randomly distributed within the population. If it were—that is, if there were no risk factors and nothing that would either cause or prevent a case from occurring other than sheer luck—then we would not be able to determine who is at greatest risk. If we could not determine who is at greatest risk, then prevention efforts (the holy grail of public health) would be impossible. However, disease is not random. Thus epidemiologists spend their time trying to figure out why these people get sick but those people don’t. Once we figure that out, we have a starting point for planning prevention campaigns with our public health colleagues.
Distribution
Person
Who is getting sick? Men? Women? The elderly? Children? People who live near a particular factory? What do the people who experience the health outcome have in common, and what do the people who do not experience the outcome have in common?
As a basic example, let’s look at circadian sleep disorder. Based on data published by the WHO, this is the distribution of this condition, broken out by age and sex:
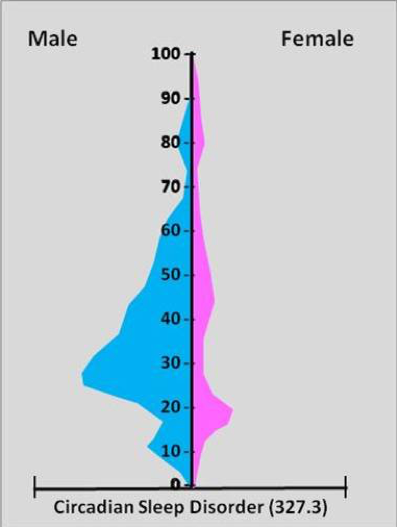
Source: https://brianaltonenmph.com/…/socioculturalism-and-health/
Several things become apparent from Figure 1-2. First, circadian sleep disorder is much more common in males than in females. Second, this disorder is most common in adult males in their 20s and 30s. Third, for those females who do have this disorder, it is the most common in adolescents and young adults.
Knowing these patterns—the distribution—of disease would be helpful if you were a clinician trying to diagnose a patient complaining of troubled sleep. Is the patient a 5-year-old female? If so, then it’s probably not circadian sleep disorder. Knowing patterns of disease is also useful for public health departments, so they can plan what to do with their limited resources. A health education campaign about healthy sleep habits, according to this figure, would get the most “bang for the buck” if it were targeted at young and middle-aged adult males.
Place
Like other demographic characteristics, where people live has implications for their health. The classic example is a polluting factory: those families who live closer to the contamination may have poorer health than those living farther away or upwind. Infectious diseases can also vary by geographic region—mosquito-borne diseases such as malaria, dengue, and Zika are common in the tropics, where the Aedes aegypti mosquitoes[2] that carry these diseases live, and do not occur in colder regions, which are populated with different mosquito species. Thus a physician in Maine would likely not diagnose malaria unless the patient had recently been traveling to the tropics.
Health behaviors can also vary by geography. The Centers for Disease Control and Prevention (CDC) recently published these data on seat belt use throughout the US:
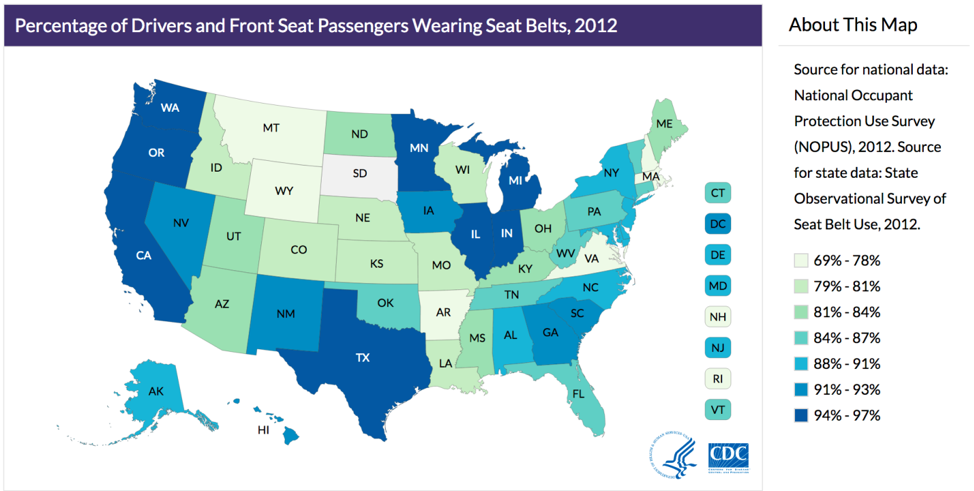
Source: https://www.cdc.gov/…/seatbelt_map.html
Again, studying and understanding the distribution of disease or behavior by place matters for both clinicians and public health professionals: a health department in Minnesota probably does not need to spend resources encouraging seat belt use, whereas in Montana, this might be an excellent use of resources.
Time
The final important factor in descriptive epidemiology is time: How is the distribution of the disease changing over time? For instance, Figure 1-4 gives us a picture of cesarean section rates over 15 years in New South Wales, Australia:
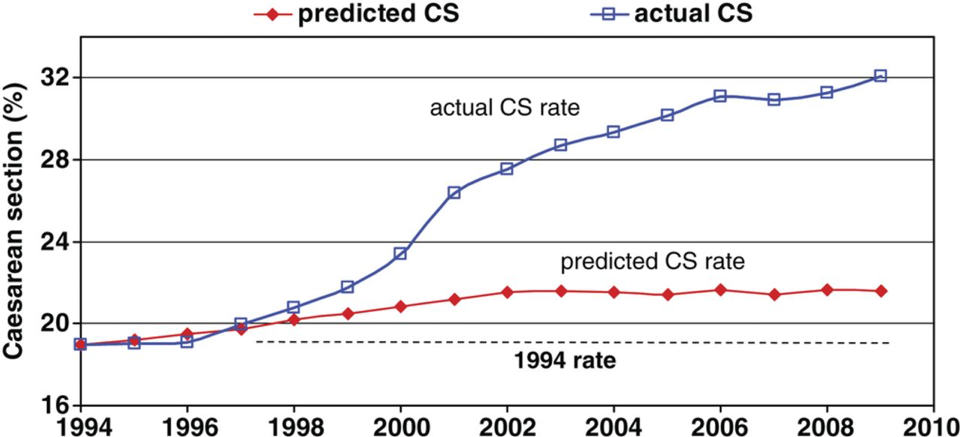
Source: https://bmjopen.bmj.com/…/e001725
The red line indicates the rate of cesarean sections that would be predicted based on pregnancy risk factors, such as maternal height, maternal blood pressure, and whether it is a multiple pregnancy (e.g., twins). You can see that the cesarean rate based on these known predictors was expected to rise only slightly during the 15 years covered by this graph. However, the blue line shows the actual rate, which rose much more quickly than we would have expected. To the extent that cesarean surgery carries risks (major surgery always has risks), this unexpected jump in cesareans—observed throughout the world, not just in Australia—is alarmingv. Indeed, efforts to reduce the cesarean rate are currently a top priority for obstetricians, midwives, and public health officials worldwide.vi, vii, viii, ix
Determinants
In addition to who, epidemiologists are also interested in why, which brings us to causes, or determinants. We will cover epidemiologic causal theory in depth in chapter 10; here, I will just introduce the topic briefly.
In epidemiology (and throughout this book), when we say “cause,” we mean “cause or prevent.” In other words, a cause (determinant) is anything that changes the likelihood that an individual will become diseased. Sometimes a determinant increases this chance (e.g., smoking); other times, a determinant decreases this chance (e.g., exercise). By this logic, both smoking and exercise are “causes” of disease—the former increases the risk of a variety of conditions, and the latter generally reduces risks. In epidemiology, a determinant, or cause, can be anything that meets the criterion of altering one’s risk of disease: behaviors, demographics, genetics, environmental contaminants, and so on. Collectively, all determinants of that disease are called the etiology of a disease.
Cause or Disease?
Health behaviors are unique in epidemiology in that they can, depending on context, be both determinants and diseases. For example, smoking causes lung cancer (it’s a determinant). However, in an evaluation of a smoking cessation program, smoking is the outcome (it’s the “disease”). The same is true for physical activity, nutrition, etc.
Disease
Much like cause, disease is an interesting word in epidemiology—it is used to mean “any health-related condition or outcome.” Epidemiologists study all manner of health outcomes. Some are “diseases” in the traditional, illness sense: measles, HIV, diabetes, and leukemia. Others are definitely health outcomes but aren’t a disease per se: pregnancy, malnutrition, physical activity, death. Throughout this book, the word disease will be used to refer to any health outcome regardless of whether it is traditionally thought of as a disease in the sense of illness.
Populations
Epidemiologists concern themselves with populations, not individual people. This is both a great asset and a source of great confusion!
First, a definition: a population is a group of people with a common characteristic. This could be residents of the United States, people with type 1 diabetes, people under age 25 who work full-time, and so on. For epidemiologists, the population is the group of people about whom we wish to be able to say something. For instance, say that we are interested in whether the amount of sleep a student gets is related to his or her grade point average (GPA). If we are mainly interested in this relationship among college students, then our population might be “full-time undergraduates.” However, there are a lot of full-time undergraduates in the world; we cannot possibly enroll them all into our study. We therefore draw a sample from the target population and do the study with the people in the sample (which here will be some smaller group of full-time undergraduates).
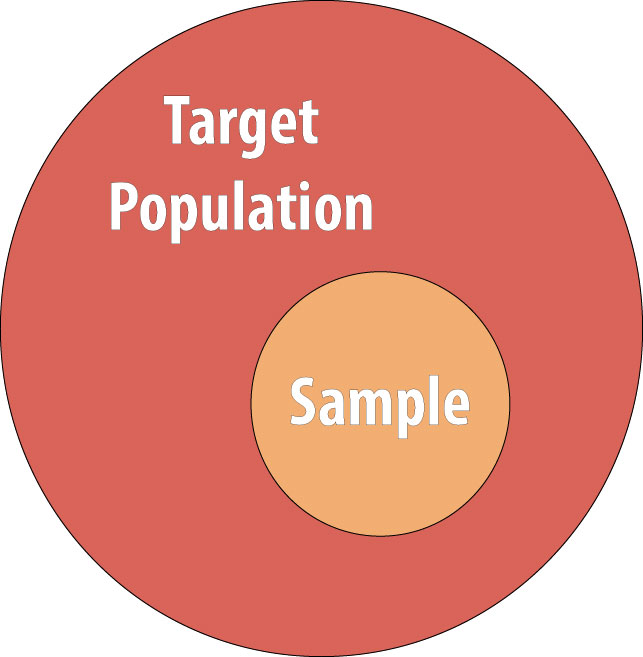
Ideally, the sample will be similar enough to the target population that our results can indeed be generalized back to that population (remember, the target population is the group we want to say something about); therefore, we would work to recruit a diverse sample of students who are similar to the population. We would be hard-pressed to generalize to all full time undergraduates if our study was done only among first-year biology majors. However, note that the generalizability of our sample does not always matter as much as it does in other fields (see chapter 6 for a lengthier discussion of external validity).x
Inclusion/Exclusion Criteria
We define populations via lists of inclusion and/or exclusion criteria. These are just flip sides of the same coin: you can either include kids or exclude adults. It usually doesn’t matter whether inclusion or exclusion criteria are used; whichever provides the greatest clarity is generally the best choice. When defining a population, the list of inclusion and exclusion criteria must be sufficiently complete that any given person could look at it and decide whether they were in the population.
As an example, if we were planning a study of strength training to prevent osteoporotic fractures in elderly women, the inclusion/exclusion criteria would need to specify the following:
- the lower (and potentially, upper) age cutoff (i.e., what is “elderly” for our purposes?)
- whether we are interested in biological females, those who identify as women, or both
- whether there are any exclusions in terms of physical capabilities (e.g., not all elderly women are able to do a strength training regimen)
We might choose to exclude women for whom exercise of any kind is contraindicated (e.g., if they are heart failure patients), or those who have already had a hip fracture, and so on.
Note that, when creating inclusion/exclusion criteria lists, only rarely is there a “correct” answer. Often, scientific or clinical considerations will help narrow it down, but in our example above, it probably doesn’t matter if we set the lower age bound at 60, 65, or 70, as long as we set one and stick to it. Occasionally, policy reasons dictate that one group or another is chosen—for instance, Medicare in the US covers individuals ages 65 and older, so we often see studies in this age group specifically.
Let’s reflect back on our definition of epidemiology: we are looking at distributions and determinants of disease in populations. This is an important point to understand—physicians, nurses, and other clinicians are concerned mainly with diseases in individuals, whereas in epidemiology, our focus is instead on populations. This can make interpreting epidemiologic results difficult, since epidemiologic results pertain to populations, not individuals.
For instance, recent data on deaths related to the opioid epidemic suggest that the riskiest state in the US is West Virginia (43.4 opioid-related deaths per 100,000 people in one year) and the least risky is Nebraska (2.4 per 100,000 people in one year).xi Note that these statistics say nothing about individual levels of risk—all that they say is that, on average, people from West Virginia are much more likely to die from opioid-related causes than people from Nebraska. These are population-level data. For any one individual, we must consider much more than just where the person lives, although that is certainly relevant. A person addicted to painkillers in Nebraska surely has a higher risk of opioid-related death than does a person in West Virginia who has never taken any pain medicine stronger than aspirin, even though the population-level risks might suggest otherwise.
Population-level statistics are a powerful tool because they allow us to do the work of epidemiology—figuring out why some groups (populations) are at higher risk than others. However, when looking at aggregated statistics, one must always keep in mind that any one individual’s risk is lost within the group. For example, returning to our sleep/GPA study, suppose we are concerned with the average amount of sleep for male and female students. We define our population as full-time, on-campus undergraduates at 4-year institutions in the US (these are the inclusion criteria). We decide to draw our sample from Oregon State University (OSU) and recruit 4,000 students—2,000 males and 2,000 females—to be in our study. We determine that male students sleep an average of 7.2 hours per night and that female students sleep an average of 7.9 hours per night. While this comparison may allow us to comment on differences between male and female students on a population level, it says nothing about individual students. Within our sample, it would be relatively easy to find a given pair of students wherein the male student averaged more sleep than the female.[3] When interpreting epidemiologic data, therefore, it is always important to remember that the data refer to groups of people—not to individuals.
Controlling Health Problems
The final piece of our definition is that epidemiology uses all of the information on distributions and determinants of diseases in populations to control health problems. This final application step is not included in all epidemiology definitions, and indeed whether it should be is controversial in the field.xii To my way of thinking, however, the rest does not matter without this step. Epidemiology is the fundamental science of public health, and public health is concerned with preventing disease and improving general wellness in the public. Merely knowing that male students get less sleep than female students does us little good. Who cares? The way we can contribute to the health of the public is by taking action based on this knowledge. Imagine if the epidemiologists who first made the link between smoking and lung cancer had not acted on their findings!xiii
Epidemiologic data are a key part of numerous possible public health actions, including health education campaigns, policy or regulation changes, clinical practice changes, and many other initiatives. Rarely do epidemiologists take this step by themselves—collaboration with professionals from other fields within and related to public health is a must. However, the data generated by epidemiologists are fundamental to planning these actions, the effectiveness of which should always be formally evaluated (a process that often involves epidemiologists) to make sure they worked as intended.
Epidemiology Two Ways
The word epidemiology can refer both to the set of methods we use to study the distribution and determinants of disease (as I have used the term thus far in this chapter) – as well as to the collected body of knowledge for a particular health outcome gained as a result of that study. For instance, everything we know thus far about risk factors and prognoses for heart failure can collectively be referred to as “the epidemiology of heart failure.”
Conclusions
Epidemiology is an important field within public health. Epidemiologists study disease patterns within populations to determine risk profiles and potential health-improvement targets, and they collaborate with others to implement data-driven, population-level, health-related interventions.
References
i. Introduction to public health. Centers for Disease Control and Prevention (CDC). https://www.cdc.gov/publichealth101/public-health.html. Published December 20, 2017. Accessed August 21, 2018. (↵ Return)
ii. Aschengrau A, Seage GRI. Epidemiology in Public Health. 3rd ed. Burlington, MA: Jones and Bartlett Learning; 2014. (↵ Return 1) (↵ Return 2)
iii. Porta M. A Dictionary of Epidemiology. 5th ed. New York: Oxford University Press; 2008.> (↵ Return)
iv. MacMahon B, Trichopoulos D. Epidemiology: Principles and Methods. 2nd ed. Boston: Little, Brown; 1996. (↵ Return)
v. Lancet T. Stemming the global caesarean section epidemic. The Lancet. 2018;392(10155):1279. doi:10.1016/S0140-6736(18)32394-8 (↵ Return)
vi. American College of Obstetricians and Gynecologists. ACOG practice bulletin no. 115: vaginal birth after previous cesarean delivery. Obstet Gynecol. 2010;116(2 pt 1):450-463. doi:10.1097/AOG.0b013e3181eeb251 (↵ Return)
vii. Reducing primary cesareans. American College of Nurse-Midwives. 2018. http://birthtools.org/Reducing-Primary-Cesareans-NEW. Accessed October 12, 2018. (↵ Return)
viii. U.S. birth data underscores higher C-section risks, CDC says. Reuters. 2015. https://www.reuters.com/article/us-usa-health-cesarean/u-s-birth-data-underscores-higher-c-section-risks-cdc-says-idUSKBN0O524X20150520. Accessed October 12, 2018. (↵ Return)
ix. WHO statement on caesarean section rates. World Health Organization (WHO). http://www.who.int/reproductivehealth/publications/maternal_perinatal_health/cs-statement/en/. Accessed October 12, 2018. (↵ Return)
x. Rothman KJ, Gallacher JEJ, Hatch EE. Why representativeness should be avoided. Int J Epidemiol. 2013;42(4):1012-1014. doi:10.1093/ije/dys223 (↵ Return)
xi. Abuse NI on D. Opioid summaries by state. National Institute on Drug Abuse. 2018. https://www.drugabuse.gov/drugs-abuse/opioids/opioid-summaries-by-state. Accessed September 7, 2018. (↵ Return)
xii. Keyes K, Galea S. What matters most: quantifying an epidemiology of consequence. Ann Epidemiol. 2015;25(5):305-311. doi:10.1016/j.annepidem.2015.01.016 (↵ Return)
xiii. Doll R, Hill AB. Smoking and carcinoma of the lung. Br Med J. 1950;2(4682):739-748. (↵ Return)
- Public health interventions comprise any action by a health department, legislative body, or other allied health professional that is designed to improve public health. This could be an education campaign (e.g., billboards about hazards of smoking), surveillance and follow-up, disease outbreak investigation, legislative policy development, outreach efforts (e.g., taking a dental van to elementary schools), etc. ↵
- Mosquitoes here are the disease vector—see http://www.who.int/news-room/fact-sheets/detail/vector-borne-diseases for more information about infectious disease vectors. ↵
- Also masked within these averages, of course, are personal variations. Even if I average 7.4 hours of sleep per night, certainly there are nights where I get less and nights where I get more. See chapter 6 for a more thorough discussion of this and other issues. ↵
A group of people who share a common characteristic.
The ongoing, systematic collection, analysis, and interpretation of health data, essential to the planning, implementation, and evaluation of public health practice, closely integrated with the timely dissemination to those who need to know. Surveillance both (1) provides information for descriptive epidemiology (person, place, time), and (2) allows us to know what "normal" is, so that potential epidemics are identified early. Also called public health surveillance.
A summary of what is known about a particular condition, including data on incidence, prevalence, and known risk factors.
Things that cause or prevent disease. Also called “causes.”
The sum of what is known about how a disease process develops within an individual, including known determinants.
The group actually enrolled in a study. Hopefully the sample is sufficiently similar to the target population that we can say something about the target population, based on results from our sample. In epidemiology we often don’t worry about getting a “random sample”–that’s necessary if we’re asking about opinions or health behaviours or other things that might vary widely by demographics, but not if we’re measuring disease etiology or biology or something else that will likely NOT vary widely by demographics (for instance, the mechanism for developing insulin resistance is likely the same in all humans). Nonetheless, if the sample is different enough than the target population, that is a form of selection bias, and can be detrimental in terms of external validity.
The group about which we want to be able to say something. One only very rarely is able to enroll the entire target population into a study (since it would be millions and millions of people), and so instead we draw a sample, and do the study with them. In epidemiology we often don't worry about getting a "random sample"--that's necessary if we're asking about opinions or health behaviors or other things that might vary widely by demographics, but not if we're measuring disease etiology or biology or something else that will likely not vary widely by demographics (for instance, the mechanism for developing insulin resistance is the same in all humans).
See external validity.
The extent to which we can apply a study’s results to other people in the target population. Synonymous with generalizability. External validity is irrelevant if a study lacks internal validity.
Osteoporosis is a bone disease, most usually seen in slender, elderly women. Osteoporotic ('osteo' refers to bone; when combined with 'porous' it means the bones have holes in them) bones are very weak and prone to fracture.
Summarized/tabulated.
The likely course of a disease; how well someone with the disease will fare, given current treatment regimens.
