8 Solid Rock and Bowls of Jello
“Anyone who hears my words and puts them into practice is like the wise man who built his house on rock. When the rainy season set in, the torrents came and the winds blew and buffeted his house. It did not collapse; it had been solidly set on rock. Anyone who hears my words but does not put them into practice is like the foolish man who built his house on sandy ground. The rains fell, the torrents came, the winds blew and lashed against his house. It collapsed under all this and was completely ruined.”
Book of Matthew 7:24-27
1. Introduction
We live in earthquake country, but we don’t want to leave the Pacific Northwest. Fortunately, we know how to improve our chances for survival simply by making intelligent decisions about where we live or work and how we build. The technology is at hand to evaluate the geologic setting of a building site with respect to earthquake hazard.
Three different earthquake problems are associated with surface sites: (1) amplification of seismic waves by soft surficial deposits, (2) liquefaction of near-surface sediments, and (3) failure of hillslopes by landslides, rockfalls, and debris flows.
2. Amplification of Seismic Waves by Soft Surficial Deposits
It is a short stroll from Fort Mason, west of Ghirardelli Square and Fisherman’s Wharf in San Francisco, to the fashionable townhouses of the upscale Marina District, yet the intensity of ground motion of these two areas during the earthquake of October 17, 1989, was dramatically different. The Marina District experienced intensities as high as IX, higher even than at the epicenter itself, more than sixty miles away. Fort Mason and Fisherman’s Wharf experienced intensities of only VII.
On April 18, 1906, Fort Mason was under the command of Captain M. L. Walker of the U.S. Army Corps of Engineers. The great San Francisco Earthquake had shaken Captain Walker awake, but he had then gone back to bed, thinking that the earthquake was “no more than a mild shaker.” Brigadier General Frederick Funston, on Sansome Street in the maelstrom of collapsed buildings and towering fires, sent Captain Walker an urgent summons to muster his company of troops. The captain had to be roused a second time.
Why was Fort Mason spared the worst of both earthquakes? Fort Mason is built on bedrock, and the Marina District that was damaged in 1989 is built on soft sediment. The geologic foundation material made all the difference.
The Marina District was built on fine sand from San Francisco Bay, “made land” that was hydraulically emplaced after the 1906 earthquake, together with rubble from buildings destroyed by that earthquake. This material was pushed together to make a building site for an international exposition in 1915 that said to the world, “San Francisco is back!” Yes, San Francisco was back, all right, but the sand and rubble contained a time bomb: the foundation was too poorly consolidated to hold up well during the next earthquake. In October 1989, the time bomb went off.
Figure 8-1 shows seismograms of an aftershock of magnitude 4.6 on October 21 recorded at Fort Mason (MAS), where the seismograph was established on bedrock, and two sites in the Marina District, one (PUC) on dune sand from an ancient beach, and the other (LMS) on the artificial fill emplaced after the 1906 earthquake. The seismic waves were much stronger at PUC and LMS than at MAS, an indication of more violent seismic shaking, leading to more damage. The waves were also of much lower frequency. Engineers call a station like MAS a rock site, and stations like PUC and LMS soil sites.
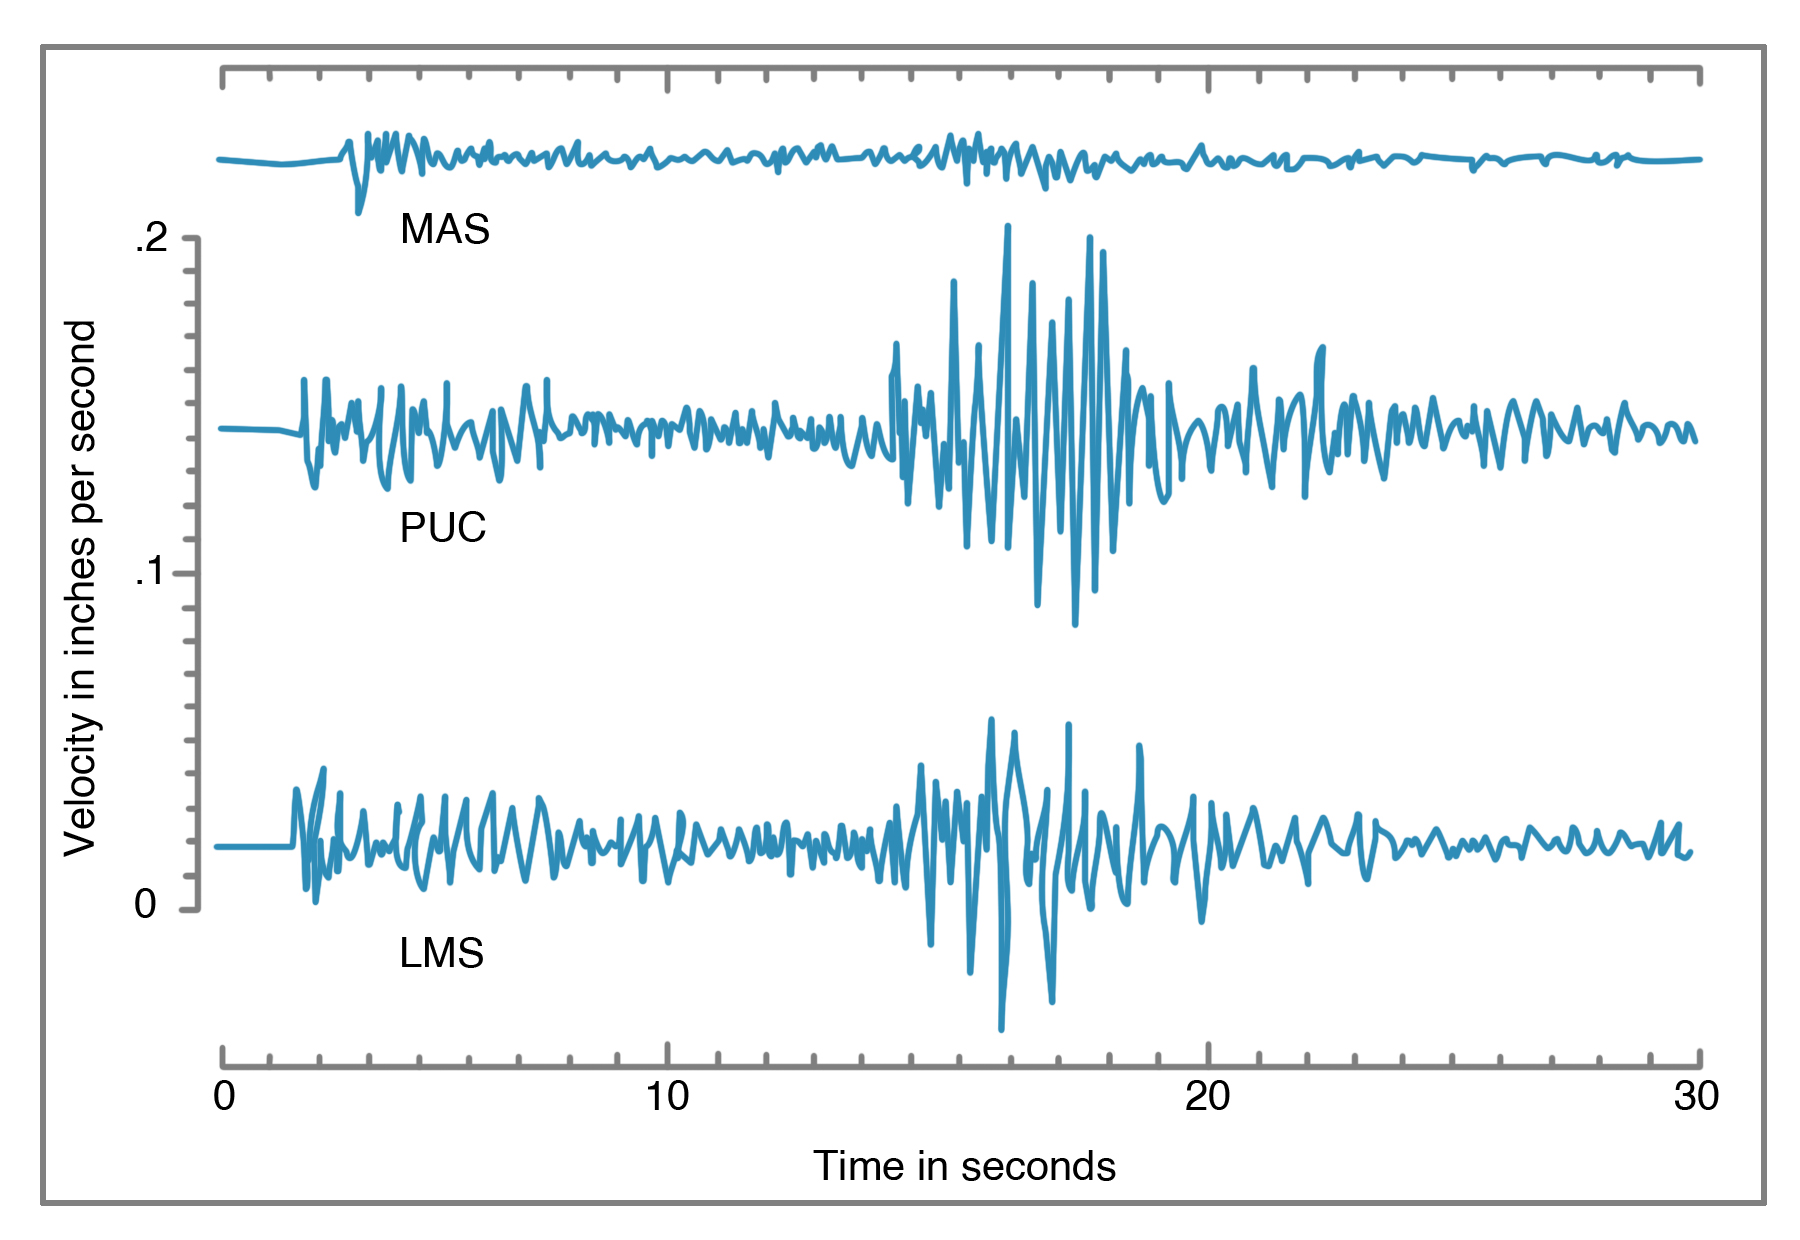
An analogy is commonly made between these two types of site and a bowl of jello on a table, an experiment that can be done at home. Stack two or three children’s blocks on top of one another on the table top, then stack some more blocks on top of the jello. Then jolt the table sideways. The blocks on the jello will fall over, whereas the blocks directly on the table top might remain standing. The shaking of the blocks on the table illustrates the effect of a seismic wave passing through bedrock. When the shaking reaches the bowl of jello, however, the waves are amplified so that the top of the jello jiggles and causes the blocks to topple. In a similar fashion, the soft foundation materials at a soil site will amplify the seismic waves, which results in much more vigorous shaking than would be expected at a rock site.
A tragic illustration of this phenomenon was provided by the magnitude 8.1 Mexico City Earthquake of 1985. Actually, the epicenter of the earthquake was in the Pacific Ocean on a subduction zone, hundreds of miles from Mexico City. It is called the Mexico City Earthquake because of the terrible losses suffered by that city. More than fifteen million people live in Mexico City, many in substandard housing, which was one reason why so many lives were lost. But more important is the geologic foundation: Mexico City is built on the former bed of Lake Texcoco. The clay, silt, and sand of this ancient lake, in part saturated with water, greatly amplified the seismic waves traveling from the subduction zone. More than five hundred buildings fell down, and more than ten thousand people were killed. The floor of Lake Texcoco truly acted like the bowl of jello resting on the table top that is the Earth’s crust beneath the lake deposits.
The Mexico City Earthquake provided a lesson for the major cities of the Willamette Valley, Puget Sound, and the Fraser River delta in southwestern British Columbia. Much of the foundation of these cities is soft sediment: deltaic deposits of the Fraser and Duwamish rivers, glacial deposits in Puget Sound, and alluvial deposits of the Willamette and Columbia rivers. Even though a subduction-zone earthquake would be far away, near the coast or offshore (as it was for Mexico City), these soft sediments would be expected to amplify the seismic waves and cause more damage than if the cities were built on bedrock. Fortunately for the people of the Pacific Northwest, building standards are higher than those in Mexico City in 1985, so we would not expect as high a loss of life. In addition, geotechnical experience with many earthquakes around the world permits a forecast of the effects of near-surface geology on seismic waves from various earthquake sources. In other words, this is a problem we can do something about.
These techniques are illustrated by a study led by Ivan Wong, then of Woodward-Clyde Federal Services, in cooperation with the Oregon Department of Geology and Mineral Industries for the City of Portland. Because no two earthquake sources are alike, Wong and his colleagues programmed computer simulations based on a Cascadia Subduction Zone earthquake of Mw 8.5 and crustal earthquakes of Mw 6 and Mw 6.5. Because the surface effects are strongly influenced (attenuated) by the distance of a site from the epicenter, they used distances from the crustal source to the site of five, ten, and fifteen kilometers (1.6 kilometers = one mile).
What property of a seismic wave is best for determining the hazard to buildings? Wong’s group used peak horizontal acceleration, expressed in percentage of gravity (percent g). Acceleration is the rate of increase in speed of an object. If you step off a cliff and fall through space, your speed will accelerate from zero at a rate of 32 feet (9.8 meters) per second every second, due to the gravitational attraction of the Earth. This is an acceleration of 1 g. When an earthquake has a vertical acceleration greater than 1 g, stones or clods of earth are thrown into the air, as first observed during a great earthquake in India in 1897. Vertical accelerations greater than 1 g were recorded during the 1971 San Fernando, California, Earthquake, with the result that a fire truck with its brakes set was tossed about the Lopez Canyon Fire Station, leaving tire marks on the garage door frame 3 feet above the floor.
Horizontal accelerations may be measured as well. A car accelerating at a rate of 1 g would travel 100 yards from a stationary position in slightly more than 4 seconds. As we will see later, horizontal accelerations are particularly critical, because many older buildings constructed without consideration of earthquakes are designed to withstand vertical loads, such as the weight of the building itself, whereas an earthquake may cause a building to shake from side to side, accelerating horizontally. A higher peak acceleration will lead to a higher earthquake intensity at a given site.
Other properties of strong ground motions that relate to damage are velocity—how fast a building shakes back and forth during an earthquake—and displacement—how far the seismic wave causes the ground to move from side to side. In general, the higher the acceleration, the higher the velocity and displacement. However, it does not follow that the higher the magnitude of the earthquake, the higher the acceleration. Some of the highest aaccelerations ever recorded occurred during earthquakes of magnitude less than 7. The Yountville Earthquake of September 3, 2000, in northern California, had a magnitude of only M 5.2, yet it resulted in accelerations up to 0.5 g.
Strong shaking is measured by a special type of seismograph called a strong-motion accelerometer. These instruments are necessary because an ordinary continuous-recording seismograph may go off scale during a strong earthquake. The strong-motion instrument does not record continuously, but is triggered to start recording when the first large earthquake wave arrives, and it stops recording when the waves diminish to a low level. These instruments record the acceleration in percent g; other instruments record velocity or displacement. These records are of particular use to structural engineers, who use them to determine how buildings vibrate during an earthquake. Several instruments may be placed in a single tall building, one in the basement and others on upper floors, showing very different response to shaking of different levels of the building. It is prudent to install strong-motion accelerometers in all major structures such as dams or skyscrapers. The installation cost is very small compared to the cost of the building, and the information revealed during an earthquake is invaluable for future engineering design.
Another consideration is the period of the earthquake waves that are potentially damaging. Period is the length of time it takes one wave length to pass a given point (Figure 3-12). We have already encountered frequency, the number of wave lengths to pass a point in a second. Frequency is equal to 1 divided by the period. As we saw in Chapter 3, earthquakes, like symphony orchestras, produce waves of short period and high frequency (piccolos and violins) and waves of long period and low frequency (tubas and bass violins).
Wong and his colleagues considered the effects on four sites in Portland, Oregon, of a spectrum of waves from high frequency with periods of 0.02 seconds to low frequency with periods of 10 seconds (Figure 8-2). The computer model of their earthquake included the slip on the assumed earthquake fault and the effect of near-surface geology. They drilled boreholes and measured the density (weight per given volume) of the various sedimentary layers they encountered as well as the speed of sound waves passing through the sediments. Soft sediment such as sand or clay is low in density, whereas bedrock such as basalt has a high density. Sound waves (and earthquake waves) pass slowly through soft sediment, and much more rapidly through bedrock.
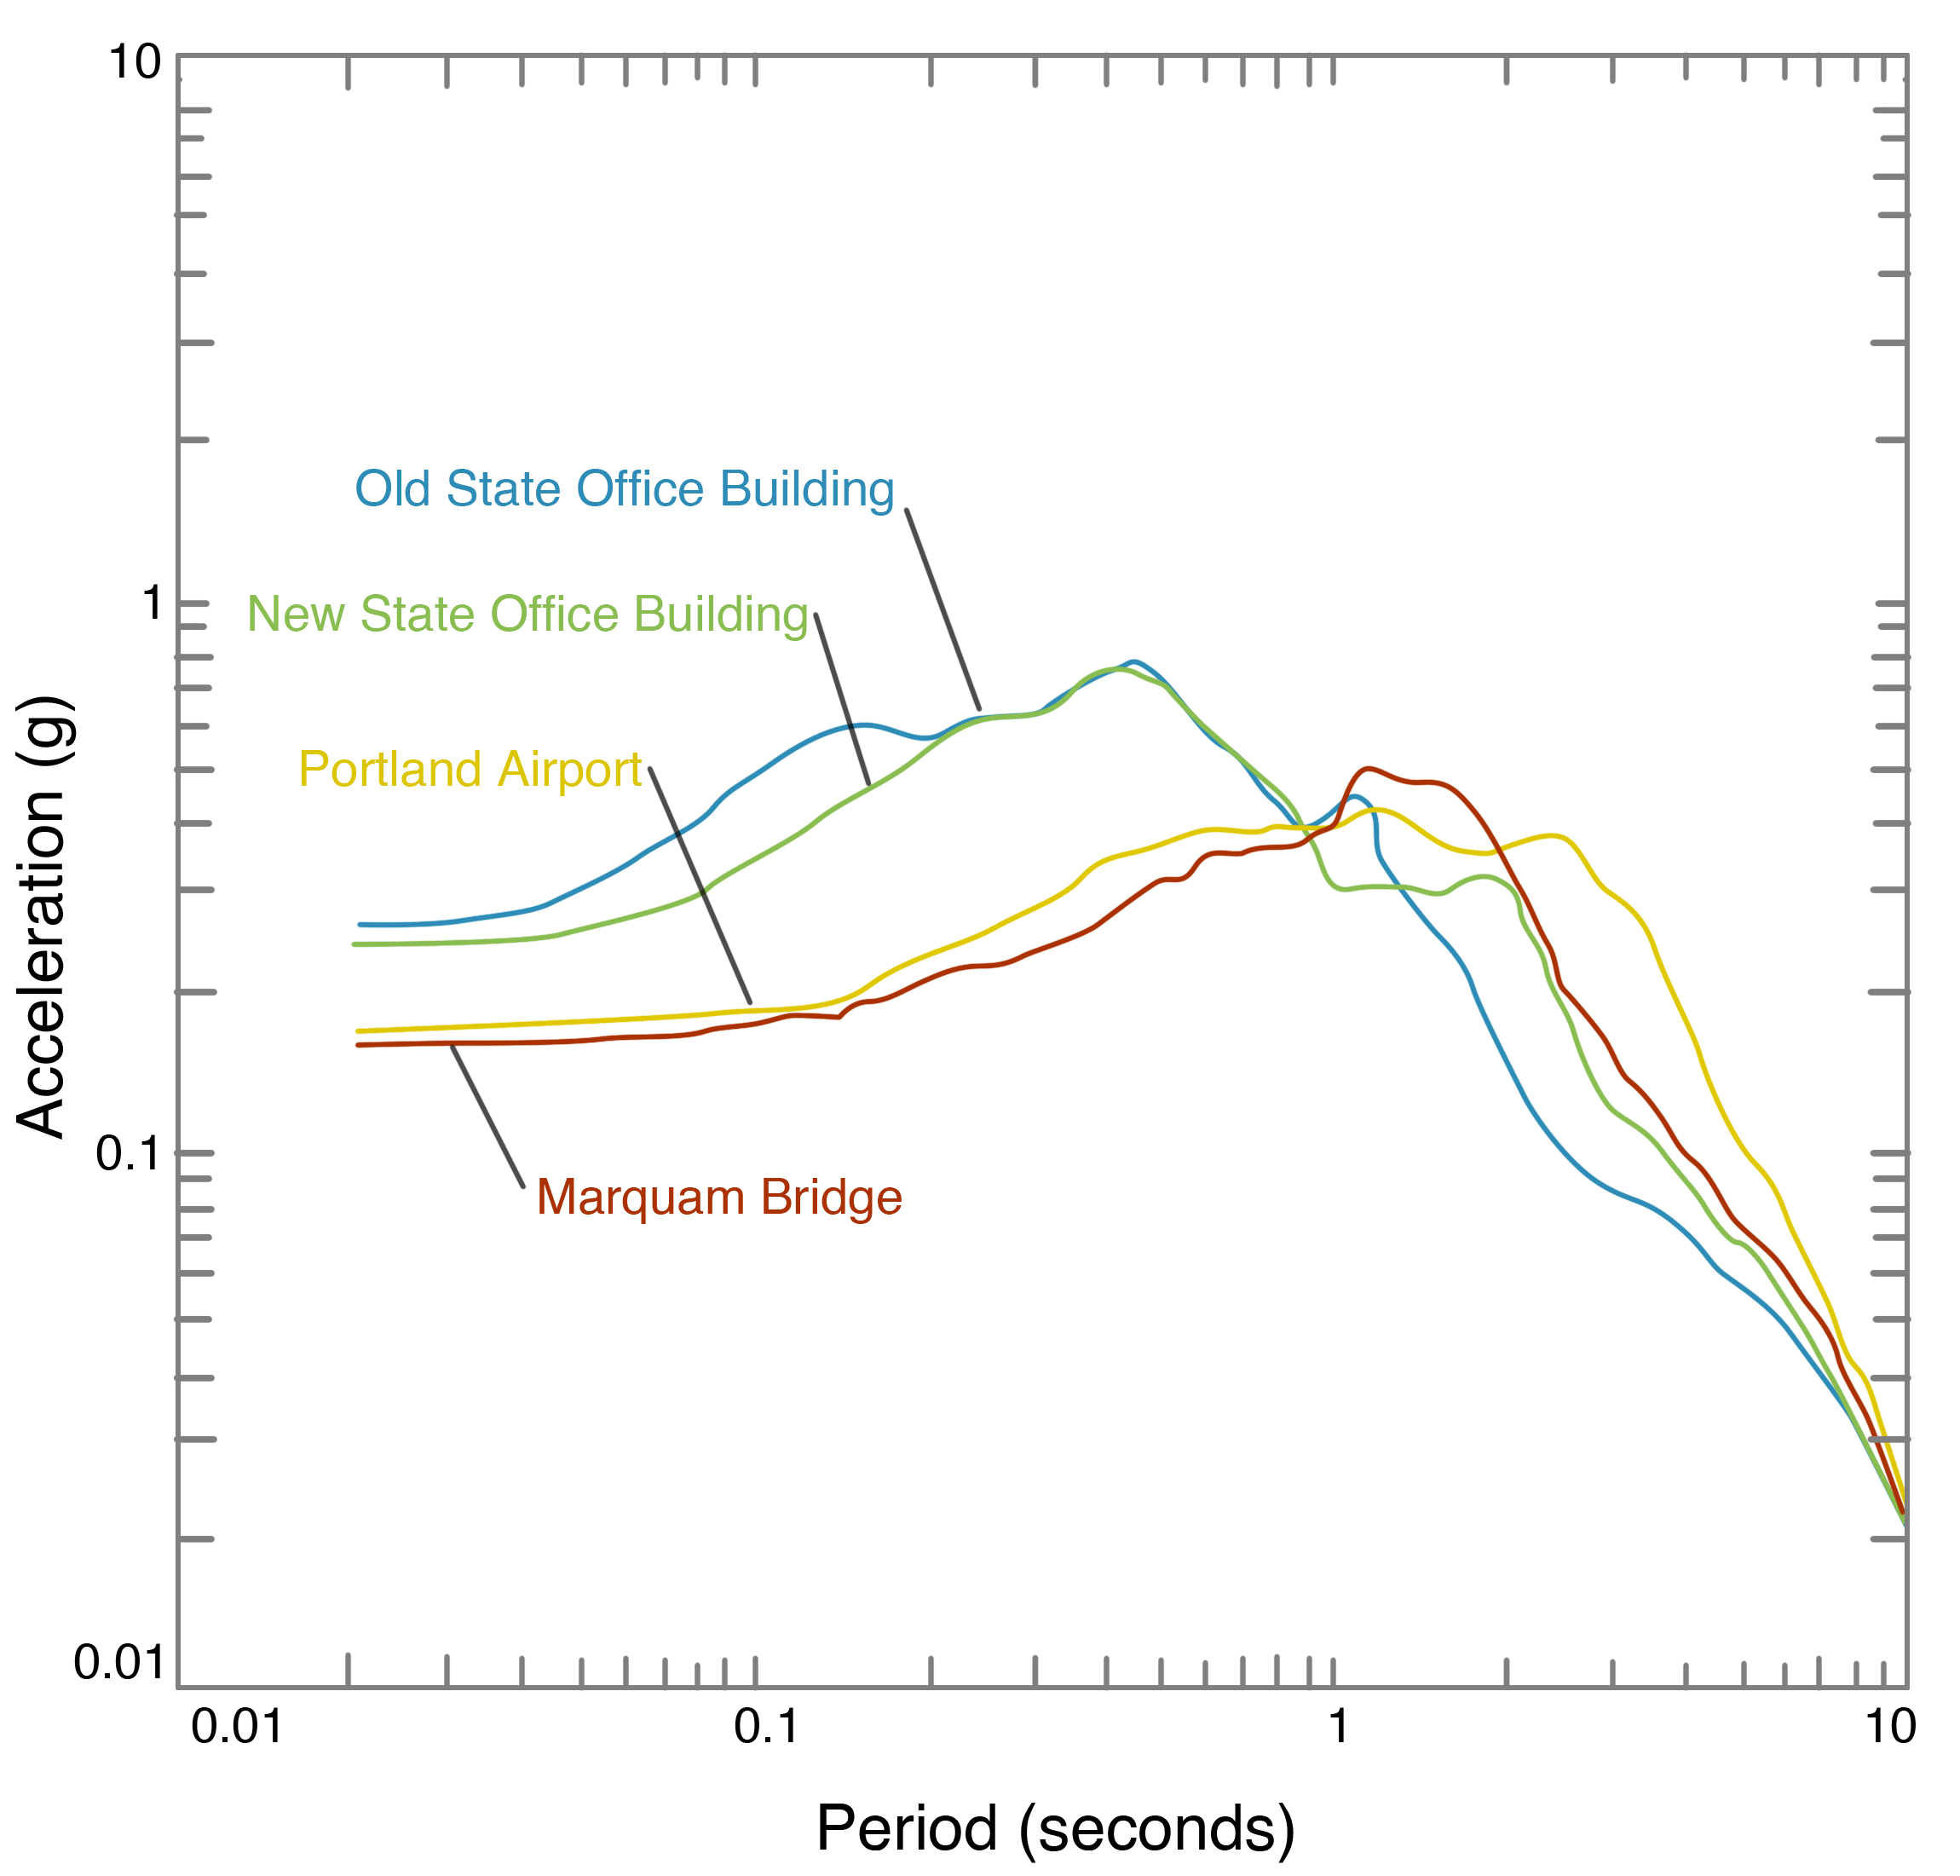
As the seismic waves pass from bedrock to soft sediment, they slow down and increase in amplitude. The increase in amplitude causes greater acceleration of the ground at a particular site, which leads to more intense shaking. For these reasons, the thickness and density of the soft sediment layers directly beneath the surface are critical to the calculation of shaking and potential damage.
Figure 8-2 shows an example of some of their calculations, in this case for a Cascadia Subduction Zone earthquake. These are logarithmic curves; each division has a value ten times that of the previous one. The curves show that the greatest accelerations are expected for seismic waves with periods ranging from 0.4 to 2 seconds. Different sets of curves were obtained for the crustal earthquakes. There is considerable difference in the curves among the four sites, emphasizing the importance of understanding the near-surface geology.
Another factor important in constructing these curves is the attenuation of seismic waves between the earthquake focus and the site in question. Attenuation is affected by the strength and rigidity of the crust through which the seismic wave must pass. Imagine putting your ear against the cut surface of a long log which is struck on the other end by a hammer. If the log is made of sound wood, the vibration caused by the hammer may be enough to hurt your ear. The attenuation of the wave in the log is low. However, if the log is made of rotten wood, you may hear a dull “thunk,” indicating that the attenuation is high. In the crust, high attenuation means that the strength of the earthquake wave falls off fairly rapidly with distance from the focus.
In the discussion above, we have been concerned about the effect on earthquake shaking of the geology at or near the surface of the ground. Recent research in California has shown that the pathtraveled by an earthquake from the source to the surface also can have a dramatic effect on shaking. Kim Olsen and Ralph Archuleta of the University of California at Santa Barbara constructed elaborate computer models of the effects of a M 7.75 earthquake on the San Andreas Fault on shaking in the Los Angeles Basin, thirty to forty miles away. The Los Angeles Basin is filled to depths of four to six miles with sedimentary rocks that have a much lower density than crustal rocks beneath the basin or in the adjacent mountain ranges. Olsen and Archuleta showed that their simulated earthquake would generate surface waves that would slow down and increase dramatically in amplitude as they entered the Los Angeles Basin. In addition, the surface waves would bounce off the base and the steep sides of the sedimentary basin, so that strong shaking would last much longer than it would at the source of the earthquake.
This effect could also be felt in sedimentary basins that are much shallower than the Los Angeles Basin. These include the Tualatin Basin in Oregon, with the cities of Beaverton, Hillsboro, and Forest Grove, the Portland-Vancouver Basin in Oregon and Washington between downtown Portland and Troutdale, and the Seattle Basin in Washington between downtown Seattle and Everett. After the Nisqually Earthquake of 2001, Derek Booth of the University of Washington surveyed sixty thousand chimneys for damage and found that chimney damage was concentrated in West Seattle, Bremerton, and other areas close to the Seattle Fault. West Seattle was also hit hard in the 1965 Seattle Earthquake. The boundary between bedrock on the south and soft sediments on the north is abrupt and steep, and Booth suggested that earthquake waves might have been focused to produce greater damage along a line parallel to the fault. The fault zone might contain highly fractured ground-up rock, giving it a lower speed for seismic waves than unfaulted rock on either side. This low-velocity zone might also focus earthquake waves and increase the damage.
This idea was also tested in the Fraser River Delta around Vancouver, B. C., by studying several strong-motion accelerometers that were triggered by a M 5.3 earthquake at Duvall, Washington, in 1996. The shaking recorded by accelerometers in the delta was stronger than shaking on bedrock sites, as expected, but the strongest shaking was found near the edge of the basin underlying the delta, perhaps due to focusing of seismic energy.
This behavior, related to the path the earthquake wave takes from the source to the site, could be considered a large-scale example of the bowl of jello. In both cases, surface waves are amplified, but in the examples of Los Angeles, the Seattle Fault, and the Fraser River Delta, the shaking is related to the path of the earthquake wave through a thick sedimentary basin, like focusing light through a lens.
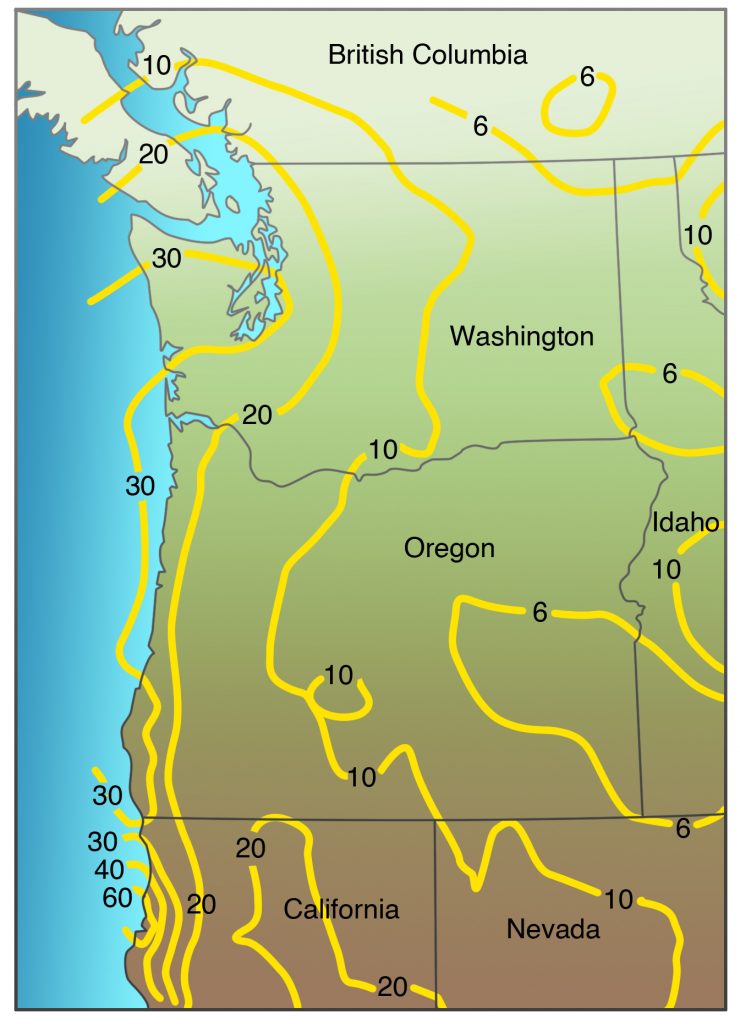
The USGS and the Geological Survey of Canada have combined all of these factors to produce maps showing peak horizontal accelerations over the next fifty years. One of these maps, revised in October 2002, is shown as Figure 8-3. The highest accelerations are forecast along the coast, closest to the subduction zone, with the highest values in northern California, which has the highest seismicity in the Northwest. However, other structures, particularly those that have ruptured historically, also affect the predicted accelerations. The 30 percent g contour curves east to include the Puget Sound region to take into account the slab earthquakes that have done so much damage there.
This map is probabilistic, but it estimates probability of acceleration, not magnitude, because acceleration is the value that is of most importance to engineers in evaluating seismic hazard and designing building codes. For example, the Seattle-Tacoma area has a 10 percent probability that an acceleration close to 30 percent g will be exceeded in the next fifty years. This acceleration will produce intensities of VII-VIII, which did major damage in the earthquakes of 1949, 1965, and 2001. The building you are constructing is likely to have a lifetime of at least fifty years. If there is one chance out of ten that the building will be subjected to these accelerations, doesn’t it make sense to design the building accordingly?
3. Liquefaction: When the Earth Turns to Soup
Robert D. Norris of the USGS was driving on Harbor Island in the industrial area of Seattle when the Nisqually Earthquake hit. His truck was yawing from side to side, and he stopped to watch a dozen giant cargo cranes quivering and flexing, like nodding giraffes trying to dance. What followed next was reported by him in Washington Geology:
I was distracted by a wet swishing sound coming from the ground nearby. I looked over to its source and saw a smooth dome of brown fluid, perhaps half a meter … wide and high, issuing from the ground. … This dome lasted perhaps two seconds, then grew and burst into a muddy geyser. The geyser issued three or four very fluid splashes over the next few seconds … then it widened and collapsed into a column about a half meter wide that discharged a tremendous volume of muddy water. The fluid emerged much faster than it could spread, so that within a few seconds the flow front had become a surge several centimeters high, like a small wave traveling up a dry beach. Its velocity was nearly one meter (yard) per second as far as I could tell. Within an estimated 30 seconds, the surge had grown into a shallow rotating pool about six or seven meters … across with bits of suds floating on it, still vigorously fed by the column of water at the original breakout site. … The feeder column began to gradually wane after a couple of minutes. I … was surprised to find the water was relatively clear; I could see to a depth of several centimeters in the pond.
Soft, unconsolidated sand deposits saturated with water can change from a solid to a liquid when shaken. You can observe this property in wet beach sand. Just tap-tap-tap your foot on the saturated sand at the water’s edge. The sand will first start to bubble and eject a mixture of sand and water. Then the saturated sand from which the bubbles are emanating will flow downslope toward the sea.
Liquefaction is defined as “the act or process transforming any substance into a liquid.” If you have the misfortune of building a house on liquefiable sediment, and an earthquake strikes, your house might sink into the ground at a crazy angle as the sediment liquefies and turns into quicksand. Liquefaction is especially common in clean, loose sand, or gravelly sand saturated with water. Most sand layers with liquefaction potential are Holocene in age (less than ten thousand years old) and are unconsolidated.
Sands that are subject to liquefaction are almost always buried to depths of less than thirty feet. At greater depths, the burial pressure is high enough to compact the sand and prevent liquefaction from taking place, unless the shaking is extremely severe. When earthquake waves shake the sand, the pressure of the waves deforms and compresses the sand for an instant, raising the water pressure in the pore spaces between sand grains, thereby turning the sand-water mixture into a liquid. This temporary overpressuring (cyclic shear stress or cyclic loading) is repeated as long as strong shaking takes place. Such sand is generally overlain by a more cohesive material such as clay, soil, or pavement, which serves to confine the compressed water in the sand. If the sediment layer is on a slight slope, it will move downslope en masse; this is called a lateral spread. A lateral spread can move down a slope as low as 0.2 percent, which would hardly appear as a slope at all.
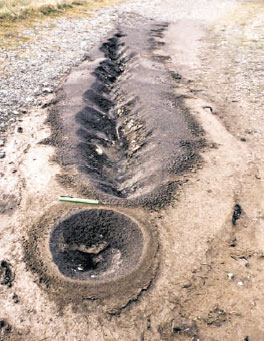
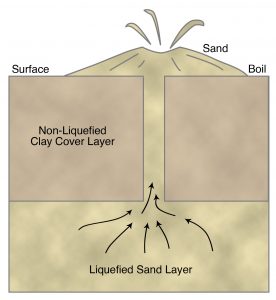
Perhaps the most spectacular expression of liquefaction, as observed by Norris on Harbor Island, occurs when watery sand vents to the surface through a clay cap or pavement, where it can spout up in the air like a fountain or geyser for minutes to hours after the main shock, leaving a low crater or mound (sand boil) after the fountain has died down (Figure 8-4). Excavation of sand boils by a backhoe or bulldozer reveals a vertical filling of sand within the clay cap, called a sand dike (Figure 8-5). The sand dike marks the place where sand at depth has vented to the surface. The presence of sand dikes in sediments, for example those found in an excavation beneath the Oregon Convention Center in Portland, is used as evidence for prehistoric earthquakes, although an alternate hypothesis holds that the sand dikes are related to the Missoula Floods of latest Pleistocene age.
The liquefaction susceptibility of sand can be determined by standard geotechnical engineering tests such as the Standard Penetration Test. During this test, a sampling tube is driven into the ground by dropping a 140-pound weight from a height of thirty inches (okay, it isn’t rocket science, but it works because every foundation engineer does it exactly the same way). The penetration resistance is the number of blows (number of times the weight is dropped) it takes to drive the sampler one foot into the soil. A low penetration resistance would be fewer than ten blows per foot; a high resistance would be greater than thirty blows per foot. Liquefiable sands have a very low penetration resistance; it’s very easy to drive the sampling tube into the sand.
Liquefaction can be triggered by earthquake accelerations as low as 0.1g. It has been observed with earthquakes with magnitudes as low as 5, and it becomes relatively common with larger magnitudes. Liquefaction is more extensive with a longer duration of shaking, which is itself related to large moment magnitude.
Much of the severe damage in the Marina District of San Francisco during the 1989 earthquake was due to liquefaction of the artificial fill that had been emplaced after the 1906 earthquake. Sand boils erupted into townhouse basements, streets, yards, and parks. Lateral spreading of the ground surface broke underground utility lines, leaving about a thousand homes without gas or water. The gas was not shut off, and the broken gas lines caused large fires to break out.
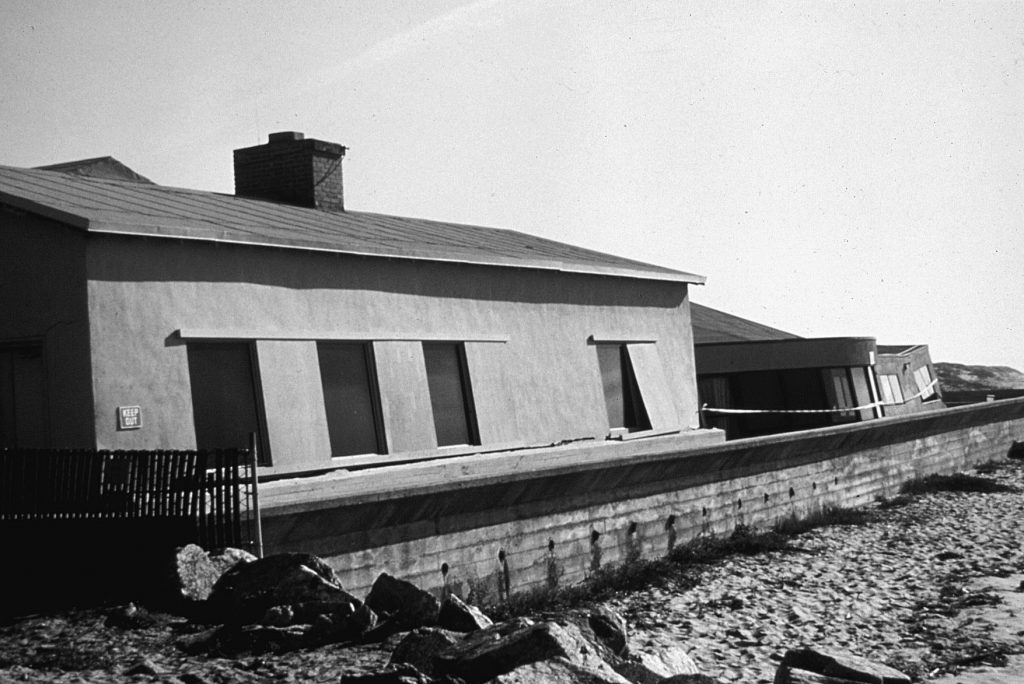
Liquefaction of beach deposits during the 1989 earthquake severely damaged the San Jose State University Marine Laboratory at Moss Landing (Figure 8-6). This illustrates the problem for cities like Seaside, Oregon, and Long Beach, Washington, built on sand bars.
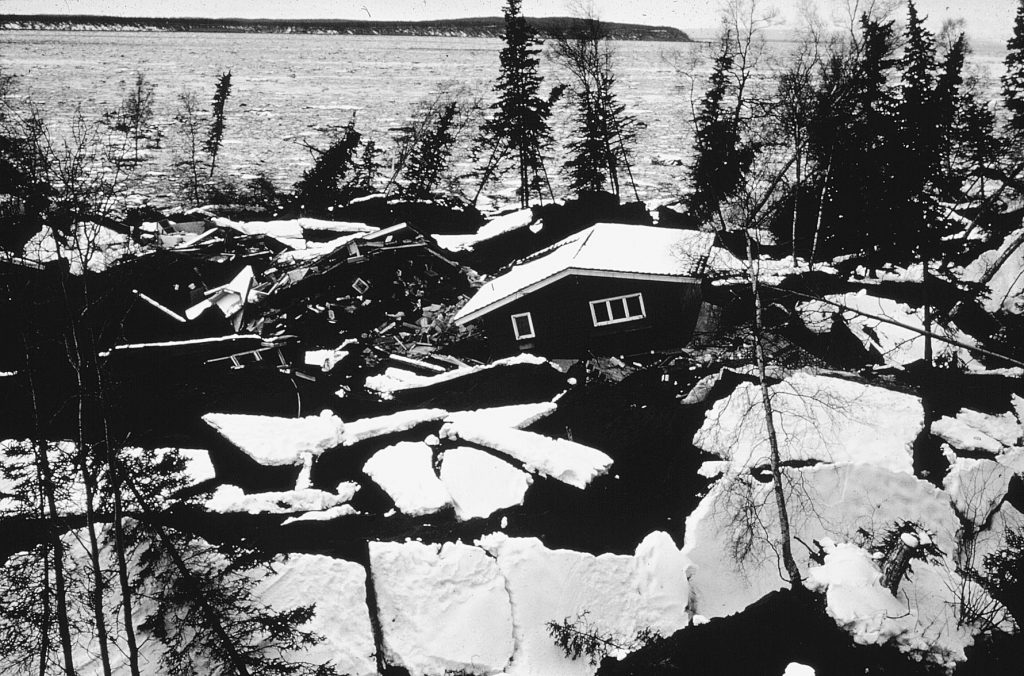
Liquefaction during the Good Friday Earthquake of 1964 in Alaska destroyed part of the new Turnagain Heights subdivision of Anchorage, situated on a thirty-foot bluff overlooking Cook Inlet (Figure 8-7). Earthquake waves liquefied a layer of sand and clay, causing part of the subdivision to break up and slide toward the bay. Homes, patios, streets, and trees tilted at weird angles, and gaping chasms opened, swallowing up and burying alive two small children. One house slid more than twelve hundred feet toward the sea, destroying itself as it did so. The instability of the water-saturated layer within the Bootlegger Cove Clay had been pointed out in a report by the USGS in 1959, five years before the earthquake, but this information evidently had no influence on development plans for Turnagain Heights.
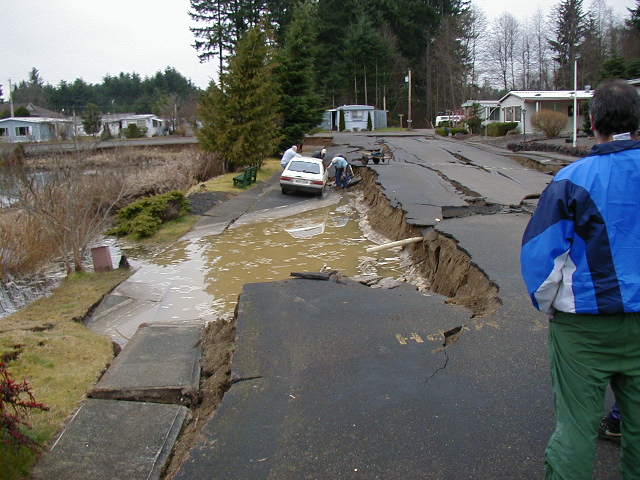
During the Puget Sound earthquakes of 1949 and 1965, 25 percent of the damage may have been caused by liquefaction. Drawbridges across the Duwamish Waterway in Seattle were disabled during both earthquakes. The distance between the piers in the main span of the Spokane Street Bridge was shortened by six to eight inches due to a lateral spread, jamming the drawbridge in the closed position. Geysers of sandy water were reported in 1949 at Longview, Centralia, Puyallup, and Seattle, and a large part of a sandy spit jutting into Puget Sound north of Olympia disappeared in 1949, probably due to liquefaction of the sand. Sediments beneath a mobile home park at Tumwater, Washington, liquefied during the Nisqually Earthquake, as they had in the earlier 1949 and 1965 earthquakes (Figure 8-8). Severe liquefaction also occurred in the delta of the Nisqually River east of Olympia (Figure 8-4), but much of that area is a wildlife refuge, an appropriate use for this unstable ground.
One of the arguments raised against a seismic origin of the buried marsh deposits on the Pacific coast is the rarity of liquefaction features such as sand dikes. However, many of these marshes are not underlain by clean sand. Pleistocene beach sand may underlie the Holocene marsh sequences, but if so, it is probably too consolidated and too deeply buried to undergo liquefaction.
On the other hand, liquefaction features are common on low islands in the tidal reaches of the Columbia River between Astoria, Oregon, and Kalama, Washington (Figure 8-9). These islands are flat, poorly drained, and swampy, and large parts of them are submerged during very high tides. Steve Obermeier of the USGS examined steep banks sculpted by the river and found that the islands are composed mainly of soft clay-rich silt, locally containing volcanic ash layers from Mt. St. Helens. Radiocarbon dating and correlation of the ash to a dated Mt. St. Helens ash indicate that the silt is less than one thousand years old.
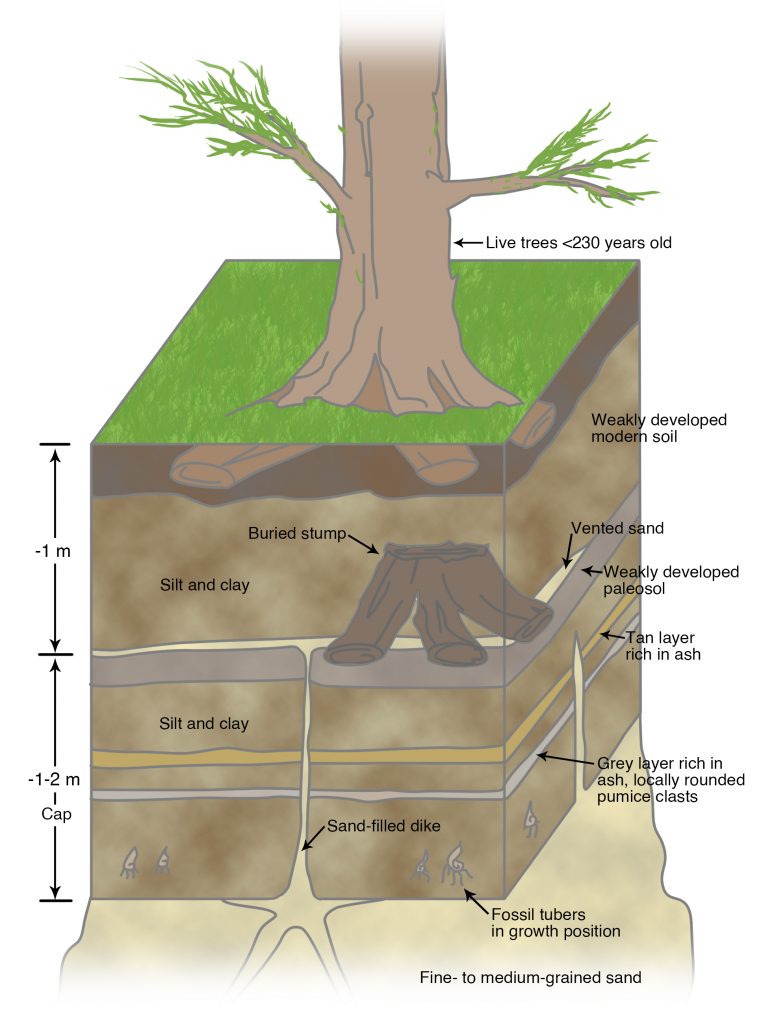
The silt layers are cut by hundreds of sand dikes (Figure 8-9), widest on islands near Astoria, and progressively narrower on islands upriver. These sand dikes were emplaced prior to the oldest trees now found on the islands, which are less than two hundred and thirty years old based on tree-ring dating. For this reason, Obermeier suggests that the dikes were probably emplaced during the great Cascadia Subduction Zone Earthquake of A.D. 1700. The dikes are present in the islands of the Columbia River because a source of river sand may lie just below the silt layer.
Curt Peterson of Portland State University has found that the late Pleistocene marine terrace deposits of the coast between central Washington and northern California contain abundant dikes, some as thick as three feet, evidence for strong earthquake shaking. The source for these dikes is the beach sand marking the base of the terrace. As stated earlier, nearly all examples of liquefaction during historical and late Holocene times involve sand sources that are Holocene in age, not Pleistocene. The sand dikes in the Pleistocene terrace deposits must have been generated by Pleistocene subduction-zone earthquakes, slightly younger than the terrace material in which they are found.
The potential for liquefaction can be reduced by various foundation-engineering techniques to strengthen the soil. These techniques include driving deep piles or piers through the liquefiable layer, emplacing concrete grout through weak layers, or even replacing liquefiable sediments with earth materials not subject to liquefaction. Sloping areas with a potential for lateral spread can be buttressed in the downslope direction. Such solutions are expensive, but they were shown to work during the Loma Prieta Earthquake of 1989. The Marina District suffered greatly from liquefaction, but sites in the San Francisco Bay Area that had received foundation-engineering treatment, including Treasure Island, Emeryville, Richmond, Union City, and South San Francisco, had little or no damage to the ground or to structures.
4. Landslides Generated by Earthquakes
Liquefaction tends to be most pronounced in low, flat areas underlain by Holocene deposits. But in earthquake country, it does not help to escape to the hills. Most of the thousands of landslides generated during a major earthquake are small, but some are very large, as described previously for the 1970 earthquake in Peru.
On July 10, 1958, as reported by George Plafker of USGS, an earthquake of M 7.9 on the Fairweather Fault, Alaska, triggered a landslide on the side of a mountain overlooking Lituya Bay, in Glacier Bay National Park. A great mass of soil and rock swept down the mountainside into the bay, crossed the bay, and had enough momentum to ride up the opposite side to a height of nine hundred feet, denuding the forest cover as it did so. The slide created a huge water wave one hundred feet high that swept seaward, carrying three fishing boats over the sand spit at the mouth of the bay into the ocean. An earthquake of M 7.6 on August 18, 1959, in Montana, just north of Yellowstone National Park, triggered a landslide that swept down a mountainside and through a campground, burying a number of campers together with their tents and vehicles. The landslide crossed the Madison River with enough momentum that it continued up the other side of the valley, damming the river and creating a new lake.
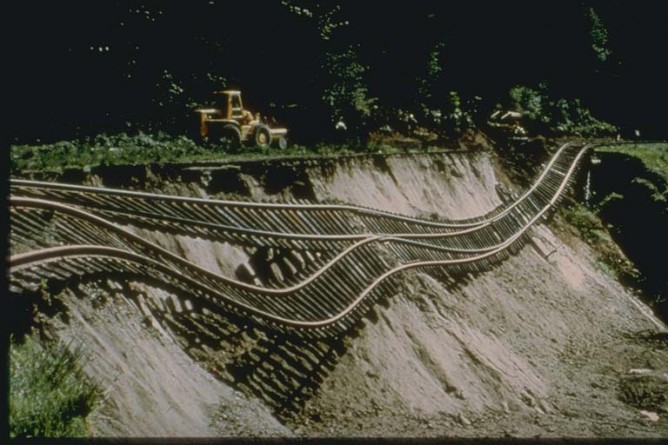
Earthquakes less than M 5.5 generate dozens of landslides, and earthquakes greater than M 8 generate thousands. The Northridge Earthquake triggered more than eleven thousand landslides, mostly in the mountains adjacent to the epicenter. The Puget Sound earthquakes of 1949 and 1965 triggered many landslides, including one that dislodged a railroad track near Tumwater, Washington (Figure 8-10). Landslides are particularly common in heavily forested areas of the Northwest, triggered by rainfall and by earthquakes.
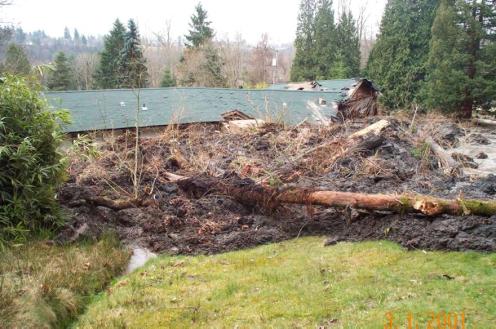
Paula Vandorssen of Renton, Washington, had been on the telephone when the Nisqually Earthquake hit. She quickly became aware that a massive wall of earth was pressing against the side of her house. Within a matter of seconds, mud and debris filled her living room. Paula stumbled onto her front porch and rolled down the hill as the slide pushed her house sideways. It was not quite eleven o’clock; a few minutes later, her five-year-old daughter would have been home, playing on the side of the house smashed by the slide. Other parts of the slide dammed the Cedar River (Figure 8-11), and more than one hundred families were evacuated as a lake began to form. Earth-moving equipment was quickly brought in to breach the mud dam.
Salmon Beach lies along a bluff overlooking Puget Sound south of Point Defiance in Tacoma (Figure 8-12a, b). Its houses, with their magnificent views of the Sound and the Olympics, can be reached only by boat or by descending several hundred wooden steps from the road. The Nisqually Earthquake dislodged up to twenty thousand cubic feet of soil and debris; one large fir tree was pointed like a lance at the window of Luke and Alisa Xitco’s eighteen-month-old 4,600-square-foot cedar shake house. Eight houses were evacuated, several with serious damage. Luke Xitco declared that he was staying.
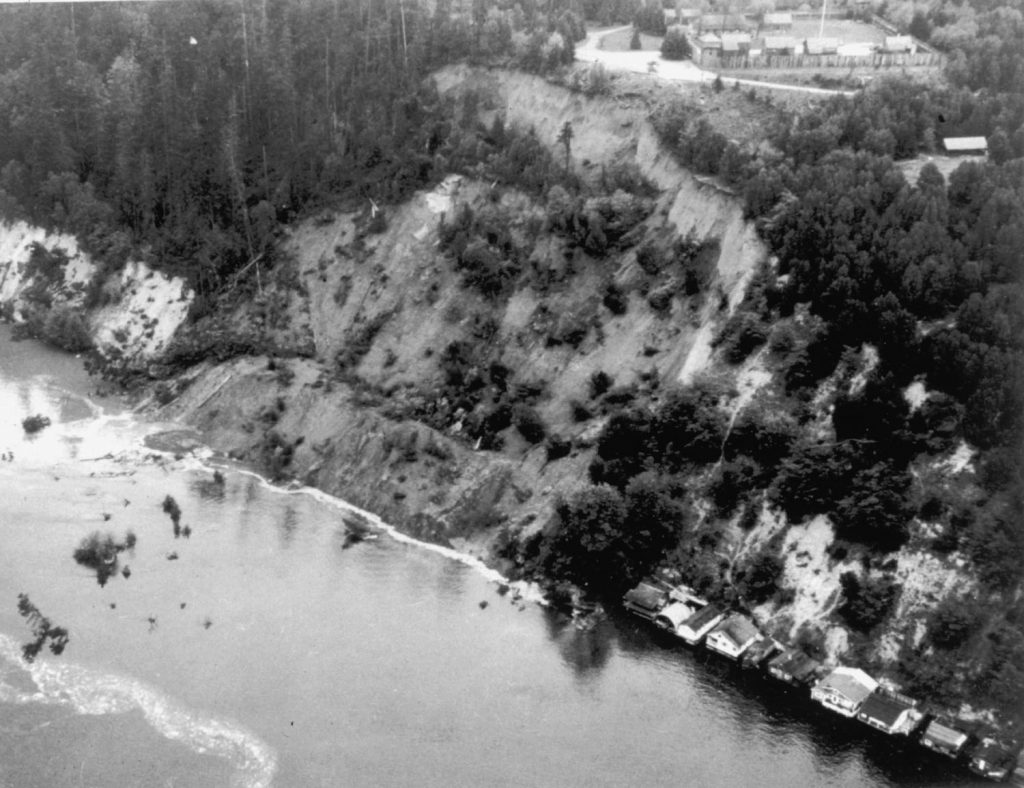
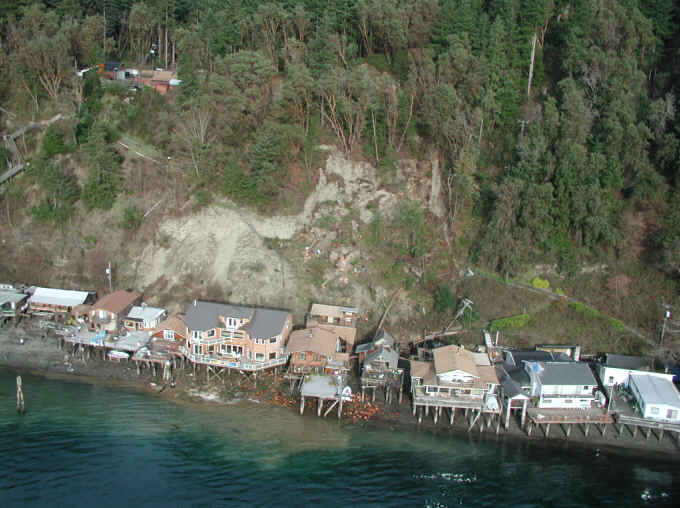
The Nisqually earthquake was not the first to heavily damage the homes at Salmon Beach. Similar damage was experienced during the earthquake of 1949 (Figure 8-12a).
Fourteen homes on a bluff overlooking Puget Sound on Maplewood Avenue Southwest in Burien had to be evacuated (Figure 8-12b) after the Nisqually Earthquake when a foot-wide moat appeared between the road and the driveways. Other homes along the beach below were also evacuated, though some residents stayed despite the evacuation order.
In addition to railroad damage (Figure 8-10), highways were also put out of service, as illustrated by Figure 8-13. Damage to highways caused delays in rescue operations and repair of damaged homes.
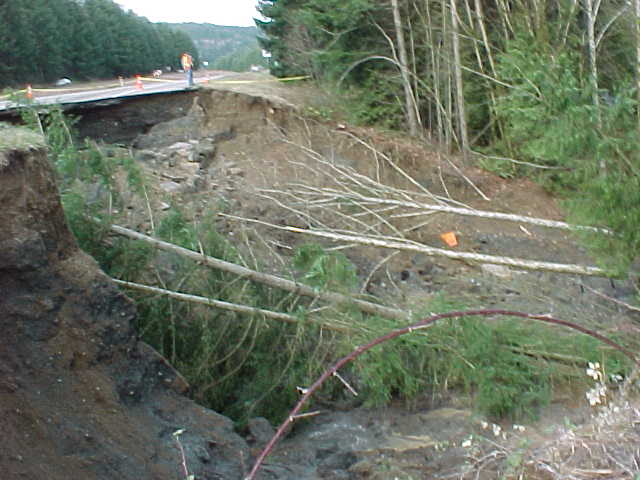
Some of the most common landslide types are rockfalls and rockslides. Although rockfalls might have a nonseismic origin, Bob Schuster of the USGS found that large rockfalls damming lakes on the eastern Olympic Peninsula of Washington (Figure 6-7) were most likely formed during a large earthquake eleven hundred years ago. No rockfalls as large as these are known from this area in historic time, which included earthquakes as large as M 7.1 as well as many severe winter storms.
Anyone who has hiked in the mountains has observed that many rocky talus slopes appear to be quite precarious, and seismic shaking can set these slopes in motion. John Muir, who experienced the 1872 Owens Valley Earthquake (M 7.7) in Yosemite Valley, described it best:
At half-past two o’clock of a moonlit morning in March, I was awakened by a tremendous earthquake, and though I had never before enjoyed a storm of this sort, the strange thrilling motion could not be mistaken, and I ran out of my cabin, both glad and frightened, shouting, “A noble earthquake! A noble earthquake!” feeling sure I was going to learn something. The shocks were so violent and varied, and succeeding one another so closely, that I had to balance myself carefully in walking as if on the deck of a ship among waves, and it seemed impossible that the high cliffs of the Valley could escape being shattered. In particular, I feared that the sheer-fronted Sentinel Rock, towering above my cabin, would be shaken down, and I took shelter back of a large yellow pine, hoping that it might protect me from at least the smaller outbounding boulders. For a minute or two the shocks became more and more violent—flashing horizontal thrusts mixed with a few twists and battering, explosive, upheaving jolts,—as if Nature were wrecking her Yosemite temple, and getting ready to build a still better one.
I was now convinced before a single boulder had fallen that earthquakes were the talus-makers and positive proof soon came. It was a calm moonlight night, and no sound was heard for the first minute or so, save low, muffled, underground, bubbling rumblings, and the whispering and rustling of the agitated trees, as if Nature were holding her breath. Then, suddenly, out of the strange silence and strange motion there came a tremendous roar. The Eagle Rock on the south wall, about a half a mile up the Valley, gave way and I saw it falling in thousands of the great boulders I had so long been studying, pouring to the Valley floor in a free curve luminous from friction, making a terribly sublime spectacle—an arc of glowing, passionate fire, fifteen hundred feet span, as true in form and as serene in beauty as a rainbow in the midst of the stupendous, roaring rock-storm. The sound was so tremendously deep and broad and earnest, the whole earth like a living creature seemed to have at last found a voice and to be calling to her sister planets. In trying to tell something of the size of this awful sound it seems to me that if all the thunder of all the storms I had ever heard were condensed into one roar it would not equal this rock-roar at the birth of a mountain talus.
The great landslides of Peru, Madison River, and Lituya Bay were rock avalanches, generally triggered by rockfalls at the time of the earthquake. Nearly all rockfalls are small, although locally damaging or deadly, like the one that killed Ken Campbell north of Klamath Falls, Oregon (Figure 6-24), and many have nonseismic origins like the Oso, Washington, landslide of March 2014. However, great rock avalanches seem to be unique to earthquakes, or earthquakes combined with volcanism, as in the huge avalanche that crashed into Spirit Lake and blocked the Toutle River during the Mt. St. Helens eruption of May 18, 1980. That avalanche was triggered by an earthquake of M 5.1, but both the avalanche and the earthquake might have been an effect of the eruption, which blew out the north side of the mountain.
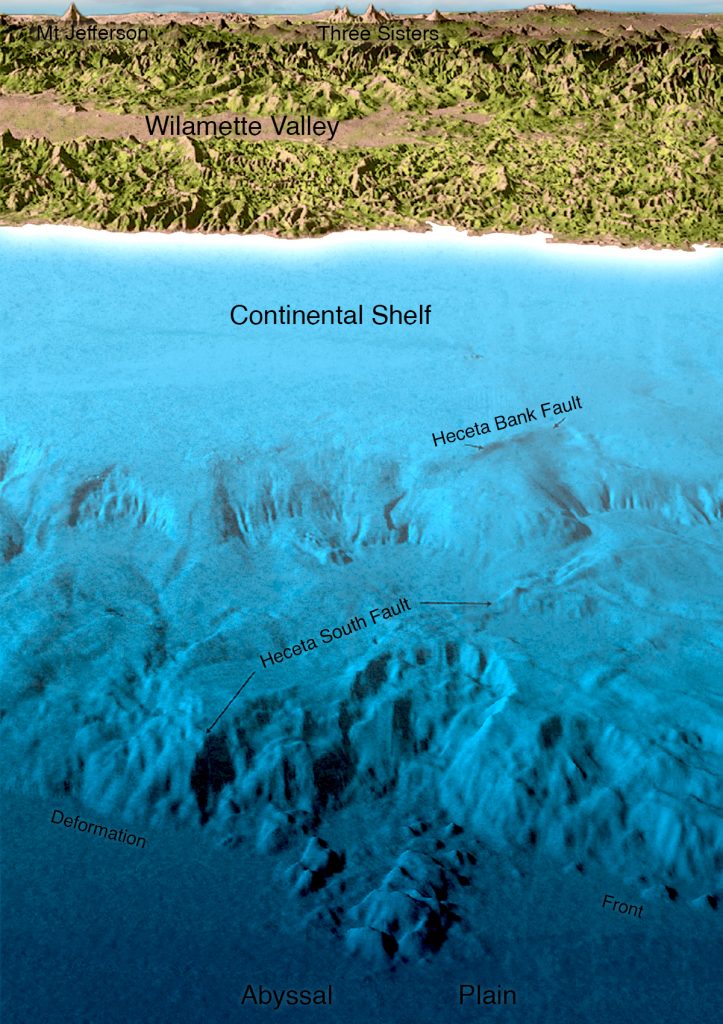
Landslides on the sea floor are an increasingly recognized phenomenon, principally because of the availability of side-scan sonar and new methods to map the topography of the sea floor. The continental slope off southern Oregon is largely composed of huge landslides, including the one illustrated in Figure 8-14 off Florence, Oregon. Chris Goldfinger mapped a landslide at the base of the continental slope off central Washington in which individual mountain-size blocks rode down onto the abyssal plain, leaving skid marks on the sea floor in their wake. These landslides are so large that it seems likely that they would generate huge sea waves, or tsunamis, as similar landslides have been shown to do on Hawaii and Papua New Guinea.
The Coast Range, Olympic Mountains, and the Cascades bear the scars of thousands of landslides that have been mapped by geologists. It cannot be demonstrated conclusively that these landslides have an earthquake origin, but certainly many of them do. Some of the smaller ones are slides or flows of soil material, which tend to be tongue shaped or teardrop shaped and to travel down gullies and steep canyons. Many of these form during a wet winter and are unrelated to earthquakes. David Keefer and Randy Jibson of the USGS summarize geotechnical evidence that suggests that some slides would not have been generated by wet weather during winter storms alone but would require seismic shaking to be set in motion. Geotechnical tests, such as the Standard Penetration Test, can be done in an evaluation of a building site on a hillside. Other geotechnical tests include measuring the shear strength of soils under both static (nonearthquake) and dynamic (earthquake) conditions.
The hills bordering the Willamette Valley contain numerous landslide deposits, particularly the West Hills of Portland. The Oregon Department of Geology and Mineral Industries has mapped these landslides using LiDAR, the same method used to map active faults in the Puget Sound region. Most of the Willamette Valley is covered by LiDAR, enabling landslides to be mapped. Most of Portland is covered with LiDAR-based maps locating these landslides. In my view, due diligence by local government would require these governments to obtain LiDAR maps of their growing cities so that future development can be planned accordingly.
Two large Pacific Northwest landslides may not have had an earthquake origin. The Hope, B. C., landslide of 1965 was associated with an earthquake, but some people believe that the earthquake may have accompanied initial rupture of the shear surface marking the base of the landslide, and was not the cause of the slide. The Ribbon Cliffs rockslide, on the Columbia River north of Wenatchee, Washington, was reactivated by a large earthquake in 1872, as discussed in Chapter 6. Without direct observation, it is difficult to attribute large landslides in mountainous terrain to any earthquake, even when the earthquake occurred in historic time.
I close this section with a discussion of perhaps the most famous landslide in the Pacific Northwest, the Bonneville Landslide on the Columbia River near Cascade Locks (Figure 8-15). Volcanic rocks have been transported downslope on a thin sticky clay soil formed on top of one of the volcanic formations, forcing the Columbia River to its south bank and narrowing its width by half. The landslide has an area of at least thirteen square miles. It may have given rise to a Native American legend concerning the origin of the Bridge of the Gods. According to legend, the Bridge of the Gods was built by the Great Spirit to allow passage from one side of the river to the other. It was destroyed as a result of a great struggle between warriors now frozen in stone and ice as Mt. Klickitat (Mt. Adams) and Mt. Wyeast (Mt. Hood). A catastrophic landslide in prehistoric times could have dammed the Columbia and allowed people to walk from one side to the other until the river overtopped and cut out the dam. Radiocarbon dating by Pat Pringle, then of the Washington Division of Geology and Earth Resources and Bob Schuster of the USGS shows that this landslide could have come down during the great Cascadia Subduction Zone Earthquake of A.D. 1700.
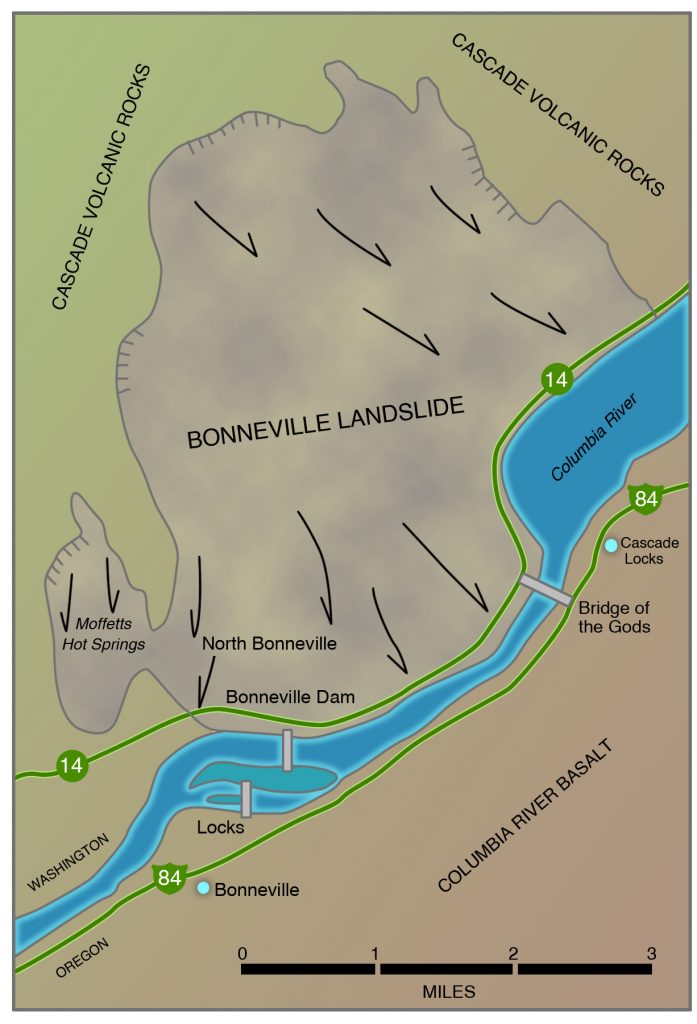
However, there is no direct evidence for an earthquake origin of the slide, and no evidence that the slide came down all at once. Some of the slides coming down to the river from the Washington side are still active today. The Bonneville Landslide and the Bridge of the Gods remain a geological enigma.
As stated in a previous section, landslides are not strictly an earthquake-related phenomenon; they are a common side effect of winter storms as well. In evaluating a site for its landslide potential, Scott Burns of Portland State University uses a three-strike rule. Strike 1 is unstable soil, and strike 2 is a steep slope. Strike 3 may be either an earthquake or a heavy winter rainstorm that saturates the ground. By careful selection of building sites, strikes 1 and 2 can be avoided, so that neither rainfall nor earthquake will cause a landslide.
Much of the loss of life related to an earthquake is caused by landslides. In some cases, the slide mass moves slowly enough that people can get out of its way, but in rockfalls and rock avalanches, such as the large slides in Alaska, Peru, and Montana, and the rockfall witnessed by John Muir at Yosemite, the motion of the rock and soil mass is so quick that people are overwhelmed before they have an opportunity to get out of the way. This caused the loss of life from the Oso, Washington, landslide of March 2014.
5. Earthquake Hazard Maps of Metropolitan Areas
The Oregon Department of Geology and Mineral Industries has prepared maps of the Portland, Salem, and Eugene metropolitan areas that classify the urbanized areas into earthquake hazard zones. The information discussed earlier in this chapter has been used to make the maps: the bedrock geology, the thickness, density, and seismic shear-wave (S-wave) velocity of near-surface sediment, the steepness of slopes in hillside areas, and the degree of susceptibility of those slopes to landsliding. The hazards measured are the amount of seismic wave amplification, the potential for liquefaction, and the tendency of hillslopes to fail in landslides.
The maps divide the area underlain by Quaternary sediment into three (for Portland) to five (for Salem) hazard categories of ground-shaking amplification based on sediment thickness and S-wave velocity. Areas underlain by bedrock do not amplify seismic waves. Similarly, there are three to five categories of liquefaction potential of surficial sediment, with no liquefaction potential for areas underlain by bedrock. Classification of slope stability is based on steepness of slope ranging from no hazard where the land is flat to a high hazard where the slope exceeds twenty-two degrees, with a special category for hillsides already marked by landslides.
Maps of individual hazards (seismic shaking, liquefaction, and slope stability against landsliding) are combined, using a computer model, to subdivide each area into four earthquake hazard zones, with A marking the highest hazard zone and D the lowest. An A ranking generally means that the area has ranked high in at least two of the three hazards described (seismic shaking, liquefaction, slope stability). An area could rank very high in one category and low in all others and receive a B ranking. The map can be used to state that a broad area such as Portland International Airport has a particular level of hazard (Zone B). The Oregon State Capitol and Willamette University are ranked Zone C. The maps are detailed enough that you could get an idea of the earthquake hazard category for your own home, if you live in one of the areas covered by the maps.
The maps are designed for general planning purposes for designing earthquake hazard mitigation programs for Oregon’s major cities. Damage estimates for lifeline services and disaster-response planning could effectively be based on these maps. However, they are not a substitute for site-specific evaluations of a building site based on borings and trenches, although they could be used for feasibility studies and for design. Furthermore, no state law requires that these maps be used in land-use policy. However, they could affect earthquake insurance rates.
Although there is no province-wide program for earthquake hazard maps in British Columbia, a demonstration project for the city of Victoria has been completed, in part funded by the city itself. The City of Seattle has produced a set of Sensitive Area Maps showing slopes greater than fifteen degrees that might have a greater potential for landsliding. Similar maps are being constructed by the California Geological Survey for urban areas in southern California. The Seismic Hazard Mapping Act, passed by the California legislature in 1990, requires the State Geologist to identify and map the most prominent earthquake hazards from liquefaction and landsliding. Unlike states in the Northwest, developers and local government are required to consult these maps in land-use decisions.
In Washington, Steve Palmer and his colleagues with the Division of Geology and Earth Resources prepared maps showing liquefaction potential in lowland areas of the Seattle and Olympia urban areas because of the extensive liquefaction accompanying the earthquakes in 1949 and 1965. These maps were tested by the Nisqually Earthquake of 2001. Liquefaction and lateral spreading were concentrated in those areas Palmer and his associates had predicted would be hazardous. The Olympia map is shown as Figure 8-16.
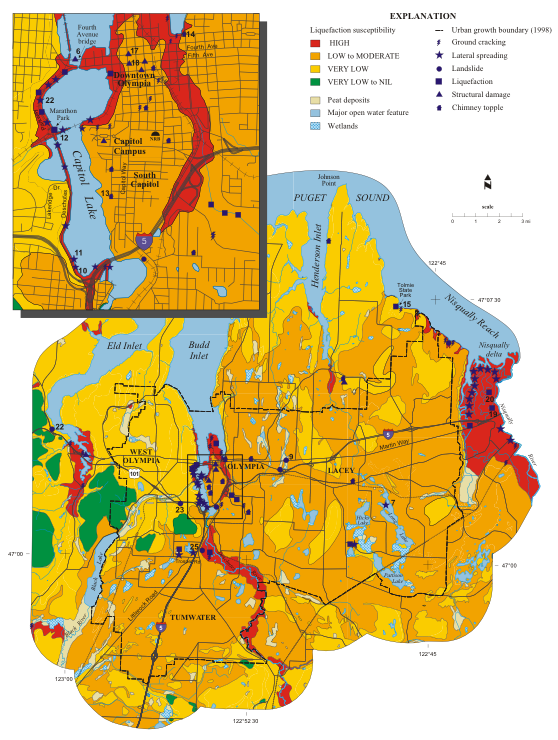
The Nisqually experience showed clearly that these maps can predict successfully those areas where damage will be concentrated in an urban earthquake. However, they have only been earthquake-tested in Washington.
Suggestions for Further Reading
Burns, S. 1998. Landslide hazards in Oregon, in Burns, S., ed., Environmental, Groundwater and Engineering Geology Applications from Oregon. Association of Engineering Geologists Special Pub. 11, Star Publishing Co., 940 Emmett Ave., Belmont, CA 94002, p. 303-15.
Burns, S. 1998. Landslides in the Portland area resulting from the storm of February 1996, in Burns, S., ed., Environmental, Groundwater and Engineering Geology Applications from Oregon. Association of Engineering Geologists Special Pub. 11, Star Publishing Co., 940 Emmett Ave., Belmont, CA 94002, p. 353-65.
Burns, S., and L. Palmer. 1996. Homeowner’s landslide guide. Oregon Emergency Management, Federal Emergency Management Agency Region 10, and Oregon Department of Geology and Mineral Industries, 10p. (free).
Dragovich, J. D., and P. T. Pringle. 1995. Liquefaction susceptibility map of the Sumner 7.5-minute quadrangle, Washington, with a section on liquefaction analysis by Palmer, S.P. Washington Division of Geology and Earth Resources Geologic Map GM-44, 1 sheet, 1:24,000, text 26 p.
Gerstel, W. J., M. J. Brunengo, W. S. Lingley, Jr., R. L. Logan, H. Shipman, and T. J. Walsh. 1997. Puget Sound bluffs: The where, why, and when of landslides following the holiday 1996/97 storms. Washington Geology, v. 25, no. 1, p. 17-31.
Jibson, R. W. 1996. Using landslides for paleoseismic analysis, in McCalpin, J. P., ed., Paleoseismology. San Diego, CA: Academic Press, p. 397-438.
Keefer, D. K. 1984. Landslides caused by earthquakes. Geological Society of America Bulletin, v. 95, p. 406-71.
Keller, E. A. 1988. Environmental Geology, Fifth Edition. Columbus, OH: Merrill Publishing Co., 540 p.
Kramer, S. L. 1996. Geotechnical Earthquake Engineering. Englewood Cliffs, N.J.: Prentice-Hall.
Monahan, P. A., V. M.. Levson, E. J. McQuarrie, S. M. Bean,P. Henderson, and A. Sy. 2000. Relative earthquake hazard map of Greater Victoria showing areas susceptible to amplification of ground motion, liquefaction and earthquake-induced slope instability. British Columbia Geological Survey Map GMOO-1.
Monahan, P. A., V. M. Levson, P. Henderson, and A. Sy. 2000. Relative liquefaction hazard map of Greater Victoria (sheet 3A); relative amplification of ground motion hazard map (sheet 3B); seismic slope stability map (sheet 3C) and accompanying report. British Columbia Geological Survey Maps GMOO-3.
Muir, J. 1912. The Yosemite. The Century Company, republished by Doubleday and Co., Inc., New York.
Obermeier, S. F. 1996. Using liquefaction-induced features for paleoseismic analysis, in McCalpin, J. P., ed., Paleoseismology. San Diego, CA: Academic Press, p. 331-96.
Oregon Department of Geology and Mineral Industries. n.d. Landslides in Oregon. Free circular.
Oregon Department of Geology and Mineral Industries. 1991-1996. Earthquake hazards maps of Portland and Salem metropolitan areas. GMS 79, 89-92, 104-5.
Oregon Department of Geology and Mineral Industries. 1997. Relative earthquake hazard map of the Portland Metro Region, Clackamas, Multnomah, and Washington Counties, Oregon. Interpretive Map Series IMS-1.
Palmer, S .P., H. W. Schasse, and D. K. Norman. 1994. Liquefaction susceptibility for the Des Moines and Renton 7.5-minute qudrangles, Washington. Washington Division of Geology and Earth Resources Geologic Map GM-41, 2 sheets, scale 1:24,000, text 15 p.
Palmer, S. P., T. J. Walsh, R. L. Logan, and W. J. Gerstel. 1995. Liquefaction susceptibility for the Auburn and Poverty Bay 7.5-minute quadrangles, Washington. Washington Division of Geology and Earth Resources Geologic Map GM-43, 2 sheets, scale 1:24,000, text 15 p. Palmer, S .P., T. J.
Walsh, and W. J. Gerstel. 1999. Geologic folio of the Olympia-Lacey-Tumwater urban area, Washington: Liquefaction susceptibility map. Washington Division of Geology and Earth Resources Geologic Map GM-47, text, 16 p.

