Chapter 2: Court Procedures
2.4 An Empirical Examination of the Business of the Montana Supreme Court
William P. McLauchlan
This is a study of the work of one state supreme court. While it cannot be representative of all fifty state courts, examining this court’s work provides insights on various features of the operation of state courts. First, the work of this court certainly reflects the judicial business of this state, unique though that might be. In a study of state politics, the judicial system must be included, and this examination provides an accurate view of the work of that institution. Second, this study provides fodder for comparison with other state courts. Montana’s court is not typical of all state courts, but the findings here perhaps provide a vantage point for examining other state appellate courts. Such comparisons are valuable in understanding the similarities and differences among state judicial systems throughout this country.[1]
Here we use empirical data, specifically data from calendar years 2007 and 2017, to examine the processes the court uses and the nature of its business. This will also explore the results of the court’s work. Examining the work of a court using empirical data provides an accurate and systematic perspective, and this contrasts with treatments that explore individual court decisions (or a set of notable cases). This analysis is an analysis of the institution and its work rather than focusing on a specific doctrine, case, or even individual behavior.
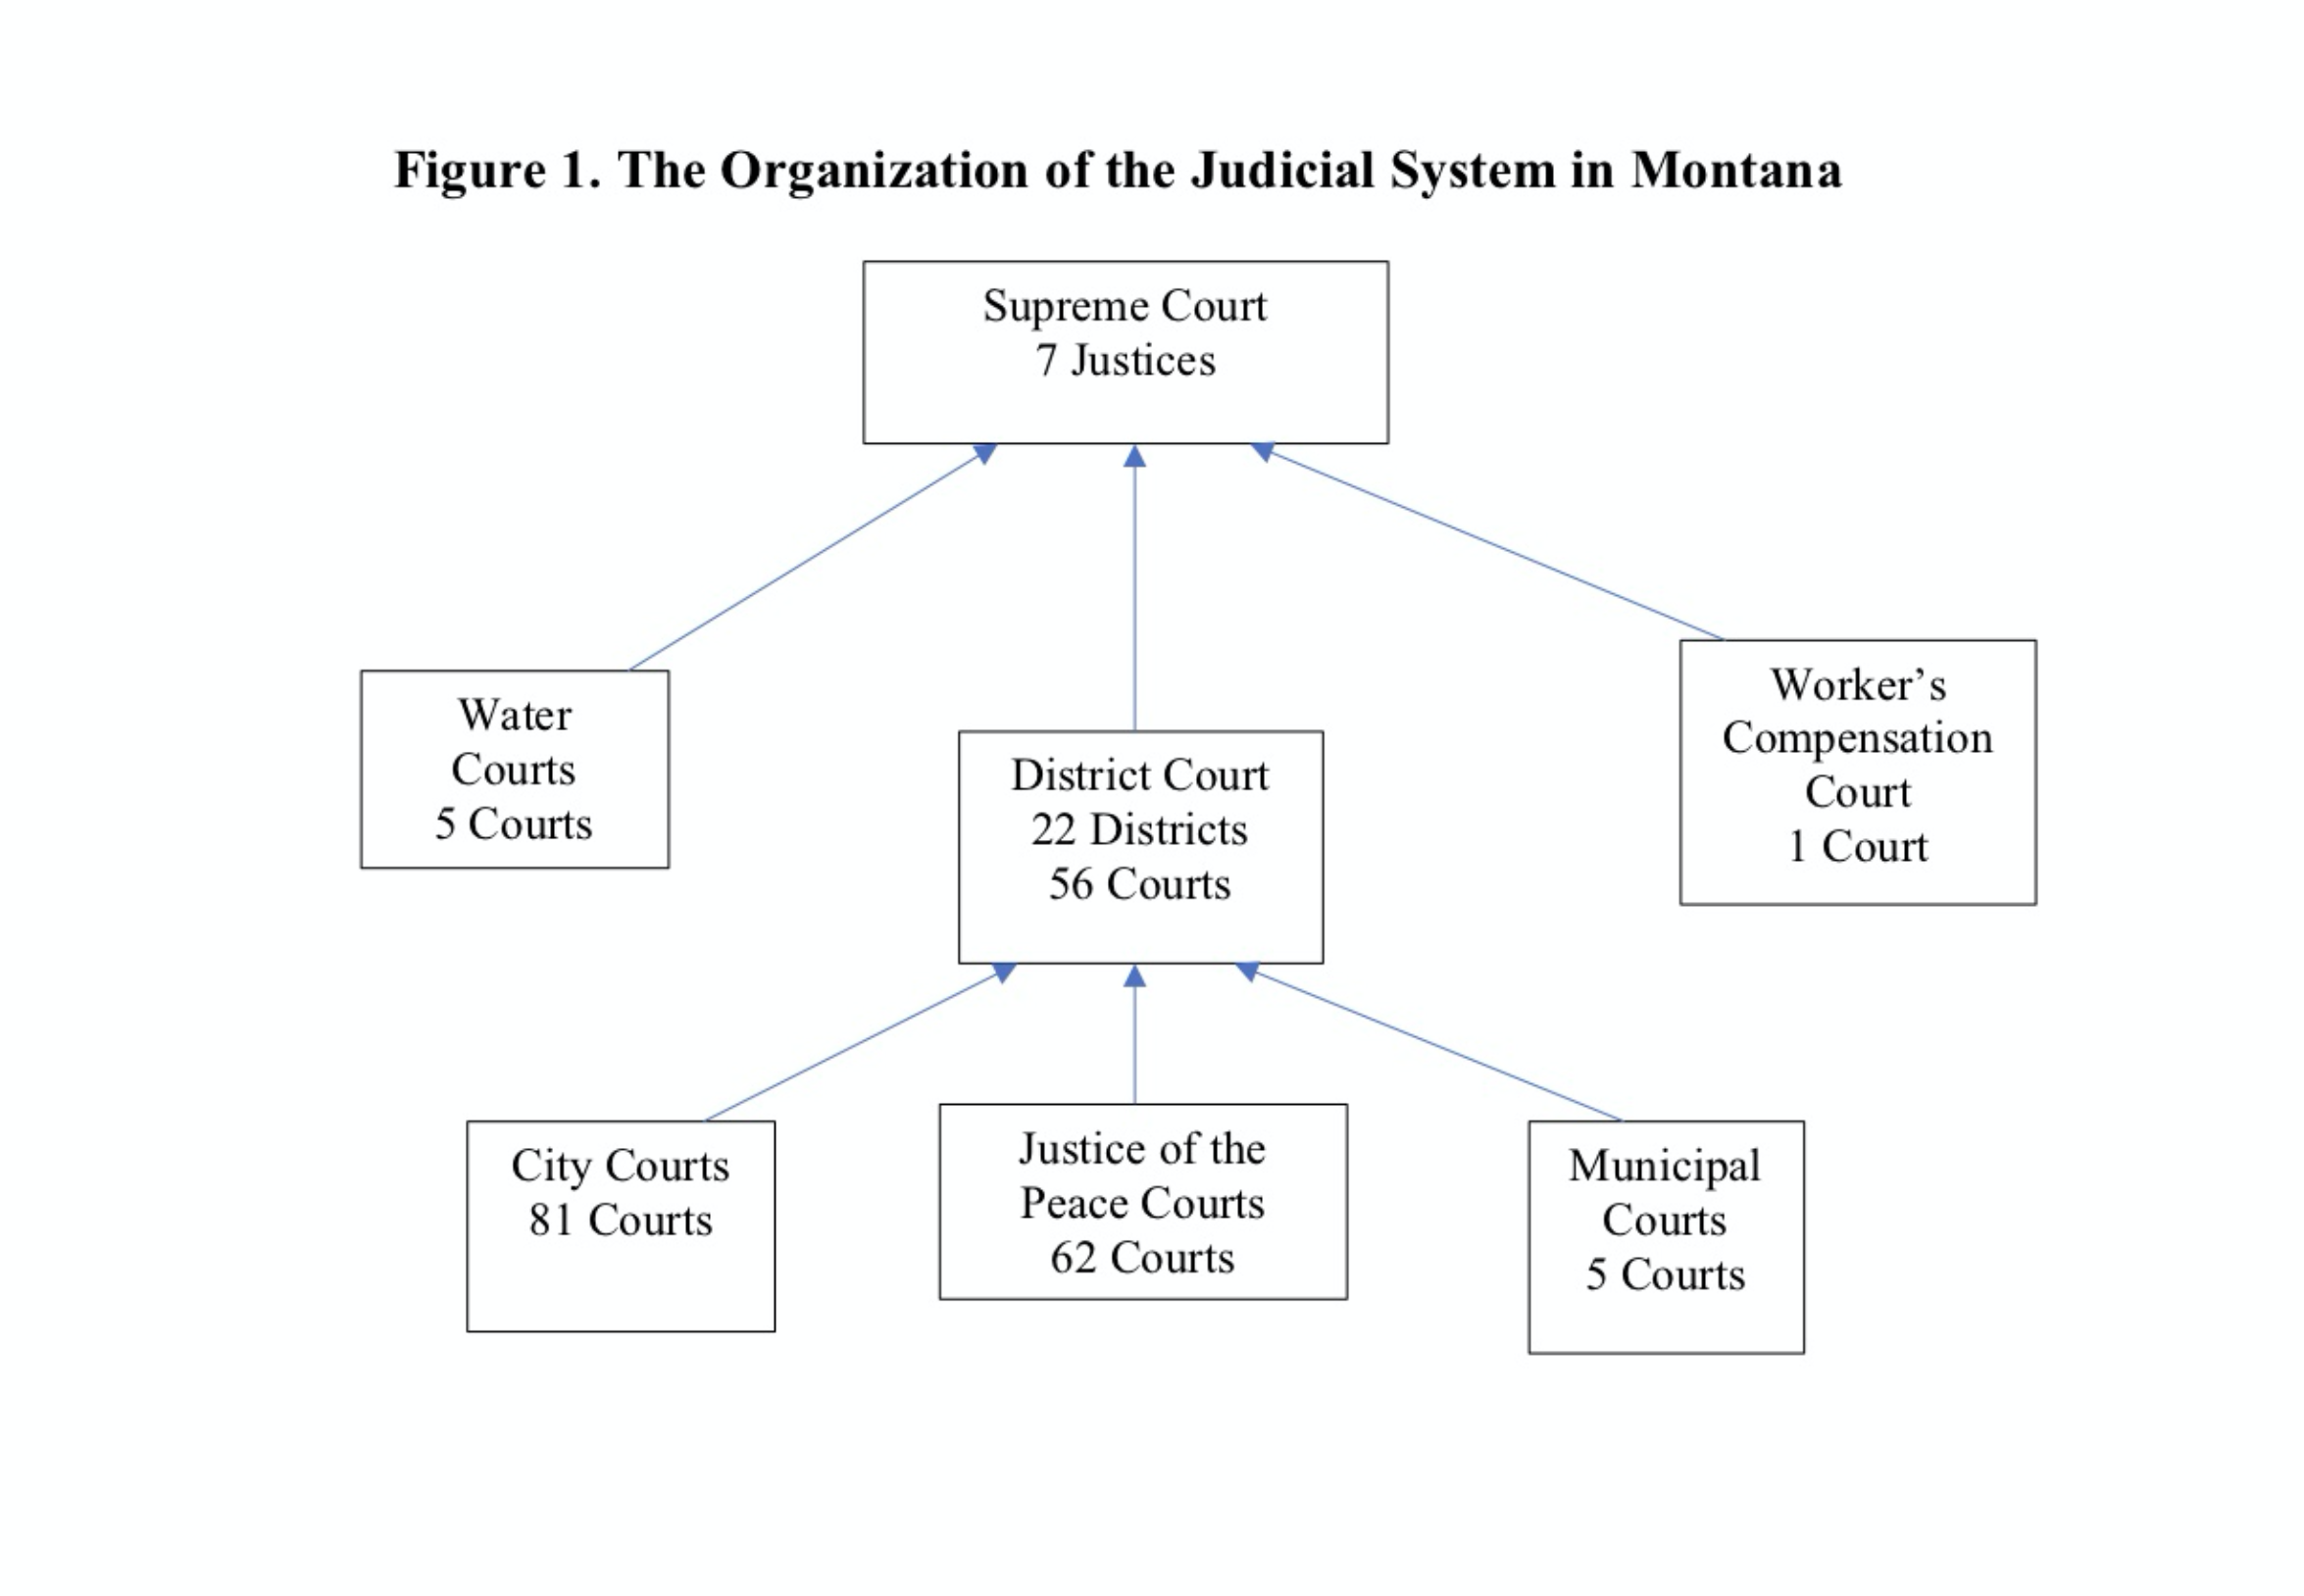
The Montana Supreme Court heads one of a minority of state court systems, since it operates without an intermediate appellate court located above the state’s trial courts.[2] The most important consequence of this feature is that the Montana court must decide all the qualified cases that are appealed to it from the state’s trial courts. The court also has some original jurisdiction that provides additional work for it each year. However, the vast bulk of the court’s work involves appeals that derive from the lower Montana courts.
The current Montana court system originated in the 1972 Montana Constitution. Figure 1 is a simplified diagram of the structure of the Montana judicial system. The constitution created the current two-plus tiered system.[3] The trial courts of general jurisdiction are district courts. Below these twenty-two districts, there are justice of the peace courts in each county. In addition, by statute or local ordinance, there are various state or local courts of limited jurisdiction. The courts of limited jurisdiction deal with the multitude of misdemeanor cases filed in each county. The state supreme court, as provided in the constitution, was composed of a chief justice and four justices. The state legislature added two additional justices to the court so that it is now a seven-member court.[4] That expansion occurred in 1979 as a result of the caseload, or workload, that five justices faced. As explained in section I, the court still operates using various five-justice panels for the bulk of its appellate work due to its current workload.
The discussion that follows is divided into sections. Section I contains a description of the supreme court’s decisional processes. Deciding a large number of appeals requires the court to divide its workload into different categories and apply different processes to these categories. These processes, though elaborate, have been devised to accommodate the array of appeals the court receives and must resolve. Section II outlines the data that were collected and used for this analysis. The section also provides a set of research questions about the court’s operation. The third section is the core of the chapter and presents an empirically based “picture” of the operation of the court, the nature of its appellate business, and how it processes that workload. The last section is a set of conclusions that are derived from the analysis. There are several accompanying appendices.[5]
Supreme Court Processes
The Montana Supreme Court considers two sets of cases: appeals from lower Montana courts and cases filed under the original jurisdiction of the court. The original jurisdiction of the court relates to writs of habeas corpus and to other writs that are authorized by state statute. The original cases constitute about 25 percent of the supreme court’s business in 2017. The bulk of the court’s business is appealed from lower courts, primarily from the district courts. Those are the trial courts of general, original jurisdiction in the state. The court’s appellate jurisdiction extends to all cases in law and equity. The court’s term begins January 1 of each year and extends throughout the calendar year, with only one term each year.[6] The supreme court’s authority also extends to managing the judicial system in the state, setting procedural rules and requirements for court procedures, regulating the practice of law in the state, and setting standards for the professional conduct of lawyers and judges.
The processes the court follows are contained in its internal operating rules (IORs), first adopted in 1995 and amended later. Appeals must be filed within thirty or sixty days of the entry of judgment by the lower court. The deadline depends on whether the state (sixty days) or a private party (thirty days) appeals from the lower court. Once the appeal is filed, the supreme court clerk distributes the documents to the seven justices, and each case is also assigned to a five-justice panel. The panels are devised so that each justice participates in a nearly equal portion of the court’s work, although which cases any given panel receives depends on the order in which an appeal is filed. The statute creating the additional two justice positions specifies that all the decisions of the court must be agreed to or supported by a “majority of the Court.”[7] That obvious requirement does place certain constraints on what a five-justice panel can decide, since a majority of seven is four. That means that to decide a case, four of the five justices on the panel must agree. Figure 2 outlines these general features of the court’s decisional process.
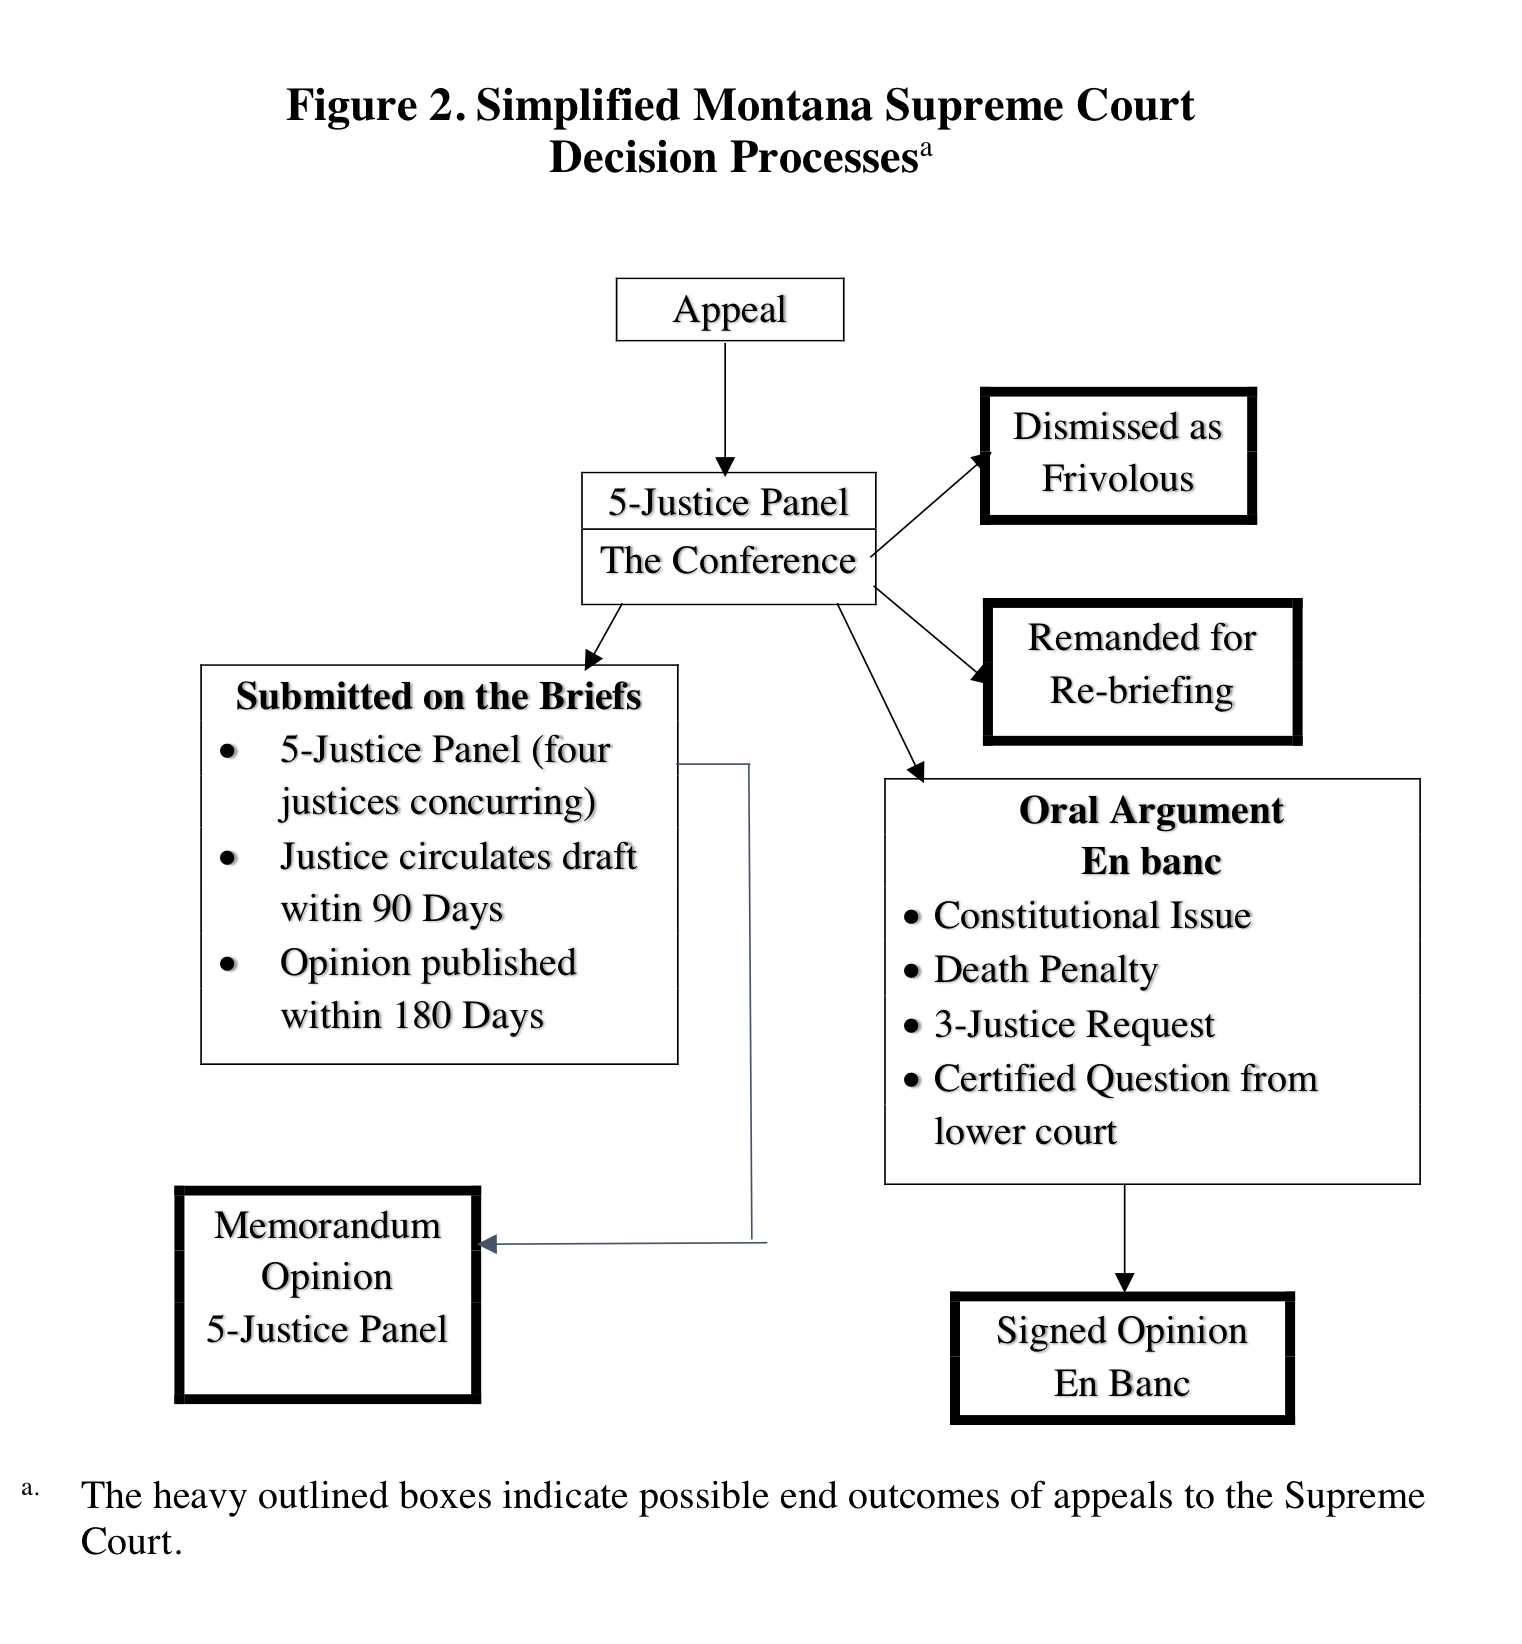
The five-justice panel assigned to an appeal presents that appeal at a Tuesday conference of all seven justices.[8] At that conference, several outcomes can result. First, the case can be dismissed as frivolous or remanded to the attorney filing the appeal. A remand seeks a rebriefing because the conference determines that the appeal is insufficiently briefed. Second, if three justices think it is warranted, the case is scheduled for oral argument before the full seven-member court.[9] Third, the conference can determine that the appeal only warrants a memorandum opinion—that is, the case “presents no constitutional issues, no issues of first impression, does not establish new precedent or modify existing precedent, or, in the opinion of the Court, presents a question controlled by settled law or by the clear application of applicable standards of review.”[10] The result of a memorandum opinion is a decision in the case, but that decision is not useable as precedent in future litigation.
If an appeal does not warrant oral argument and if four members of the five-justice panel agree, the appeal is decided as “submitted on the briefs” after review by the conference. This decision can be either a memorandum opinion or a full opinion by the panel. If three members of the five-justice panel agree on the outcome, the appeal is referred to the conference for consideration and decision by the full court because, as noted above, the law requires that the court’s decisions be made by a majority of the court, not a majority of the five-justice panel. The conference will consider, usually without oral argument, the issues in such cases and render a decision that reflects the judgment of a majority of the seven justices.
The decisional attention of the full seven-member court is only given to a subset of appeals. Those appeals include (1) appeals that cannot be dealt with by memorandum opinions, (2) those cases in which a four-justice majority of the five-justice panels cannot agree, and (3) those cases that are scheduled for oral argument. These decisions are usually based on the filings by the appellant and the respondent. However, in a few cases, one or more amici curiae (friends of the court) submit written materials to support the arguments of one of the parties. The formal conduct of oral arguments is public, conducted either in the courtroom in Helena or in a suitable facility elsewhere in the state. However, given the general features of the court’s business, which are noted below, the seven-justice conference or en banc proceedings cannot (and does not) absorb a majority of the court’s attention. The fact that the court has mandatory appellate jurisdiction in all cases means that there are too many appeals for the seven-justice court to be the standard operating procedures for the court.
This brief outline of decisional processes is enough to generate a variety of descriptive questions that data could be used to answer. These data are the published materials issued by the court in 2007 and 2017. These two years provide a comparison of the court’s work a decade apart. This comparison might show changes in the nature of the court’s business or changes in the decisions of the court. This minimal longitudinal study will outline and perhaps answer the following questions:
- What is the aggregate volume of the court’s appeals?
- Where do these cases come from?
- What kinds of appellants bring the appeals to the court?
- What kinds of cases/questions are appealed?
- How are those appeals disposed of by the court?
- What was the vote in the decisions?
- Which justices wrote the opinions in the appeals?
- How long does it take the court to render decisions?
- Have there been appreciable changes in any of these metrics during the decade interval?
While these queries are descriptive, we currently do not have good answers to these questions for the Montana Supreme Court. An understanding of the kinds of cases, the kinds of appellants, and the kinds of results rendered by the court will illuminate its business. These initial answers will provide ideas about (1) the nature of the court’s work and how the court’s handled its work and (2) the kinds of research that might follow from this exploratory examination. For example, are different case types processed differently? Do they come from different parts of the state? Do different parties win and lose at different rates in the supreme court? Further research always derives from even descriptive analysis of the parties (appellants and respondents, the winners and losers on appeals, and the kinds of decisions that are reached by a court).
The Data
The Montana Supreme Court works in calendar-year terms. As a result, this analysis is based on data collected from two calendar years—2007 and 2017.[11] These two years were selected to provide a minimal comparison of the court’s work over time and to suggest the more general features of judicial business in the state than can be derived from a single year’s work. The selection of 2017 was based on that fact that it was the most recent year of complete, available data. The earlier year—2007—was selected in large part because it was a full decade earlier. Except for one justice who served during both these years, there was nearly complete turnover in justices between the two years.
The codebook is provided as an appendix and provides an outline of the variables that were collected (around three dozen) and the categories that were developed to sort the data into subsets. Coding nominal and categorical data requires a good deal of care and a clear understanding of the range of each variable. There are likely to be differences in the judgment of persons who coded parts of the data. The way to reduce those differences, if not eliminate them altogether, is to have several people code the same subset of cases and compare the coding. The comparison suggests that most of the variables were coded consistently by everyone. Some of the variables, particularly those involving the subject matter of each appeal,[12] produced the most variation but was still within permissible limits. Other variables were created or calculated from the original data. In some instances, the number of categories defined for a variable was reduced (or “collapsed”) because they contained a very small set of values.[13] Additionally, collapsing similar categories reduces variability in the coding. A statistical software package was used to provide the tabulations and other output that are presented below.[14]
The Supreme Court’s Business
An Overview
The analysis begins with an exploration of the general pattern of appeals filed with the Montana Supreme Court. Table 1 shows the total number of appeals for each of the years examined here. The first notable feature of these data is the number of appeals. It is clear that the court treats a substantial number of appeals each year—recall that all appeals have to be considered by the court in some fashion. It is interesting to compare the two years in terms of the number of appeals. There was about a 150-case decline in the number of appeals between 2007 and 2017. This feature alone does not indicate much about the change, but it suggests that in the course of the decade, the volume of business (measured as raw numbers of appeals) has changed (dropped). Whether the nature of that work has also changed remains to be seen.
| Year | Total Appeals | Full Published Opinions | Noncite Memorandum Opinions | Closed Cases | Cases Carried Over | Pro Se Cases |
| 2007 | 751 | 233 | 125 | 713 | 694 | 193 |
| 2017 | 596 | 158 | 148 | 764 | 581 | 228 |
Other features displayed in this table are the number of cases resolved by the court and the number of cases carried over to the next year.[15] The court disposed of nearly the same number of cases in both years. However, it is striking that the number of appeals carried over to the next year was just over one hundred appeals less in 2017. These carried-over cases were either appeals filed late in the year that the court could not decide and finish before the new year or difficult or unique cases that required repeated and extended attention by the court after the parties had supplied more information. The pro se cases are those appeals presented to the court by the party (the appellant) acting on their own behalf without the assistance of an attorney. As a proportion of the total appeals for each year, this subset of cases represents just over a quarter of the appeals in 2007 and nearly 40 percent of all the appeals filed in 2017. This is a striking feature of the appeals. Pro se cases could involve individuals appealing their criminal convictions. However, there are a variety of civil matters in which the appellant proceeds on his or her own. The court makes every effort to accommodate such appellants, but they undoubtedly present a challenge to the court due to a lack of legal representation.
Table 1 also shows information about how the court handled its work during these two years. A substantial portion of the appeals were disposed of in each of the four ways that are displayed in figure 1. Cases “Dismissed” and those “Remanded for Re-Briefing ” constitute about 50 percent of the 2007 appeals disposed of by the court and nearly 60 percent of those the court treated in 2017. Obviously, these are substantial portions of the court’s business, and these filings do not receive decisions on the merits unless they are refiled. A detailed examination of these appeals is beyond the data available for this study. There is no public record available on the nature of these dismissed appeals. However, it is clear that the court’s decisional processes allow it to make a preliminary screening decision on a substantial portion of the appeals that are brought to it on appeal. This process is similar to the rapid disposition method (RDM) utilized by the Court of Appeals for the Ninth Circuit to manage their heavy caseload.
The remainder of the court’s dispositions involves a decision and opinion on the merits. A large segment of this category was decided by a full written opinion (32 percent in 2007 and 20 percent in 2017). These types of decisions contribute to the body of precedent. These cases involve legal issues that the court determined are credible and possibly useful for future litigants. As a result, the court issued full opinions on this set of appeals. On the other hand, memorandum opinions resolved cases that do not constitute precedent for future legal issues. It is notable for the court to divide cases that it and future litigants could use as precedent in later cases and others that only resolve the issue(s) in the case for the affected litigants. The fundamental feature of the data displayed here is that a large portion of the court’s appellate work is treated relatively summarily and quickly, without full opinions or treatment by a full en banc court. In 2007, about two-thirds of the cases were treated by one of the three limited methods of disposition that did not constitute precedent by the court. That proportion was nearly 80 percent in 2017.[16]
Sources of Appeals
The next question explored here is, Where did these appeals come from? To answer this question, we must sort the cases by the lower courts that generated the appeals, and there are several different ways we can accomplish this categorization. First, there is the question of where the appeals originated. That involves two features. One is the geographic origin of the appeals. This is related to various population centers and other locations in Montana.[17] The second feature is the court of original jurisdiction. Although figure 1 correctly indicates that there are three possible courts that could generate appeals for the supreme court, there are a large number of courts of limited jurisdiction that may have heard cases originally. A second perspective on the source of cases is who brought the appeal. It is obvious that the party that lost the case below (at trial) is the likely appellant. There may be cross appeals filed by the winner in order to obtain some correction of a favorable lower court’s order; however, for the most part, appeals are largely brought by losing parties seeking to have the supreme court correct a legal error that the appellant argues was made at the trial-court level.
Next, we look at which court level, displayed in figure 1, the appeals originated from. Table 2 is an aggregate display of the court of origin for the appeals. Clearly, the large majority (nearly 85 percent) were originally filed in the trial courts of general jurisdiction (district courts). Nearly another 10 percent were started in the justice courts or municipal courts in the state. These appeals were channeled through the district court, which treated them de novo.[18] This category largely involved misdemeanor crimes initially treated by justices of the peace. Thus the vast bulk of appeals came to the supreme court from the district courts. Interestingly, the last 5 percent began in the specialized water courts or the workers’ compensation courts.[19]
| Court | Proportion of Appeals | N |
| Courts of Limited Jurisdiction* | 9.7% | 66 |
| District Court | 84.5% | 577 |
| Water Court/Worker’s Compensation Court | 5.8% | 40 |
| Total | 100% | 683 |
*This category includes Justice Courts, Municipal Courts, and City Courts.
The second exploration of where cases came from is displayed in figure 3, which represents a set of dot plots showing the number of appeals from each of the twenty-two district courts in the state. Dot plots are a readable method of arraying some kinds of data. Figure 3a displays the number of total appeals, combining appeals from both years. These are categorized by district court numbers from which appeals were taken. The largest sets of appeals are displayed at the bottom of figure 3a. Figures 3b and 3c subdivide the appeals by the years under study here. Clearly there are some districts that generate the bulk of the appeals in either year as well as the combined number.
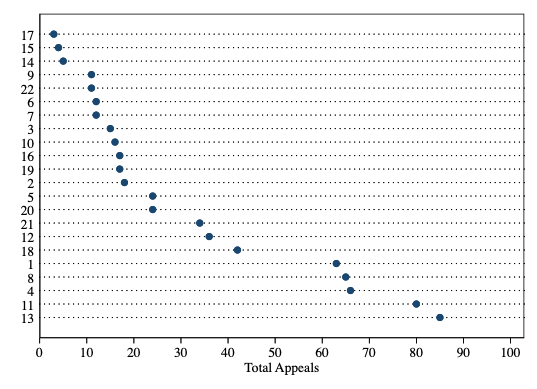
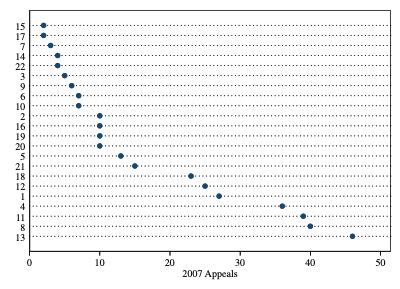
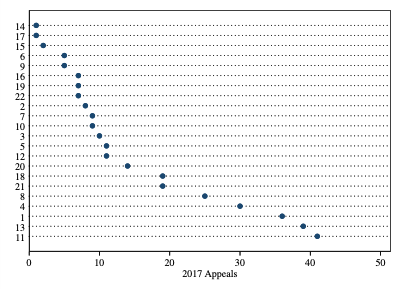
The largest numbers of filings come from the population centers in the state. District 13, for example, is Yellowstone County, which includes the state’s largest city, Billings. The other districts with the largest number of filings are District 1 (containing the capital, Helena), District 2 (Butte), District 4 (containing Missoula), District 8 (Great Falls), and District 11 (Kalispell). The other three districts that provided a noticeable set of appeals are a mixed set. District 18 (Bozeman) could be considered a population center, though the number of appeals from that district is less than the other population centers.[20] Both District 12 and District 21 contain more than one county. These districts, each of which generated a significant number of appeals in one of the two years, do not contain any population centers.
While the subset of districts that generated the most or the largest set of appeals seems arbitrary, the largest numbers of appeals come from population centers. The largest numbers of filings are not from identical districts for both years. Districts 12 and 21 were each among the largest of the seven in one of the years, but not both. Figure 3a is a less clear presentation, as there are several breaks or gaps when both years are added together. The dots and the cutoff could include Districts 5 and 20 for a total of ten districts. These two districts do not contain state population centers. However, the eight largest appeals from districts (identified in figures 3b and 3c) are the eight large, populated districts. The other extreme (the upper portions of each figure) identifies districts that presented very few appeals, say one or two per year. The median number of appeals from the twenty-two districts was 10 in 2007 and 9.5 in 2017 (the means are 15.6 and 14.3, respectively).
The third question about origins seeks to determine who appealed cases. This involves the types of parties appealing cases. There are various ways to categorize parties. The simplest, used here, is to bundle together all (1) individuals acting on a matter that concerns them; (2) government institutions, whether a sheriff, a city, or the governor of the state; and (3) companies or business interests of some sort. As displayed below, there is a fourth category of “other” parties. The largest number of appellants in this category was interest groups litigating a public policy issue, such as an issue involving environmental protection or water conservation.
Table 3 indicates the types of appellants and appellees involved in appeals to the Montana Supreme Court. This display of data contains a tabulation of the filings combing both years. The difference between 2007 and 2017 on this matter is not noticeable.[21] Of course, appellants were the parties who lost in the court below and who sought a reversal of the trial outcome. It is important to note the number of cases appealed by each type of appellant and appellee in the table. These are the row and columns labeled “N” in the table. Clearly, the vast bulk of the appeals was brought by individuals (81.2 percent), and most of the time (56.8 percent), the government is the appellee. That indicates that the “typical” appeal involves an individual challenging an action by a governmental entity where the appellee won in the trial court. The table also indicates that the remaining types of appellants and appellees constitute small portions of the litigating population in this study.
| Appellee – Individuals | Appellee – Government | Appellee – Business | Other | Total | N | |
| Appellant – Individuals | 17.6% | 56.8% | 14.6 | 11.0% | 81.2% | 562 |
| Appellant – Government | 62.9% | 11.4% | 14.3% | 11.4% | 5.1% | 35 |
| Appellant – Business | 23.1% | 25.0% | 44.2% | 7.7% | 7.5% | 52 |
| Other | 18.6% | 30.2% | 11.6% | 39.5% | 6.2% | 43 |
| Total | 20.4% | 50.4% | 16.6% | 12.6% | 100.0% | 692 |
| N | 141 | 349 | 115 | 87 | 692 |
Chi2 = 111.47 pr=.0001
Note: Appellants file appeals. Appellees respond to appeals brought by appellants.
The appeals brought by individuals against the government largely dealt with one of two kinds of claims by individuals. First, a great many appeals considered an individual subjected to a criminal charge or convicted of criminal activity who challenged his or her charge/conviction in some form. These suits are brought against the county, the county prosecutor, or a prison warden. All of these appellees are represented by the state attorney general at the supreme court. In most of those cases, the relevant county attorney also prepared the response to the appeal, but the attorney general or a staff member filed the response. A second set of these appeals treated an individual seeking a remedy for (relief from) some action by a government agency or actor involving an administrative or civil issue. That is, the government actor reached a decision or took some action that the appealing individual challenged on grounds that it was illegal. The remainder of individual appellants’ cases was relatively evenly distributed among the other three kinds of appellees.
The second most frequent appellant was businesses (7.5 percent). These appeals largely involved cases against other businesses. It is possible these contract disputes could not be settled through negotiation or mediation. Another quarter of the appeals by businesses were challenges to a governmental policy. A bit over 20 percent of appeals from businesses were against individuals. Nearly all of this last category of contract cases dealt with individual who entered commercial transactions that failed for some reason. Businesses and the other two small categories of appellants—the government and “other”—constitute just under 20 percent of appellants altogether. None of these three categories compose a striking portion of the appellants.
It is noticeable that when the government appealed a case, the primary appellees were individuals (over 60 percent). These appeals by the state or a local government involve a variety of civil disputes. There were two primary appellee categories of appeals brought by “other” appellants against “other” appellees (nearly 40 percent) and against governmental actors (30 percent). Given that many of the “other” appellants were interest groups, their suits against governmental agencies were focused on a policy or regulation that raised a legal issue that the advocacy group sought to reverse or clarify.
The Nature of Appeals
Who Are the Appellants?
The nature of the appeals that the various categories of appellants presented to the court is suggested above and also displayed in table 4.[22] This is a simple categorization of appeals versus appellants. The meaning of a civil or criminal appeal is self-evident. The “other” category included a variety of issues related to equity claims. These include appeals that involved injunctions, restraining orders, or determinations of status—for example, determinations relating to youth in need of care. In addition, this category included civil commitment cases where an individual challenging his or her commitment to an institution for some kind of treatment. Interestingly, the civil and criminal appeals each constituted about the same portion of the appeals (43.5 percent and 39.3 percent, respectively). The remaining 17 percent were the “other” types of appeals.
| Subject Matter – Civil | Subject Matter – Criminal | Subject Matter – Other | Total | N | |
| Appellant – Individuals | 38.3% | 45.6% | 16.2% | 81.2% | 562 |
| Appellant – Government | 45.7% | 40.0% | 13.3% | 5.1% | 35 |
| Appellant – Business | 94.2% | 0.0% | 5.8% | 7.5% | 52 |
| Other | 48.8% | 4.7% | 46.5% | 6.2% | 43 |
| Total | 43.5% | 39.3% | 17.2% | 100.0% | 692 |
| N | 301 | 272 | 119 | 692 |
Chi2 = 99.7389 pr=.0001
The core feature of criminal appeals is that they are presented by individuals. Civil appeals involved various appellants who raised different substantive issues. Table 5 displays the numbers and proportions of civil appeals categorized by the type of appellant and the substantive issue presented in the appeal. This category of appeals (civil) constitutes nearly half the business of the court during these two terms. The largest set of civil appeals involved contract issues. The “other” category of appeals is the next largest and involved various procedural issues, equitable claims, government regulations, and public policy. Property claims involved nearly a quarter of appeals to the court. Tort claims constituted a small segment of the substantive work for the court.
The bulk of civil appeals were brought by individuals. The primary subject of those appeals was issues relating to contract. These appeals involved either interpreting a provision of a contract or resolving issues about what the consequence of the contract was. Businesses were the second most frequent appellant (over 15 percent of civil appeals), and those suits were primarily contract cases. Half the appeals brought by businesses were contract cases. The government was not the appellant in many civil cases at all (5.3 percent). The “other” category of appellants includes a collection of appellants, largely interest groups, both public and private. There were few appeals brought by this category of appellant, but most of those raised property issues.
| Appellant | Contract | Tort | Property | Other | Total |
| Individual | 72 (66.7%) | 25 (80.7%) | 53 (72.6%) | 65 (73.0%) | 215 (71.4%) |
| Government | 7 (6.5%) | 0 | 2 (2.7%) | 7 (7.9%) | 16 (5.3%) |
| Business | 24 (22.2%) | 3 (9.7%) | 10 (13.7%) | 12 (13.5%) | 49 (16.3%) |
| Other | 5 (4.6%) | 3 (9.7%) | 8 (11.0%) | 5 (5.6%) | 21 (7.0%) |
| Total | 108 (35.95) | 31 (10.3%) | 73 (24.2%) | 89 (29.6%) | 301 (100%) |
Chi2 = 11.6521 pr=0.23
Types of Questions
The kinds of questions presented to the court on appeal require another categorization. The issue(s) involved a substantive issue of law, a procedural issue, or a constitutional issue. Table 6 displays this categorization of the appeals to the court. The largest segment of appeals presented the court with a substantive legal issue. A full quarter of the appeals challenged the procedure used at the trial-court level. There were only sixteen appeals that raised purely (only) a constitutional issue. Of those, 68 percent were affirmed. That means that over 30 percent of these few appeals treated at least a partial reversal of the lower court on the issue. These few cases (five appeals altogether) did not necessarily mean the court invalidated a statute as unconstitutional; rather, these claimed a violation of a constitutional right or principle that required reversal.
| Issue Type | Proportion | N |
| Substantive | 43.9% | 304 |
| Procedural | 25.9 | 179 |
| Constitutional | 8.5% | 59 |
| Mixed | 21.7% | 150 |
| Total | 692 |
There were appeals that combined an issue of constitutional law and a substantive or procedural claim. An appeal does not necessarily present only one issue; rather, a mixture of claims was prevalent in a number of appeals. The “constitutional” category in table 6 combines cases with multiple issues (substantive or procedural as well as constitutional). This expanded category of cases with some constitutional issue includes the most expansive set of constitutional appeals that is possible here. This category still constitutes less than 10 percent (8.5 percent) of the court’s business. The other categories presented in table 6 obviously constitute the vast bulk of the court’s appellate work. Close to 70 percent involve a substantive claim relating to either a common-law or a statutory issue. The 25 percent of appeals that presented procedural issues is interesting to note. That means one-quarter of the appeals claimed that the trial court’s proceedings did not involve a matter of substance. As already noted, the “mixed” category included determinations of status for the appellant or requests for injunctive relief. The broadest set of appeals that presented a constitutional issue involved fifty-nine of the appeals to the court.
This last point is not surprising, but it is worth emphasizing that the work of this appellate court (and perhaps other state appellate courts in this country) may not involve a large portion of issues of constitutionality. The concern that some observers have about the exercise of the power of judicial review is an important point of discussion; however, this state court had few opportunities to consider an issue of constitutionality. Furthermore, those cases did not contain a constitutional flaw in the trial court’s work. When the remaining appeals (reversed or affirmed in part) are combined, just over 20 percent of the appeals were reversed—and again, none of these decisions involved the declaration of a constitutional error.
Number of Issues
Another feature of the kinds of appeals that might be considered is the number of issues decided by the court. Appeals often presented the court with various legal questions, ranging well into the double digits. However, the median number of issues raised was 1 and the mean is 1.7. These appeals displays several interesting features when the data are categorized by the substantive kinds of cases presented to the court. The court often indicated that one legal question out of the multiple questions presented on appeal was determinative. As a result, the court only decided that legal issue, no matter how many legal issues the appellant presented in his or her brief. Table 7 indicates the substantive case types and the number of legal issues presented to the court (not necessarily decided). A substantial majority of appeals presented a single issue (nearly 60 percent). Another 20 percent of appeals presented the court with two issues. The other 20 percent of cases presented three or more issues.[23]
| Number of Legal Issues | Contract | Tort | Property | Criminal | Other | Total |
| One Issue | 59 (50.4%) | 15 (41.7%) | 33 (44.0%) | 177 (63.2%) | 129 (70.1%) | 413 (59.7%) |
| Two Issues | 19 (16.2%) | 9 (25.0) | 23 (30.7%) | 69 (21.4%) | 26 (14.1%) | 137 (19.8%) |
| More than Two Issues | 39 (33.3%) | 12 (33.3%) | 19 (25.3%) | 43 (15.7%) | 29 (15.7%) | 142 (20.5%) |
| Total | 117 (16.9%) | 36 (5.2%) | 75 (10.8%) | 280 (40.5%) | 184 (26.6%) | 692 (100%) |
Chi2 = 38.4975 pr=0.000
When the types of appeals are examined in relation to the number of questions, criminal appeals present the largest proportion of single-issue appeals. None of the other (civil) categories of case types display very striking differences in the proportions of issues. There is some variation in the proportions of single-issue cases for contracts and the other category. Probably the most striking feature of the data categorized by number of issues and case types is the fact that on appeal, most of the appeals presented the court with one issue. In fact, for multiple-issue cases, the court often converted those to a single issue that disposed of the case.
Appellate Outcomes
The outcome of the court’s decisions in these appeals presents interesting patterns. These results are first displayed in tables 8a and 8b. These results are categorized by the type of appellant (table 8a) and the kinds of substantive issues presented to and decided by the court (table 8b). In the aggregate, the appeals were largely affirmed (73.7 percent). This indicates that the appellants’ claims, though considered by the supreme court, did not constitute a reversible error in three-quarters of the appeals. This feature does not vary with the type of appellant. Seven percent were affirmed in part and reversed in part. That means that some action by the lower court was reversed even though that is really a partial victory for the appellant. In those cases, the lower court was directed to correct some legal error. Nearly 14 percent were reversed completely. These general features of table 8a suggest that trial-court errors requiring reversal (correction) by the supreme court were the exception rather than the rule for these two years.
| Appellant | Affirmed | Affirmed in Part / Reversed in Part | Reversed | Other | Total |
| Individual | 433 (77.1%) | 38 (6.8%) | 73 (13.0%) | 18 (3.2%) | 562 (81.2%) |
| Government | 16 (45.7%) | 3 (8.6%) | 10 (28.6%) | 6 (17.0%) | 35 (5.1%) |
| Business | 41 (78.9%) | 2 (3.9%) | 9 (17.3%) | 0 (0.0%) | 52 (7.5%) |
| Other | 20 (3.9%) | 7 (16.3%) | 4 (9.3%) | 12 (27.9%) | 43 (6.2%) |
| Total | 510 (73.7%) | 50 (7.2%) | 96 (13.9%) | 36 (5.2%) | 692 (100%) |
Chi2 = 1.1102 pr=0.000
| Appellant | Affirmed | Affirmed in Part / Reversed in Part | Reversed | Other | Total |
| Contract | 79 (67.5%) | 13 (26.0%) | 14 (14.6%) | 11 (30.6%) | 117 (16.9%) |
| Tort | 23 (63.9%) | 3 (11.1%) | 7 (12.0%) | 3 (9.4%) | 36 (5.2%) |
| Property | 51 (68.0%) | 10 (13.3%) | 11 (14.7%) | 3 (4.0%) | 75 (10.8%) |
| Criminal | 224 (80.0%) | 13 (4.6%) | 37 (13.2%) | 6 (2.1%) | 280 (40.5%) |
| Other | 133 (72.3%) | 11 (6.0%) | 27 (28.1%) | 13 (7.1%) | 184 (26.6%) |
| Total | 510 (73.7%) | 50 (7.2%) | 96 (13.9%) | 36 (5.2%) | 692 (100%) |
Chi2 = 24.7613 pr=0.016
Both individual and business appellants lost their appeals over 75 percent of the time. There seems to be little difference between these two primary appellants in their winning proportions (reversals in 19.8 percent for individuals and 21.2 percent for businesses). On the other hand, the government as an appellant prevailed (at least partially) in a larger proportion of appeals (37.2 percent reversals). The other category of appellants did receive a notable number of “other” outcomes. These court orders related to injunctions, vacating and remanding, or procedural rulings, such as mootness or a lack of jurisdiction or standing.
Table 8b examines the outcomes categorized by type of case. The most striking feature of this display is that criminal appeals were the highest proportion of affirmed results among the categories. This finding suggests that the court addressed the criminal appeals, scrutinizing the lower court closely, but generally could find no reversible error in the lower courts’ actions. The three categories of civil appeals—contracts, torts, and property—were all affirmed at nearly the same rate. There are almost no differences among case types in terms of complete reversals. If the partial reversals are added, there is a bit more variation; however, it does not appear to be a striking set of differences.
The Votes and Work of Justices
The vote of either the five-justice panel or the seven-justice panel on these cases was largely unanimous. Table 9 indicates this feature of the supreme court’s decisions. Over 85 percent of the appeals were decided unanimously regardless of whether they were decided by five or seven justices.[24] Some of these unanimous decisions did include a concurring opinion; this set (about 5 percent of the unanimous decisions) involved support for the result but presented a different view of the reason for that result. Only about 13 percent of the appeals were decided with one or more dissenting opinions. This level of unanimity changed somewhat between the two court terms examined here, though the differences were not statistically significant. The 2007 term had 14.6 percent nonunanimous compared with 10.9 percent in 2017. The aggregate of these two was 13.4 percent nonunanimous decisions. The takeaway point from these analyses is that the court in 2007 was somewhat more divided than in 2017.[25]
| Panel | Unanimous | Non-Unanimous | Total |
| Five-Justice Panel | 550 (93.4%) | 39 (6.6%) | 589 (85.1%) |
| Seven-Justice Panel | 49 (47.6%) | 54 (52.4%) | 103 (14.9%) |
| Total | 599 (86.6%) | 93 (13.4%) | 692 (100%) |
Chi2 = 158.1210 pr=0.000
It is clear that the court’s procedure allows five-justice panels to decide appeals under some circumstances. Table 9 shows that for the two years examined here, 86 percent of the court’s decisions were rendered by five-justice panels—a large portion of the court’s decisions. A second point to note is that the proportion of unanimous decisions in seven-justice panels is lower than the proportion in five-justice panels (48 percent compared with 93 percent). This might be because the seven-justice panels arise only when three justices request oral arguments or when four justices of a five-justice panel cannot agree on the decision. It is not possible to determine which of the seven-justice decisions were the result of five-justice panel disagreement and which were selected out by any justice who decided oral argument should be conducted. The difference in votes might suggest that the seven-justice panels deal with the more controversial or difficult cases. Table 9 permits the conclusion that the bulk of the court’s business is handled by the smaller panels of justices, and those appeals are probably easier, run-of-the-mill cases. It could be inferred that a portion (less than 15 percent of the appeals) generated enough disagreement or attention among the court members to warrant full-court decisional attention. Lastly, it is noticeable that even the seven-justice panel decided a significant proportion of its cases (nearly half) unanimously.
While the individual votes of the justices in each case were not recorded, the identity of the opinion writer was collected. This permits the examination of several questions. The first is whether the opinion writing for each year was distributed evenly among the seven justices. Second, did the chief justice write about one-third fewer opinions than the other members of the court, as the IORs permit? Tables 10a and 10b provide the opinion writers by year, with the justices identified by number. A completely even distribution of opinions among the seven justices would require each justice to write one-seventh (14.3 percent) of the opinions. Clearly opinion workload was not distributed evenly among the justices. However, the distribution of opinions is fairly even, with some variation among the justices’ workloads. This suggests that the US Supreme Court’s norm of equal work may be shared in other collegial high courts.
| Justice | Opinions | Proportion of Total | Mean Opinion Length (Pages) | Median Opinion Length (Pages) |
| 2007-1 | 48 | 13.3 | 7.5 | 6 |
| 2007-2 | 54 | 15.0 | 10.2 | 8 |
| 2007-3 | 65 | 18.1 | 9.8 | 8 |
| 2007-4 | 56 | 15.6 | 10.6 | 8 |
| 2007-5 | 45 | 12.5 | 18.9 | 13.5 |
| 2007-6 | 48 | 13.3 | 10.9 | 10 |
| 2007-7 | 44 | 12.2 | 8.2 | 7 |
Note: The average length of all opinions rendered in 2007 was 10.7 pages, and the standard deviation was 9.6. That is a fairly wide distribution of opinion lengths.
| Justice | Opinions | Proportion of Total | Mean Opinion Length (Pages) | Median Opinion Length (Pages) |
| 2017-1 | 59 | 18.2 | 7.4 | 6 |
| 2017-2 | 54 | 16.7 | 12.3 | 10 |
| 2017-4 | 43 | 13.3 | 12.7 | 12 |
| 2017-5 | 53 | 16.4 | 9.2 | 8 |
| 2017-6 | 25 | 7.7 | 13.4 | 10 |
| 2017-7 | 38 | 11.7 | 8.8 | 8 |
| 2017-8 | 52 | 16.1 | 10.0 | 8 |
Note: The average length of all opinions rendered in 2017 was 10.3 pages, and the standard deviation was 6.2. That too is a fairly wide distribution of opinion lengths.
It is unlikely that each justice would ever be assigned precisely one-seventh of the opinions to write. Justice 3 did write the largest proportion of opinions in 2007 (18 percent). That value is certainly higher than the target. It is interesting that a number of the remaining justices (particularly 1, 3, and 7) wrote noticeably less than one-seventh of the opinions. It is accurate to say that the distribution of majority opinions in 2007 was about even among all the justices.
The distribution for 2017 was different. Again, 14.3 percent would be an even distribution for each of the seven justices. In this year, Justice 1 wrote the highest proportion of opinions. Furthermore, three other justices (2, 5, and 8) wrote relatively high proportions, and this might account for the strikingly low proportion written by Justice 6. The reason for this particular feature of 2017 was that Justice 8 retired from the court, and another justice chose not to run for retention. Justice 6 was elected to the High Court in November 2016 and was sworn in at the beginning of 2017. This low output might reflect a choice by the assigner (usually the chief justice) to permit the freshman justice to “learn” during this year and have the other six justices make up the difference.
The second question focuses on the writing workload of the chief justice. The answer to that question is that neither chief justice wrote one-third fewer opinions, as the IORs permit. If the chief justice wrote one-third fewer opinions, that proportion would be about 9.6 percent of the court’s output. In terms of the raw numbers, one-third fewer opinions in 2007 was thirty-four; in 2017, it was thirty. The only justice who wrote a noticeably lower proportion of majority opinions than the rest of the court was Justice 6 from 2017, not the chief justice. In both years, the chief justice wrote a good deal more than their lower proportion, or number, of opinions would have permitted. Both chief justices contributed a significant proportion of opinions each year.
The box plots in figure 4 indicate the range of opinion lengths for each justice for 2007 (3a) and 2017 (3b).[26] There are two points to note about these figures. First, there are no opinions plotted in 2017 for Justice 3. That is because this justice was appointed late in the year (December 2017) and did not author any opinions. The new justice replaced Justice 8, and the opinion output for Justice 8 was not particularly diminished by the abbreviated length of service during that year (see table 8b). Furthermore, table 9 indicates that in 2017, Justice 8 contributed a substantial portion of majority opinions despite leaving the court early. Second, note the difference in the vertical scales in figures 4a and 4b. The difference is due to who wrote two very long opinions during 2007 (Justice 5).
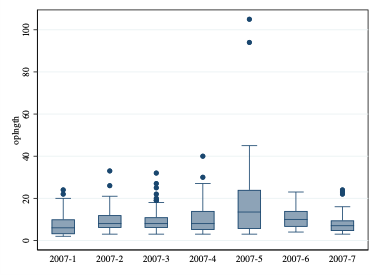

Figure 4: Boxplots of Opinion Lengths Categorized by Opinion Writer, 2007 and 2017
The box plots in figure 4 also illustrate that some justices wrote a greater range of opinions when compared to others, and there are relatively striking distributions of opinions for several individual justices. In 2007, Justice 3 wrote a number of lengthy opinions (five outliers) when compared with the usual opinion length (the box and median). Justice 5 wrote two exceptionally long opinions (94 and 105 pages). The bulk of Justice 5’s opinions had a much greater range than that of the rest of the court. The opinion length of the justices in 2017 displays less variation than that of 2007. While there are some outliers, and Justice 6 in 2017 does display more spread than the rest of the justices’ opinion lengths, generally the opinion behavior of the justices on the supreme court did not vary a great deal either among the justices or from one year to the next.
The last feature of the process to be explored here is the amount of time it took the court to reach decisions on appeals. The court’s IORs specify that within 90 days of an appeal submitted on the briefs, an opinion should be circulated among the rest of the members, and within 180 days, it should be announced. The data available for this study do not indicate when an opinion was circulated to the court members. However, most of the cases were “submitted on the briefs,” and that can be considered the start date. Interestingly, for 2007 and 2017, the processing time ranged from a minimum of 12 days to a maximum of 930 days! This maximum is an extreme outlier. The box plots for the two years, displayed in figure 5, indicate some differences in the patterns for 2007 and 2017. There are a number of extremely high outliers in 2007, and while there are several outliers in 2017, the number of days involved for these outliers is much less than in 2007. Additionally, there are fewer outliers in the 2017 term than in 2007.
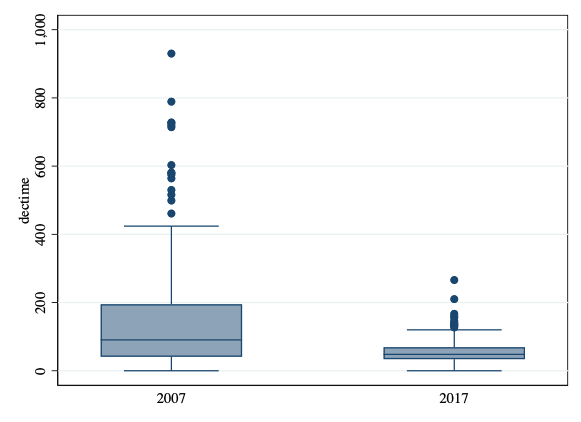
The mean processing time (from submission to announcement of the decision) for 2007 was 139 days (the median was 90 days). More importantly, a full quarter of the decisions involved more than 195 days. Clearly in 2007, the time the court took to complete its decisions work varied widely, and a substantial portion took more than the 180 days allowed by the court’s own rules. The comparable numbers for the 2017 term were a mean of 54 days and a median of 48 days. Furthermore, in 2017 the upper quartile of the court’s decisions required 160 days or more to decide (the maximum was 266 days). The box plots in figure 5 clearly indicate the differences in the court’s processing time between the two years. The number of appeals decided in these two years was not much different (361 decisions in 2007 and 324 in 2017). The difference in processing time does not seem related to the volume of work. It could be that the appeals were more “difficult” in the earlier year. It could be that the members of the courts were less in agreement about the outcomes in 2007, which might have required more time on average to decide cases.[27] It might mean that it simply took the justices longer in 2007 to reach decisions even when they were unanimous. However, there are no data that measure difficulty. Figure 6 displays the distribution of decision time categorized by year and by general type of appeal. These data convey points about this variable that clarify the processing times somewhat. The court’s IORs are designed to provide some parameters for the conclusion of appeals, but the 180 days is clearly an objective, not an absolute.

The differences in processing time between the two years may involve the types of appeals. The position and the spread of the three box plots for 2007 are much different from 2017. In 2007, the categories of case types varied widely in the time it took to decide them. In 2017, the types of cases did not take different amounts of time to decide. The means and the medians for each of the categories of appeal in 2017 are nearly identical (mean of 54 days and median of 48 days). There is a good deal wider diversity in the mean and median processing time for 2007 cases (139 days and 91 days, respectively). Another point to note is that there are several outliers for the “other” category in 2017; this category in 2017 presents some idiosyncratic appeals that required more attention than is “normal” for that set of appeals. This is probably not surprising, since these of appeals undoubtedly includes a diverse set of issues that do not fit into the traditional civil and criminal cases.
The pattern for 2007 is even more striking when the time-to-decision variable is categorized by case type. Most notably, the extreme outlier in 2007 involves one case in the “other” category. This particular case was clearly unique. Another notable feature of the box plots for 2007 is that the civil appeals show a much wider distribution and display a number of outliers compared with the other two types of appeals. Civil appeals had a mean of 164 days and a median of 118 days.[28] These two indicators of centrality differ from those for the other two categories of appeals. Criminal appeals in 2007 had a mean of 124 days and a median of 90.5 days. The “other” category of appeals had a mean of 99 days and a median of 55 days. These numbers may indicate the “qualitative” feature in these kinds of appeals. It is also interesting to note that the upper edge of the box plots (the top of the boxes) for both civil and criminal appeals in 2007 exceeded the 180-day guide contained in the court’s IORs (224 and 185 days, respectively). While these patterns are interesting, they do not help us answer the intriguing question of why the decisional time is so different between the two terms, especially when most other indicators reveal only small differences between 2007 and 2017.
One final way to look at the time-to-decision feature of these cases would be to consider segments of the time it takes for the court to render a decision. For example, we could look at the proportion of case types that the court decided within 90 or 180 days of submission. The court decided 99.4 percent of the appeals in 2017 within 180 days of submission (only two appeals exceeded that “deadline”). On the other hand, in 2007, the court decided 69.8 percent within the 180-day limit, and the remainder, some 109 cases (31.2 percent), took longer than 180 days to decide. While this difference presents the same phenomenon as the earlier discussion and displays in figures 5 and 6, the difference is striking. Again, what occurred during the 2007 term that “caused” this pattern warrants closer inspection.
Conclusions and Prospects
The conclusions to be drawn from this analysis may not be profound or earth-shattering. They are certainly unique to the Montana Supreme Court. Yet our understanding of this court is enhanced by the descriptive treatment of its work during 2007 and 2017. It appears that much (nearly all?) of the court’s work involves examining various challenges to the decisions of the trial courts in the state. Furthermore, the supreme court largely affirmed the original decisions by the lower courts, suggesting that most of the appeals do not present difficult or “new” legal questions that involved many trial-court errors. Most of the court’s business, it seems, did not involve great efforts at correcting the lower state courts.
The court changed membership over this period. There may be fewer cases to disagree about among the more recent members (2017) than the earlier year and its members. This would require the collection and analysis of more data from earlier years; data from years such as 2012, which is halfway between the two years examined here; or information on the justices and their ideology. The data used here could be supplemented with additional years of information, providing a more comprehensive picture of the court’s work and its members. However, the data used for this study indicate some possibilities for differences among justices and differences over time.
This analysis raises a good many questions for future research. Answering these questions would provide a more detailed understanding of the Montana court and its operation and the people (justices and litigants) who are involved in that work. The value of empirically based research is that it permits a closer examination of what any court does and how it accomplishes its tasks. This kind of work also allows for comparisons with other state appellate courts if the data were available. While each state is unique in many ways, they all have a judicial system with a high court, and those courts treat various kinds of appeals (and other business) that would permit comparisons if the data were collected and analyzed.
There is a short list of additional questions below that these data might be used to explore. However, there are many more questions that future research could treat, depending on the collection and analysis of additional variables. The additional data probably should include additional years of the supreme court’s business, permitting much closer and extensive longitudinal analysis. Either examining the comparable data for each year between 2007 and 2017 or adding other earlier or later years would greatly enhance the understanding that could be derived from this kind of analysis. Additional variables might also be revealing. Identifying the individual justices who voted in the majority and the minority (in those cases that were not unanimous) might reveal some individual behavioral patterns among the justices. Since there are relatively few attorneys who appeal cases to the court, examining particular legal representatives (lawyers) might yield different results for different attorneys. County prosecutors and public defenders might display different kinds of criminal cases and different outcomes. Furthermore, the composition of the five-justice panels (which justices served on which panels) might grant a closer understanding of the interpersonal interactions (their votes) among particular justices.
There are a number of questions that might yield interesting patterns and results. Perhaps the most important point to make here is that empirical data can answer various questions that qualitative data (substantive court decisions) cannot answer. To understand an appellate court in this country, it is important to undertake both kinds of research.
References
Brace, Paul, Laura Langer, and Melinda Hall, (2000). Measuring the Preferences of State Supreme Court Justices, 62 J. of Politics 387–413. (↵ Return)
Berry, Christopher and Charles Wysong, (2012). Making Courts Matter: Politics and he Implementation of State Supreme Court Decisions, 79 Univ. of Chicago L. Rev. 1–29. (↵ Return)
Hall, Melinda Gann, (2015) Attacking Judges: How Campaign Advertising Influences State Supreme Court Elections, (Palo Alto: Stanford Law Books). (↵ Return)
Hall, Melinda and Chris Bonneau, (2008). Mobilizing Interest: The Effects of Money on Citizen Participation in State Supreme Court Elections, 52 Am. J. of Pol. Science 457–70. (↵ Return)
Lindquist, Stefanie and Kevin Pybas (1998). State Supreme Court Decisions to Overrule Precedent, 1965–1996, 20 Justice System Journal 17–40. (↵ Return)
Neubauer, David and Stephen Meinhold, (2017). Judicial Processes: Law, Courts, and Politics in the United States, 7th ed. (Boston MA, Cengage Learning). (↵ Return 1) (↵ Return 2)
Porter, Mary Cornelia and G. Alan Tarr, eds (1982). State Supreme Courts: Policy makings in the Federal System, (Westport CT, Greenwood Press). (↵ Return)
Sohn, William, (2012). Supreme Court Review of Misconstructions of Sister State Law, 98 Virginia L. Rev. 1861–96. (↵ Return)
Tarr, G. Alan and Mary Cornelia Porter, (1988). State Supreme Courts in State and Nation, (New Haven CT, Yale University Press). (↵ Return)
| District | Population (2017) | Proportion of state population |
| 13 | 156,332 | 14.7 |
| 11 | 96,147 | 9.0 |
| 4 | 125,645 | 11.8 |
| 8 | 81.810 | 7.7 |
| 1 | 22,045 | 2.1 |
| 18 | 100,733 | 9.5 |
| 12 | 24,525 | 2.3 |
| 21 | 41,387 | 3.9 |
| Total MT
population |
1,062,305 | 57.1 |
| Vote | Year | ||
| 2007 | 2007 | Total | |
| Unanimous | 308 (85.3%) | 291 (89.8%) | 599 (87.5%) |
| Nonunanimous | 53 (14.7%) | 33 (10.2%) | 86 (12.6%) |
| Total | 361 | 324 | 685 |
Pearson chi2(1) = 3.1443 Pr = 0.076
Class Activity
There is a relatively small number and proportion of cases in which one or more Montana supreme court justice dissented,
- Are there specific, individual justices who dissented most of the time?
- Do the dissents display any patterns in
- Case type?
- Reasons given for the dissent?
- Who writes the dissent?
About 8% (53) appeals involved concurring opinions.
- What patterns can be derived from the data about concurring justices?
- Do some kinds (types) of cases display more concurrences than others?
- Do some justices differentiate themselves more than other justices by writing a concurring opinion while agreeing with the outcome?
The analysis presented here indicates differences in the time-to-decision variable between 2007 and 2017.
- Does time-to-decision in cases vary over time (different years)?
- Is 2007 a unique year in terms of this variable or has the change in processing patterns been gradual (incremental) over the course of a number of years?
[Exploration of these questions would require more data, from additional years.]
There were few appeals where the trial court was reversed in the data set for 2007 and 2017.
- Do some districts get reversed proportionately more than others?
- For the six or eight districts with the most appeals,
- What is the reversal rate for this subset of districts?
- Is the reversal rate for these “big” districts different from those of “smaller” districts?
All the Court’s decisions are not available to be used as precedent.
- What proportion and what kinds of cases resulted in Supreme Court decisions that constituted precedent, and what proportion resulted in memorandum opinions?
- Do the memorandum opinions display any noticeable characteristics that differ from the other category of decision?
- Types of cases?
- Lower court origination?
- The types of parties bringing the appeals?
Depending on the availability of data from other states, comparisons between two- and three-tiered court systems could be quite possible and interesting.
Montana Supreme Court Research Project Codebook – 2019
The variables for this research project on the Montana Supreme Court are listed below in alphabetical order.
These are contained in two downloadable data sets – MT SupCt Data 07 & 17 27.xlsx
______________________
access This variable indicate the method by which the Court considered the case and decided it. This variable is located on the front page (the frontmatter) of each opinion.
1 = Submitted on Briefs
2 = Argued and Submitted (after Oral Argument)
3 = A Court ruling based on submissions or requested that do not result in a signed opinion. These are usually designated by “PR” or “AF” in the docket number.
N.B. Most Supreme Court cases will have a value of “1” for this variable.
______________________
amcur This variable is a count of the number of Amicus Curiae briefs filed in a case.
N.B. This information will be listed on the frontmatter or front page of each case, along with the attorneys appearing for the Appellant and the Respondent. Amici are listed separately in favor of the Appellant or the Respondent. Count them all no matter what party they support. There is often more than one attorney on the briefs for each side in an case. Those multiple attorneys are NOT amicus. The usual number for this variable will be “0” since amici are not often involved in appeals to the Court.
______________________
appnt This variable is the type of appellant who filed the case. This corresponds to the respnt variable as well. Be careful to note that the first name on a case may NOT be the Appellant but rather the Respondent.
1 = Private Individual (This includes prisoners or convicted criminals appealing the rulings of the trial court as well as citizen in civil cases. This also includes a lawyer petitioning the Court regarding their bar status.)
2 = State or local official. These include sheriffs, county prosecutors, the State Auditor or the Director of the Dept of Corrections.
3 = A company or partnership doing business in Montana. This includes law firms.
4 = Not-for-profit organization, public interest group, Indian Tribe
5 = A representative of a class (This will be indicated by a name plus the statement “other similarly situated.”)
6 = Individual as a Representative of an Estate
9 = not initiating party or appellant listed.
N.B. There may be cases/orders/Rulings of the Court that do NOT have an initiating party (appnt) or a responding party (respnt).
______________________
casename This variable is the title or name of the case. The entire case name may not appear on the Justia front page but it will be placed on the frontmatter of the actual opinion. Examples are:
Jones v Smith
Matter of WD BD
Matter of Rules of Appellate Procedure
______________________
cite This variable is a citation to the Court reports. This will serve as an identification number for each case in the data set, since each citation is unique. An example is:
DA 2017MT224
It should be entered without spaces and without the letter designations – 2017MT224. You should drop the letter designation before the citation is there is one. The variable prtype below indicates where and how to code the letter designation of citations.
N.B. If the citation has a total of 8 digits, e.g., 2007MT43, then the citation should be entered with another digit (a ninth) preceding the two digits after “MT.” For example, the citation just indicated should be coded 2007MT043.
N.B. if the citation includes an “N” after it, such as 2015MT443N, then the variable “prec” needs to be coded as “1”. Do not enter this variable (cite) with the “N,” but rather just enter the number with the “MT” in the middle 2015MT443.
______________________
decdate This variable is the date the Court rendered its decision in each case. This date is located on the front page (the frontmatter) of each opinion. It is coded in the same form as strtdate is coded: mm/dd/yy. An example would be:
04/26/17
This “date” should be entered with slash marks (/) and with two digits for the month and the day of the month, and four digits for the year.
______________________
decmnth This variable is the month that the Court’s decision was decided.
1= January
2 = February
3 = March
4 = April
5 = May
6 = June
7 = July
8 = August
9 = September
10 = October
11 = November
12 = December
______________________
dectime This variable is time, measured in days, that it took the Court to decide the case. That is a calculated variable, based on the following formula:
If there is not submission date or oral argument date available, then this variable is “missing” in the data set.
______________________
docno This variable is the docket number of the case. The two digits before the dash is the year in which the case was appealed to or filed with the Supreme Court. This number after the dash will always have four digits. These four digits are place holders unless the number actually reaches the thousands. Examples include:
16-1403 – An appeal filed in 2016
17-0014 – An appeal filed in 2017
11-0037 – An appeal filed in 2011
N.B. Docket Numbers also have a two-letter designation – “DA,” “OP,” “PR,” or “AF.” These should be dropped from the value entered for this variable. Be certain to include the “dash” between the two-digit year and the four-digit number.
______________________
frstct This variable indicates the first court that heard or decided the case. It is likely to be the District Court, but it could be a “Justice Court” or a Justice of the Peace Court.
1 = Justice Court/Youth Court (This is a Dist. Ct. acting as the Youth Court. See the Notes in lwrct)
2 = District Court
3 = Montana Supreme Court (this applies to courts rules and regulations or professional disciplinary actions.
4 = Board, Commission, or specialized court such as a Municipal Court, the Water Court, or the Workman’s Compensation Court.
N.B. This value is likely to be found in the early paragraphs of the opinion where the Opinion outlines the facts of case, either in an introductory section or in a section labeled something like “Factual Background.”
N.B. There may no information about a Justice Court’s action in the opinion, even if the proceeding had to have originated in the Justice Court. DO NOT code this variable as a “1” unless there is explicit reference to Justice Court action in the case.
______________________
lwrct This variable is the court from which the case was appealed to the Supreme Court. Most often this will involve a District Court number. This variable should be indicated if a District court heard the case, even though it might not have originated there. See frstct.
0 = This value pertains to cases that originated in the Supreme Court.
1 = 1st Judicial District
2 = 2nd Judicial district
3 = 3rd Judicial District.
…
22 = 22nd Judicial District
30 = Montana Water Court
40 = Montana Workers Compensation Court
50 = Commission of Practice (This commission deals with complaints filed against lawyers.)
60 = Other (E.g., A federal court certification of a question to the Sup. Ct. State or Local Board or Commission.)
N.B. If frstct is designated as “1” because the District Court is acting as a Youth Court, this variable (lwrct) should be coded with the District Court number (as usual), rather than using the “60” designation.
This particular coding scheme is also relevant when a parent’s parental rights are being considered or terminated by the Supreme Court. That is because the Dist. Ct. is originally acting as a Youth Court to determine if the Youth is In Need of Care (YINC) and whether parental rights should be terminated or conditioned (limited) in some way.
______________________
noiss This variable is the number of issues that the Court indicates it considers. This is NOT the number the appellant presented. Usually the opinion will identify the issue(s) the Court considers in the opinion. Sometimes this variable will have to be determined by reading most or all of the opinion.
______________________
oplngth This variable is the length of the majority opinion, in pages that include the front matter and are presented as 8.5 x 11 inch page size of the PDF reported in Justia. Count as the last page, the page on which the justices identified as supporting or concurring in the majority opinion are listed.
______________________
N.B. Opinions end with a typed or written signature of the writing justice and a list of those justices concurring in that opinion. That may be the end of the document. That is the point from which this variable should be taken. It may not be the last page of the opinion if there is a concurring opinion or a dissenting opinion, that additional opinion may begin on the next page of the opinion. Do not count the following pages for purposes of this variable.
______________________
opwrtr This variable indicates the name of the justice who wrote the opinion in each case. This list is in order of seniority.
This is the code for the 2017 calendar year.
2017-0 = the opinion/ruling was not signed (e.g. per curium)
2017-1 = Chief Justice McGrath
2017-2 = Justice Baker
2017-3 = Justice Gustafson
2017-4 = Justice McKinnon
2017-5 = Justice Rice
2017-6 = Justice Sandefur
2017-7 = Justice Shea
2017-8 = Michael Wheat
This is the code for the 2007 calendar year.
2007-0 = the opinion/ruling was not signed (e.g. per curium)
2007-1 = Chief Justice Gray
2007-2 = Justice Cotter
2007-3 = Justice Leaphart
2007-4 = Justice Morris
2007-5 = Justice Nelson
2007-6 = Justice Rice
2007-7 = Justice Warner
______________________
pnl This variable is the count of Justices participating in each case. The number is usually five (5) justices or 7 (seven) justices. However, there are times when one justice is absent. In other cases, district court judges are assigned to the panel if one or more of the panel justices recuses (removes) themselves. In a few cases there is more than one justice removed. Count each district court judge as a full, participating member of the panel.
______________________
pnl2 This variable collapses pnl into two categories – Five and seven justice sets. The five-justice set may involve less than five justices and the seven-justice set may involve six or seven justices.
______________________
prec This variable is to be coded as indicated below. The Court will decide some cases and indicate that they are decisions in the case, BUT are not to be used for precedent in other cases. An example of the citation (cite) for such an opinion is 2015 MT 443N
In all such cases the first, full paragraph of the opinion in the case will begin with the sentence:
Pursuant to Section 1, Paragraph 3(c), Montana Supreme Court 1996 Internal Operating Rules, the following decision shall not be cited as precedent. . . .
0 = no “N” is present in the citation (cite)
1 = “N” is present in the citation
______________________
prtype This variable is the type of proceeding the Supreme Court dealt with in each case. It is derived from the Docket Number letter designation.
1 = DA (Direct Appeal)
2 = OP (Opinion)
3 = AF (Administrative Filing)
4 = PR (Professional Responsibility)
9 = Other (This applies when the Docket Number does not contain any letter designation at all.)
N.B. If a Court case is labeled AF, then a good many of the other variables on this row of data will be coded uniquely (e.g., appnt, opwrtr, respnt, subj, submtr, and type.)
______________________
respnt This variable is the type of responding party in the appeal. It is largely comparable to the appntcategories. Be careful to note that the first name on a case may NOT be the Respondent but rather the Appellant. Some of these categories re NOT the same as the appnt cartegories.
1 = Private Individual (This includes prisoners or convicted criminals appealing the rulings of the trial court as well as citizen in civil cases. This also includes a lawyer petitioning the Court regarding their bar status.)
2 = State or local official. For example, sheriffs, county prosecutors, the State Auditor or the Director of the Dept of Corrections.
3 = A company or partnership doing business in Montana. This includes law firms.
4 = Not-for-profit organization, public interest group, Indian Tribe
5 = representative of a class (This will be indicated by a name plus the statement “other similarly situated.”)
6 = Individual as a Representative of an Estate
9 = no Respondent involved in this case. (This most often relates to proceedings that are titled “Matter of X X X.” )
______________________
result This variable is the outcome or the result of the Supreme Court’s decision. This variable will be found at or near the end of each opinion. It may be one word, easily recognized. It may be contained in a paragraph.
0 = Filed with Supreme Court originally (no District Court decision.)
1 = Affirmed
2 = Affirmed in part and reversed in part
3 = Reversed (and remanded)
4 = Vacated and Remanded
5 = Adopted/Submitted for Comments (This category relates to proposed rules the Court is considering relating to the operation of the judicial system in the state. These rules may be Supreme Court Rules, rules relating to the District Courts, or to the practicing bar in the state.)
6 = Dismissed (E.g., mootness or lack of jurisdiction or standing)
7 = Denied (This largely relates to a Petition for a Writ of Habeas Corpus.)
______________________
strtdate This variable is the date coded as mm/dd/yy that the case was filed with the Court. This date is located on the front page (the frontmatter) of each opinion. This is not the date the Clerk of the Court received the filings in the appeal. It will be indicated as the date the case was “Submitted on the briefs” or was Argued Orally. See decdate for an example. An example would be:
04/26/17
N.B. There may be no strtdate for those decisions with a docket number designated as “AF’ or “PR.” Leave this variable blank if that is the case.
______________________
strtmnth This variable is the month the case was submitted to the Court for decision. It should correspond to the month indicated in the strtdate variable.
1 = January
2 = February
3 = March
4 = April
5 = May
6 = June
7 = July
8 = August
9 = September
10 = October
11 = November
12 = December
______________________
subj This variable indicates the nature of the question presented to the Court.
1 = substantive law
2 = procedural issue
3 = constitutional law
4 = both procedure and substance
5 = both substantive and constitutional
6 = both procedural and constitutional
7 = equity
9 = other issue
N.B. This variable will be difficult to assign if here is more than one issue identified in the case. Use your best judgment.
______________________
submtr This variable indicates the subject matter that is raised in the appeal. Any of these subjects can present the Court with procedural rather than substantive questions. If subj is coded as procedure, then this variable can still be coded substantively.
1 = contract, employment, debt, mortgage, and the like
2 = tort, personal injury, damages for injury
3 = property, ownership of land or items (chattels)
4 = criminal conviction, sentencing, parole
5 = equitable remedy/injunction/restraining order/termination of rights/dissolution of marriage/youth in need of care (YINC)/
6 = jurisdiction or other procedural issue
7 = habeas corpus/post-conviction relief
8 = Public Regulation/Policy
9 = other
______________________
type This variable indicates the type of case involved.
1 = Civil
2 = Criminal
3 = Other (This category relates to administrative proceedings, the declaration of a Youth in Need of Care (YINC), divorce decrees, or equitable remedies.)
______________________
vote This variable indicates the size of the majority vote. This variable usually will be coded either 5 or 7. If there is a dissent in the case, then the vote will be coded as the number of justices who voted in the majority. This includes concurrences since that justice voted with the majority. The values below are likely to be those recorded for this variable. Others may be possible and should be entered.
3
4
5
6
7
N.B. There will be some cases in which one or more district court judges will be serving on the Supreme Court. That is because one or more Supreme Court justices have recused themselves from the case. These district court judges count just the same as a Justice does for this variable.
N.B. The value of this variable will be the same or less than the value for the pnl variable.
______________________
vt This variable indicates whether the decision was unanimous and whether the decision involved concurring opinions.
0 = unanimous
1 = not unanimous
2 = unanimous with concurrence
3 = not unanimous with concurrence
4 = not unanimous with concurrence and dissent (This might be one justice “concurring in part and dissenting in part” or one or more justice(s) concurring and at least on other justice dissenting.)
______________________
year This is the year the Supreme Court decided a case.
2007
2017
______________________
https://github.com/osuoer/open-judicial-politics/raw/master/McLauchlan-data.xlsx
- There are fifty-one judicial systems in this country. That includes the federal judicial system, which is by far the most extensively studied. There are some outstanding works on state courts. These include Tarr & Porter (1988) and Porter & Tarr (1982). There have been other typical examinations of state courts. Some of these focus on a set of substantive decisions by state courts—for example, Sohn (2012). A good deal of attention has been given to state court elections because of variations in judicial selection systems in states. See, for example, Hall (2015) and Hall & Bonneau (2008). Still other work on state courts treats comparative actions by those courts in connection with various substantive decisions and doctrines. See, for example, Brace, Langer & Hall (2000); Berry & Wysong (2012); and Lindquist & Pybas (1998). These exemplify categories of research that have been conducted on state supreme courts. ↵
- At this time, eleven of the fifty state courts have two-tiered systems like Montana’s. See Neubauer and Meinhold (2017) at table 4.3. ↵
- Montana Constitution Art. VII, §3(1). ↵
- Montana Code Annotated §3-2-101 (hereafter cited as MCA). The 1979 amendment is §1, Ch. 683, L. 1979. ↵
- These appendices are the codebook for the data and the data. There is also a set of suggestions for future research on either the Montana Supreme Court or another state high court. ↵
- This discussion is based on the Montana Constitution Art. VII and the MCA §3-2-ff. ↵
- MCA §3-2-302: “Any decision must be concurred in by a majority of the justices of the court.” ↵
- Conference will be used throughout this discussion to refer to all seven members of the court. ↵
- This process is similar to how the US Supreme Court dockets cases using a rule of four. On the Montana Supreme Court, it is a rule of three. ↵
- IOR §I.3.(c)(i). A memorandum opinion is not “citable as binding precedent”; it is published in the public domain and is obviously binding on the parties and the lower court involved in the case. ↵
- The data for this study were collected by the author and by a class of undergraduates at the University of Montana during fall semester 2018. Time constraints required the development and use of this limited (two-year) data set. Given the number of cases examined and coded for these two years (N = 692), the empirical picture from this analysis present a valid quantitative comparison. It is often the case with empirical research that the available data are limited or their collection is short of perfect. ↵
- Those variables were “subj” and “submtr.” Examine the codebook to see how these were categorized. It should be evident that some variation in coding these variables is possible. Variable names are often peculiar. Rarely can the name be a full description of the variable. A brief acronym is the usual method of labeling each variable. As with the two variables identified here, there is a difference in how the subject matter of the appeal is classified for these two variables, which is indicated in the codebook. ↵
- These collapsed variables are labeled in the data set as “variablename2.” ↵
- These collapsed variables are labeled in the data set as “variablename2.” ↵
- A case that is “carried over” is one that was not decided during the calendar year under study. That could be because of the appeal occurring late in the year or because the case was very complex, requiring a great deal of time to decide. ↵
- This last statement may be somewhat misleading. That is because the court’s memorandum opinions do constitute decisions on the merits, whereas the dismissals and remands are not decisions on the merits at all. The important point is that the court has fashioned procedures that allow it to siphon off segments of its business in ways that relieve it from a good deal of detailed work. ↵
- Montana has district courts in each of its fifty-six counties (Montana Constitution Art. VII, §4). However, the constitution permits the state legislature to draw “district” boundaries to include multiple counties. As a result, there are twenty-two judicial districts that encompass one to seven counties each (MCA §3-5-101). The geographically largest district is District 16, which includes seven counties and therefore seven separate district courts. One judge covers all these counties. ↵
- De novo treatment of a case means the district court started the case again “from the beginning.” ↵
- It should be noted that from this point in the analysis, the number of cases in the data set (N = 692) are reduced to those that are reported rather than the totals that were given in various the tables presented in this analysis. ↵
- The districts identified below contain all the population centers in the state. These are not necessarily large urban cities in the usual sense. This table indicates the 2017 population and the proportion of the state population in the relevant districts. ↵
- It should be noted that table 3 is statistically significant—that is, the p-value is less than .05 (p < .05). In other words, the displayed pattern between appellant and appellee most likely did not occur randomly or by chance. While this discussion does not rely on the statistical significance of the data, it is worthwhile to note. The statistical significance is also misleading here because some of the cells in some tables contain small numbers of values. ↵
- The preceding footnote (#20) applies here. ↵
- The extreme appeal was one case that presented thirteen issues. The Court decided only one of those. ↵
- In comparison, the median proportion of unanimous decisions by the US Supreme Court between 1948 and 2017 was 30 percent. ↵
- Since there are no data in this set regarding the voting patterns of each justice, it is not possible to make any judgments about which justices were the “dissenters” in 2007 or in 2017. Those data need to be collected and added to the set before additional analysis can be made of this phenomenon. ↵
- There are various ways to count the length of opinions. The method used here was to count any portion of a typed double-spaced page as reported in the database: https://law.justia.com/cases/montana/supreme-court/. A more elaborate and satisfactory method would be a word count of opinion length. ↵
- This table indicates the proportion of unanimous decisions during the two years. This permits some comparison with table 9. There is some difference in the proportion of unanimous decisions during the two years; however, it is not a very great difference. It is unlikely that there was more disagreement among the justices between 2007 and 2017. ↵
- The means and medians for time required to render decisions for the three categories of cases are as follows: (link to table) ↵
