Public Opinion
10 Citizen Knowledge and the U.S. Supreme Court
Understanding the Importance of Visual and Verbal Knowledge and Their Implications for the Supreme Court in American Democracy
Anne Lippert; Justin Wedeking; and Ryan C. Black
(Earlier versions of this research were presented as papers at the 2015 Southern Political Science Association Conference in New Orleans, LA, January 15–17; the 2016 Southwestern Political Science Association conference in Las Vegas, March 23–26; and the University of Kentucky Department of Political Science Colloquium (November 2015). We thank Kevin McGuire, Kenneth Fernandez, and colloquium participants at Kentucky for providing helpful comments.)
The fundamental role that citizen knowledge plays in American democracy is one of the most important and oft studied topics in the last 70 years. This is likely because conceptualizations of a healthy democracy fundamentally depend on some notion of an informed citizenry. More simply, democracy is only possible if citizens possess enough knowledge to hold government leaders accountable. While the importance of knowledge for voter turnout, vote choice, and public opinion has been well documented (e.g., Delli Carpini and Keeter 1996), legal scholars have only begun to scratch the surface in thinking about what citizen knowledge means for the courts.[1]
In a rare exception, Gibson and Caldeira (2009b) argue that the public’s knowledge has been systematically underestimated for decades due to challenges in measuring it. They find the question format (multiple choice versus open-ended) matters for how knowledgeable the public appears as well as how strict (or lenient) scholars are when interpreting open-ended answers. At the same time, other research indicates there are different components to political knowledge that may provide alternative roads to democratic-civic competence. Specifically, Prior (2014) finds that some people store political knowledge visually and that visual knowledge can be as important as verbal knowledge. Together, these findings open the door for novel and interesting questions about the role of citizens in a democracy. In this chapter, we ask, What are the implications of political knowledge for the Supreme Court? To address this question, our chapter answers a smaller question. How does visual knowledge influence perceptions of the Supreme Court?
We begin by making an argument for why citizen knowledge matters in the context of the US Supreme Court. It is relatively easy to see why political knowledge is important when it comes to deciding which candidate to vote for. If a person is deciding which candidate will provide better representation on a range of issues, a more knowledgeable person will, all else equal, make a better decision (Lau and Redlawsk 1997). However, it is less obvious why we should care about citizen knowledge as it relates to the judiciary, especially the federal judiciary, since those judges serve appointments for life. In fact, the “third branch” was, at least partly, designed to be less responsive to (or insulated from) public opinion. Yet, we argue, citizen knowledge is important for the Supreme Court for at least two important reasons.
Perhaps the most important reason starts with the simple recognition that the Supreme Court plays a fundamental role in shaping our daily lives. Year after year, the Court hands down decisions on a range of issues, with most of them gaining little publicity. Yet these decisions shape and constrain our behaviors, curtail or expand our rights and liberties, are responsible for significant economic gains and losses, and control the balance of power between the state and federal government. This recognizes the Supreme Court as a key branch in a larger government framework that is responsible for the laws and policies of the country. Knowing and understanding how the system works and knowing the Court’s role and powers within that system are a crucial and necessary first step to understanding how citizens can hold political leaders accountable.
Second, citizen knowledge is important because of its direct links to government processes that directly connect to the judiciary. The most obvious examples are confirmation hearings of federal judges and justices. Confirmations are two-step processes, and both steps are relevant for citizen knowledge and attentiveness. The first step occurs when there is a vacancy on the federal bench and the president nominates someone to fill that position. There are many examples of nominations intersecting with presidents making campaign promises about either the Court or elections where the Supreme Court became a major issue. For example, in 1980, Ronald Reagan made a campaign promise to nominate the first woman to the Supreme Court, and he followed through with his nomination of Sandra Day O’Connor in 1981. In 2020 Joe Biden campaigned on a promise to nominate the first Black woman to the Supreme Court, and he followed through by nominating Ketanji Brown Jackson in 2022. And, of course, the Supreme Court was a centerpiece of the 2016 presidential election. When Justice Antonin Scalia died in February 2016, the Senate did not act on Merrick Garland, Obama’s nominee to replace Scalia. Instead, the Republican-controlled Senate announced that the winner of the 2016 presidential election (Donald Trump or Hillary Clinton) would get to fill the vacancy. After winning, Trump nominated Neil Gorsuch. Knowledge of these events would mean the voter would understand the “raised stakes,” so to speak, that with their vote, they would be selecting more than just a president.
The second step in the process is that the Senate must confirm the nominee. As part of this process, the Senate holds hearings to review the nominee’s record and ask questions of the nominee. These questions range from constitutional interpretation, the nominee’s knowledge, and their views of different areas of the law as well as their past behavior on or off the bench (Farganis and Wedeking 2011; Collins and Ringhand 2013). They may even ask whether the nominee supports vampires or werewolves![2] This questioning is important because research shows that public opinion of the nominee influences how senators vote on the nominee (Overby et al. 1992; Kastellec, Lax, and Philips 2010). Thus, having an informed citizenry is essential to following these hearings, making evaluations, and then communicating these opinions to senators. In fact, because confirmation hearings are often seen as a national dialogue on the current state of the Constitution, this is where citizens can play a small role in shaping the Constitution.
Our goal in this chapter is to explore the connection between knowledge, with a focus on visual knowledge, and perceptions of the Supreme Court. The first section starts by measuring knowledge of an important population—college students—and establishes a baseline of their knowledge, ascertaining whether a visual image enhances an individual’s knowledge. We find that receiving a picture alone does not increase knowledge, but we do find that subjects get higher knowledge scores when asked via multiple-choice format.
In the second section, we then wonder whether all visual images are the same. Perhaps our failure to find evidence of a visual knowledge effect was simply due to the pictures we selected. We argue that some visual images may contain clues that help identify the relevant knowledge domain for an individual. We draw on research that shows the importance and power of symbols for citizens when evaluating the Supreme Court (Gibson, Lodge, and Woodson 2014). Using an experiment, we test whether the presence of a legal symbol in a picture (a judge’s robe in this case), compared to a picture with no symbol, increases citizens’ knowledge. We find that it does.
Although these results are important in their own right, we agree with Luskin (2002), who notes that it is important to show how and why knowledge matters. Thus, in the last section we demonstrate why knowledge holds important implications for court scholars. We show that citizens who possess different and contrasting knowledge types (e.g., high in visual knowledge but low in verbal knowledge) structure their perceptions of the then current nine justices in a different manner compared to other knowledge types. We conclude by discussing the implications of citizen knowledge and the courts.
Political and Visual Knowledge
One question about the capacity of citizens to function and thrive in a democracy has concerned scholars for many decades: Do citizens possess the capacity to govern themselves effectively? Answers from early empirical research painted a grim portrait. Citizens seemed to possess little political knowledge and exhibited weak organization of the little knowledge that they did possess, where an opinion in one policy area was not likely to be consistent with opinions in other areas (Berelson, Lazarsfeld, and McPhee 1954; Campbell et al. 1960; Converse 1964). These findings carried enormous normative implications for traditional standards of democracy that emphasized the necessity of high levels of participation and knowledge. Because of these seminal findings, scholars began focusing on finding explanations that would account for the apparent low levels of knowledge in the citizenry. As Luskin (1987) and Delli Carpini and Keeter (1996) note, these research agendas typically focused on one or more of these three areas: ability, opportunity, and motivation. Gradually, scholars shifted their efforts in a slightly new direction to answer the original question and focused on the use of information shortcuts (heuristics) and informational processing (e.g., Lupia 1994; Zaller 1992). Other scholars focused on the measurement of knowledge and measurement error in survey questions and respondents’ answers (e.g., Achen 1975; Erikson 1979; Judd and Milburn 1980; Converse 1980; Judd, Krosnick, and Milburn 1981; Zaller and Feldman 1992).
Understanding the importance of visual political knowledge is relatively new in political science. Visual knowledge is like someone saying, “I can’t remember someone’s name, but I can clearly see their face and…” While this may seem obvious to many people, it was not until recently that political scientists studied how visual knowledge might play a role in civic competence. Prior (2014) argues that traditional-style questions used to measure knowledge rely on a person having a strong verbal link to their cognitions. These questions result in our knowledge measures being heavily favored toward individuals with what he calls strong verbal knowledge. In contrast, Prior argues that some individuals have a more visual cognitive style, where the key linkages to their cognitions are visual.
To test these arguments, Prior performed several experiments and found support for several propositions. First, he found that adding a visual image to an otherwise identical knowledge question increased the likelihood of a correct answer. Second, the size of the effect varied depending on the subgroup. For example, for those in groups that have been shown to have a knowledge gap—women, older people, the less formally educated, and people with a visual cognitive style—a visual image either significantly reduced or eliminated the knowledge gap of the subgroups. Third, Prior demonstrated that visual knowledge was as indicative of civic competence as verbal knowledge. Taken together, these findings suggest that to understand the link between citizen knowledge and the Court, we also need to incorporate visual knowledge. This is important because, as Prior found, some individuals prefer a visual cognitive style.
Exactly why visual images might be particularly helpful in measuring legal knowledge is something we will elaborate upon soon, but the gist is that we believe the presence of legal symbols in pictures will play a role in increasing the likelihood of correctly answering knowledge questions. For now, however, we state our initial hypothesis: Visual images (as opposed to no images) will increase the likelihood of a correct answer.
Research Design and Methods
To begin, we conducted an experiment in June 2014 with 213 undergraduate students as subjects.[3] We asked subjects four questions in which they were given the name of a prominent political or legal figure, and then we asked them if they could identify the job the person held. These are standard political knowledge questions that are regularly asked on the American National Election Studies surveys and have an “objectively” correct answer.[4] We asked subjects to identify the jobs, as of June 2014, of Joe Biden (vice president), John Boehner (Speaker of the House), David Cameron (prime minister of the United Kingdom), and John Roberts (chief justice of the United States).[5] Each of these four individuals was, for several years prior to the survey, in the news often and should be relatively easy for most attentive followers of politics.
For our research design, we experimentally manipulate two factors that we think will impact citizen knowledge. Subjects received (1) a visual image of the person or not and (2) an open-ended answer format or a multiple-choice format that had five possible answer choices. For the multiple-choice questions, four of the answer choices were plausible answers and a fifth category was listed as “none of the above.”[6] Because we are manipulating two factors and each factor has two options, this is commonly referred to as a 2 × 2 experiment, which has a total of four experimental conditions. Importantly, subjects were randomly assigned for each question. This means that the assignment to each of our conditions was independent across the four questions. That is, a subject could see a picture and be given a multiple-choice question for, say, Biden but then have no picture and an open-ended question for Roberts and so on. Lastly, because we are interested in comparing knowledge levels as a function of the four experimental conditions, this is commonly referred to as a between-subjects design.[7]
Subjects came from four classes at a large Midwestern university, three of which were political science classes. Of the four classes, two were large, general introductory political science courses; another was an upper-division judicial politics course; and the fourth was an upper-division interdisciplinary course on research methods.
Scoring the answers on the multiple-choice response formats was straightforward: a response was correct if the subject identified the correct job out of those listed. Scoring the responses for the open-ended questions presented a bit more difficulty, as we sought to avoid the problems that have plagued previous efforts identified by Gibson and Caldeira (2009b). To that end, we were generous and awarded credit even if an answer was not completely correct. For example, we scored as correct respondents who identified Boehner as simply “speaker,” but we did not count as correct if someone only said “judge” for John Roberts (“justice,” however, would have earned credit).
Our dependent variable is whether the subject answered each question correctly. Because the dependent variable is binary (0 or 1), the appropriate statistical technique is to use a probit regression. This method allows us to estimate the likelihood (or probability) of whether the subject answered correctly, with the four treatment conditions serving as the main explanatory variables of interest. It also allows us to include statistical controls, which we did for both the specific individual a respondent was asked about and the class from which the respondent was drawn.[8] More generally, the benefit of our empirical approach is that it allows an easy comparison across conditions. For example, we will be able to tell which of our four conditions produces higher or lower levels of knowledge. Our approach also provides us with an intuitive quantity of interest to measure knowledge—in this case, the probability a person gets a correct answer.
Results
Because our independent variables of interest are mutually exclusive dummy variables, we focus on predicted probabilities to describe our results. (A full table of parameter estimates is in the appendix.) We portray these results graphically in figure 1. The y-axis denotes the probability a respondent correctly identifies the queried individual’s job. The x-axis identifies the four possible combinations of question format and picture presence for each question.
Broadly speaking, these results provide strong support for the importance of question formatting but fail to demonstrate that providing an individual’s picture increases their likelihood of providing a correct response. When a respondent was presented with a name only and asked to provide a textual (i.e., open-ended) response, she had a 0.69 probability of giving a correct one. In addition, another way to evaluate these estimates is to examine their 95% confidence intervals. For example, the 95% confidence interval ranges from 0.63 to 0.76. This generally means that if we were to repeat this study a very large number of times, 95% of the results from this very large number of studies would live between values of 0.63 and 0.76. It is analogous to the /− that you (hopefully) see reported when reading about polls. Hereafter, we will put the 95% confidence intervals in brackets immediately after the point estimate.[9]
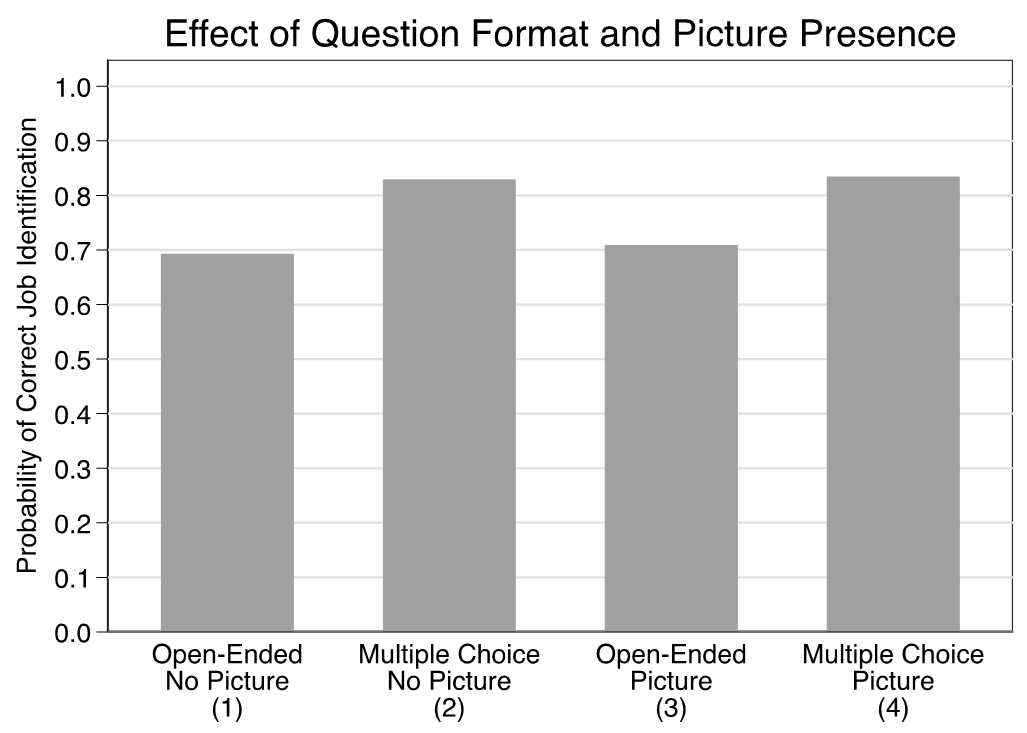
Exchanging the open-ended question for a multiple-choice format increases the likelihood of a correct response to 0.83 (0.78, 0.88)—about a 20% relative increase that is statistically significant. We observe a nearly identical increase when switching between open-ended and multiple-choice questions for individuals who were also presented with the individual’s picture (0.71 [0.65, 0.77] vs. 0.83 [0.78, 0.88]).[10]
As the figure makes clear, however, when we hold the question type constant and examine the impact of the presence of a picture (i.e., 1 vs. 3 and 2 vs. 4), we see essentially zero difference in terms of a respondent’s likelihood of correctly identifying the individual’s job. For the open-ended condition, we observe a small increase in the likelihood of correctly answering a question when the respondent is presented with a picture (0.71) versus when they are not (0.69), but the difference between the two does not approach conventional levels of significance (p = 0.71, two-tailed test). For the multiple-choice condition, the point estimates are identical (i.e., 0.83).[11]
In summary, first, our results validate previous work on measuring knowledge that multiple-choice answer formats increase knowledge scores. Second, visual images did not significantly contribute to increased knowledge, and this was the case across all four individuals that we asked about.[12] This creates an interesting puzzle. If respondents were not helped by images yet we know that some people prefer a visual style, how might visual knowledge be relevant for legal scholars?
Symbols and Visual Knowledge
We argue that domain-relevant cues might be important for enhancing knowledge. It is like having a hint when answering a trivia question. Having a cue that helps a person locate the relevant stored cognitions, we argue, is important in the legal domain because of the unique symbols that populate the legal world. In their research on understanding legitimacy evaluations of the Supreme Court, Gibson and Caldeira (2009a) argue that symbols play a powerful role. Specifically, they argue that whenever people pay attention to the Supreme Court or information about it, they are usually exposed to powerful visual symbols of judicial authority and legitimacy that can increase support for the Court. These symbols include such things as the robe, the gavel, and the cathedral-like court building (see also Gibson, Lodge, and Woodson 2014). This suggests that adding a legal symbol to a visual image should help a subject establish a linkage to the legal knowledge domain and access the relevant stored cognition. Given this, we hypothesize that adding a powerful legal symbol to a visual image will increase the likelihood of a correct answer.
In a preliminary examination of this symbol hypothesis, in the same experiment described above, we randomly assigned subjects to receive either a picture of Justice Clarence Thomas with his robe on (where he is posing for a picture) or a picture of him in professional clothes without his robe (where he is facing the camera with an office background). We note that this appears similar to common pictures for many politically elected officials and that there is even a symbol in its background, the American flag, that is commonly used by elected politicians.
The two pictures we used can be seen at the links listed in the footnote.[13] What is different about this stimulus is that since all subjects were given a visual image of Clarence Thomas, we did not give them his name and instead asked, “Who is this person, and do you know what job or political office they currently hold?” Answers were scored such that anything close to being accurate was coded as correct. Overall, 50% of the subjects were able to correctly list his job as a Supreme Court justice (or some variant of that), but only 33% were able to correctly give his name (this percentage includes those individuals who only gave a last name or first name).
Starting with Thomas’s name identification, 22% of subjects assigned to the no robes condition provided a correct response. By contrast, fully 45% of those assigned to the with robes condition were correct—a relative difference of more than double. This difference is both statistically and substantively meaningful. Results for his job identification were even more staggering. Among those who saw Thomas without judicial robes, just 28% were able to correctly identify his job. For those who had the added cue of his robes, the percentage jumped to 70%, which is an increase by a factor of 2.5 (and is statistically significant).
While this test is supportive of the idea that domain-relevant visual cues might enhance knowledge, it is only one test, and it featured a relatively well-known justice who, in 2014, was the only Black justice on the Supreme Court. It raises concerns about whether we would find similar results if we were to do the same experiment on the other justices. To that end, we conducted a second experiment in June 2015 with approximately 137 undergraduate students as subjects. Subjects came from two classes at a large Midwestern university. One class was a general introductory political science course that is taken by mostly political science majors, while the other was an upper-division interdisciplinary social science course. We did the same experiment on seven of the then current justices: Samuel Alito, Ruth Bader Ginsburg, Elena Kagan, Anthony Kennedy, Antonin Scalia, Sonia Sotomayor, and Clarence Thomas.[14] Subjects were randomly assigned to receive a picture of each justice dressed in either judicial robes or professional clothes (like a business suit). When scoring the answers, we again rewarded subjects with a correct answer if they were close, even counting “judge” as a correct answer for job.
Figures 2 and 3 visualize our results for the justice name and job tasks, respectively. Each x-axis identifies the justice that a respondent saw a picture of, and the y-axis shows the proportion of individuals who correctly identified the justice’s name (figure 3) or job (figure 4). Respondents who saw a photograph without robes were represented by gray bars, while respondents who saw a photograph with robes were represented by black bars. The symbols appended to a justice’s name in the figures denote whether the difference between the no robes and with robes conditions was statistically significant. The caret symbol (i.e., ^) corresponds to a significance level of 0.10, and the asterisk (i.e., *) indicates a significance level of 0.05.
Starting with figure 2, among the seven justices we presented photographs of to our respondents and asked them to name, we found a statistically significant robe effect for four: Justices Ginsburg, Kagan, Kennedy, and Sotomayor. This is to say that respondents who saw each of these justices photographed in their robes were significantly more likely to correctly name that justice as compared to respondents who saw them photographed without their robes. The substantive magnitude of these effects is sizable as well. For example, just 7% of those who saw Kennedy in a suit were able to correctly identify him. The analogous value among those who saw Kennedy in his robes was roughly 19%—a sizable increase by a factor of 2.7. We observe similar robe effects for Ginsburg, Kagan, and Sotomayor. We also see evidence of Ginsburg’s “Notorious RBG” status, which started in 2013. Our respondent’s ability to identify her even without her robes matched (or even exceeded) their ability to identify other justices with their robes. Even still, it is also worth noting that fully 60% of respondents could not identify Ginsburg with robes on.[15]
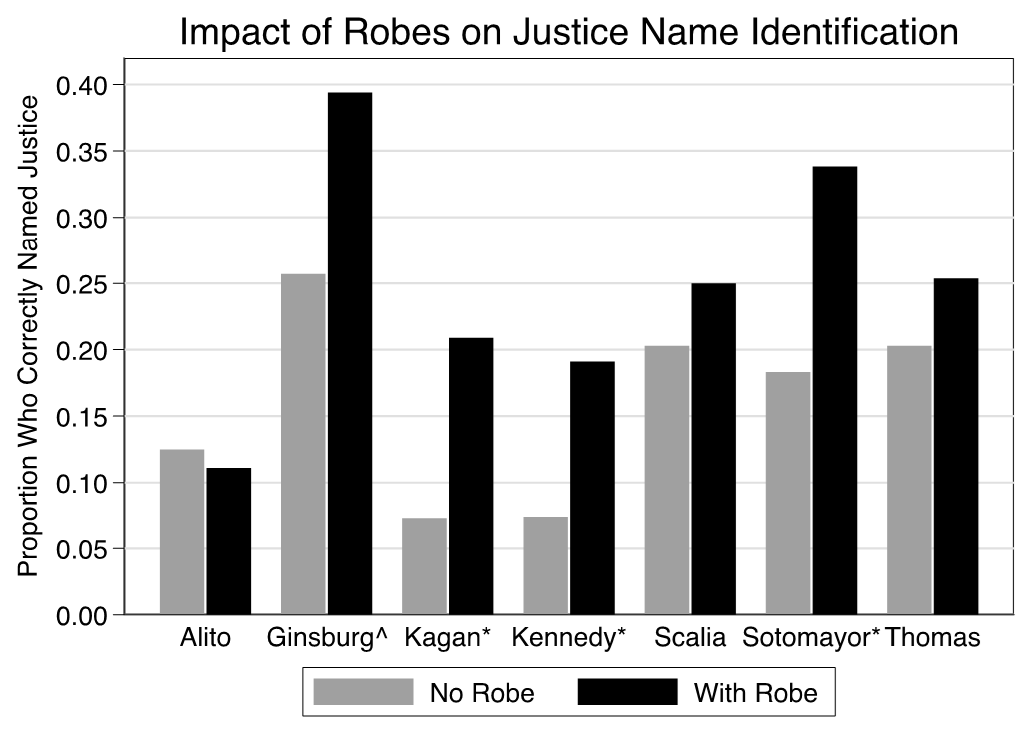
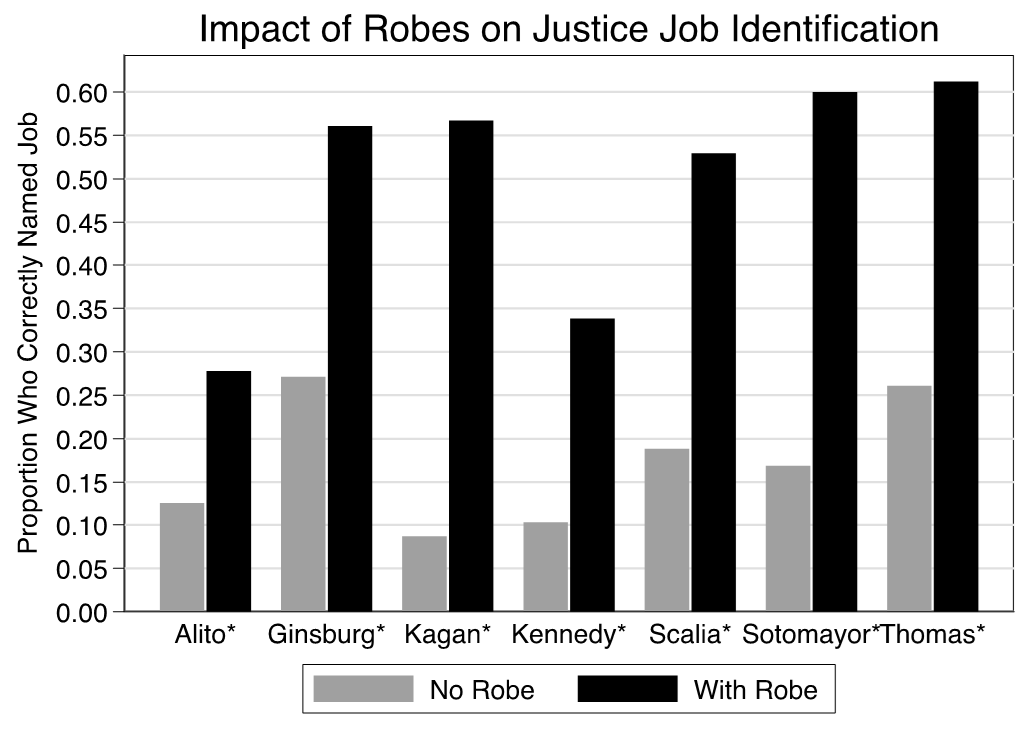
Figure 3 showcases the results of our job identification question. Perhaps unsurprisingly, we find plentiful evidence that showing a justice in their robes ultimately enhances a respondent’s ability to identify said individual as a Supreme Court justice. Indeed, for all seven justices examined, respondents were significantly more likely to successfully identify a justice as a justice when presented in robes versus not. Unlike the effect of robes on name identification, which was largely consistent across justices, we see some differences across justices in both the magnitude of the effect and how successful respondents were in the with robes condition. In this regard, compare the robe effect for Elena Kagan, where there is more than a sixfold increase in job identification (and a majority who get her job correct), with that of Samuel Alito, who, despite doubling his job recognition, still had less than 30% right.
Viewed together, these results suggest that different images likely matter in terms of evaluating knowledge. Given this, we believe it provides evidence that visual knowledge likely holds implications for how people think about the Supreme Court.
Why Knowledge Matters for the Judiciary: Perceptions of the Justices
In this section, we directly examine the differences between how high- and low-knowledge subjects, among both visual and verbal knowledge types, view Supreme Court justices. In other words, do individuals with high-verbal but low-visual knowledge structure or organize their perceptions differently than individuals who are high on visual but low on verbal knowledge? This is important because of how citizens learn about the Court and make judgments about legitimacy when they receive information about the Court’s outputs. If they receive most of their information in the form of news stories, presuming most news stories contain judicial symbols like a robe, and if symbols are more likely to make a cognitive connection, then understanding how these individuals may organize their perceptions differently is an important task.
To answer this question, we use an analysis technique known as pathfinder associative networks to examine people’s conceptual view of Supreme Court justices. Pathfinder is a technique that sorts data into scales originally developed for the analysis of proximity or distance data in psychology (Schvaneveldt, Durso, and Dearholt 1989). By using a pathfinder network, we provide a different analytical approach to examine whether views of the Supreme Court differ by knowledge type and level. If we find evidence of a difference, then this supports previous research findings (e.g., Gibson 2007; Gibson and Caldeira 2009b) and also adds to the field by providing a novel perspective of how knowledge and perceptions of the Supreme Court intersect.
Pathfinder takes the data and constructs a network. Construction of a pathfinder network begins with the researcher providing a proximity matrix, which generally represents how similar subjects deem a number of pairwise comparisons. For example, Schvaneveldt, Durso, and Dearholt (1989) asked a sample of students to rate how similar they thought 25 natural concepts were to one another on a nine-point scale. These concepts included words such as color, green, animal, and deer. Each student saw all unique pairwise combinations (e.g., color-green, color-animal, color-deer, and animal-deer) and rated how distinct/similar they were on a nine-point scale. As one would anticipate, respondents found more similarity between the color-green pairing than the green-deer pairing. For us, our proximity matrix comes from all pairwise comparisons of the nine justices (that is 36 total comparisons).
Specifically, we asked our subjects in our first experiment to assess, using a five-point scale, the relatedness of each of the 36 unique pairwise combinations of the then current members of the Court. That is, a respondent was asked to compare Alito and Scalia, Alito and Ginsburg, Alito and Breyer, and so on. Pairings were presented to all subjects in the same order, but this order was randomly generated (as opposed to presented in alphabetical order). The ratings given by a particular participant for a particular pair of justices were then used to calculate dissimilarity or distance between pairs of justices.[16]
One nice attribute of pathfinder is that it takes the pairwise distance data and generates a visual network of the results, where each justice corresponds to a node (e.g., there will be nine nodes), and network links are added based on the patterns of similarities. Since we ask subjects to rate the similarities/differences between justices, pathfinder will take this data and, where it finds “close” relationships between two justices, connect those justices in the network. For the justice pairs that pathfinder finds as “distant,” it will not connect those pairs in the network.[17]
We are substantively interested in examining whether different types of knowledge (e.g., visual versus verbal) and different levels of knowledge (e.g., high vs. low) have any implications for how citizens perceive the Court. Thus, we need to create four separate networks that correspond to those different knowledge types, which are (1) high visual, high verbal; (2) low visual, low verbal; (3) high visual, low verbal; and (4) low visual, high verbal. To generate these four networks, we simply use the two knowledge scales created above (i.e., verbal and visual) to classify each of our subjects as being either high or low.[18]
To compare networks, we start with an objective baseline that we can use for understanding perceptions of the Supreme Court, which we call our “gold standard.” We derived this network using data taken from the Supreme Court Database (Spaeth et al. 2022) for the 2010–14 terms that indicated how often justices voted together (i.e., both voted for the majority or both voted for the dissent). To do this, we constructed a nine-by-nine similarity matrix where each entry indicated the proportion for which two pairs of justices voted together. We then converted this matrix into a distance matrix using the same city block metric as above. The pathfinder algorithm then used this distance matrix to create a network representation of the justices. Figure 4 contains the gold standard network derived from justice voting data (4a) as well as the four ratings-derived networks (4b–e), one each for the high- and low-knowledge groups for each knowledge type. Nodes represent the justices on which subjects were asked to provide similarity ratings, and links between justices indicate participants viewed these justices as similar.
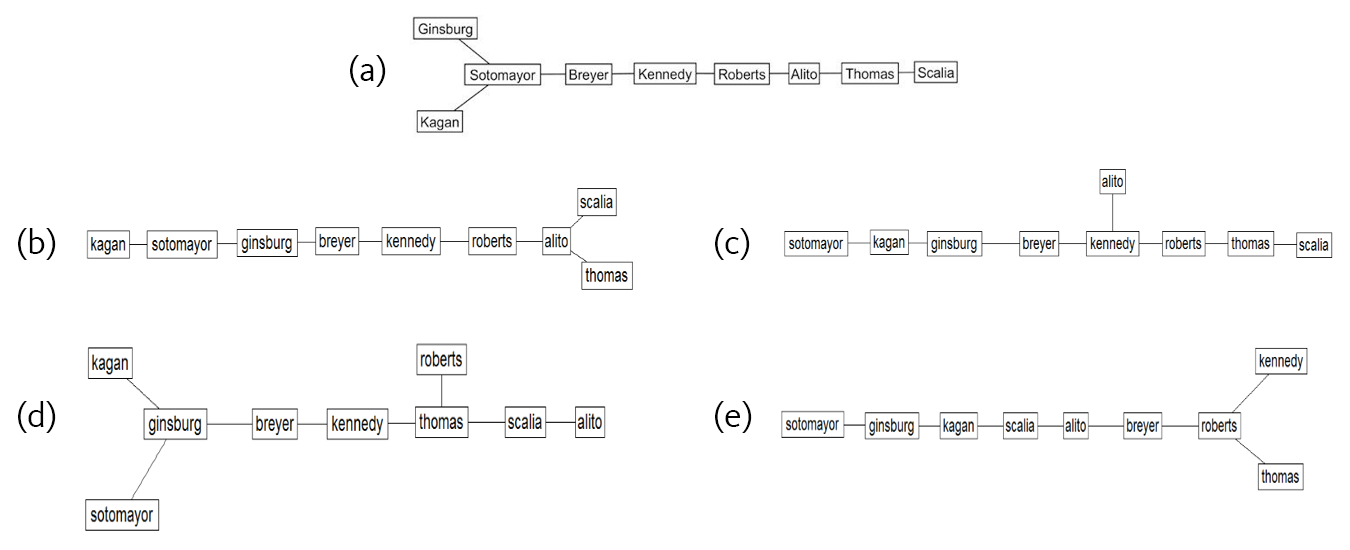
Before taking a closer look at each of the four knowledge networks, it should be pointed out that physical location in the networks does not represent a precise distance between two nodes. Instead, how “closely” related two concepts are is determined by the number of links between them. For example, in figure 4b (high-visual, high-verbal knowledge), there are three links between Breyer and Alito but only one link between Breyer and Kennedy. Thus, Breyer and Kennedy are perceived to be more closely related than Breyer and Alito. Furthermore, if we use the same assumptions made in the literature, then we can make inferences about the perceived relative ideological space. For instance, using the same example (4b), we can measure how moderately perceived Alito and Kennedy are relative to each other by counting the number of links away each is from Breyer. Alito is perceived as less moderate than Kennedy because Alito is three links away from Breyer, but Kennedy is one link away.
When we visually scan the networks in figure 4b–e, it appears that the type and amount of knowledge an individual has affects their perception of the Supreme Court justices. Furthermore, by comparing the networks in figure 4b–e to the gold standard network in figure 3a, we can see how far from justices’ actual behaviors these perceptions are. The high-visual, high-verbal knowledge network portrayed in panel (b) has a clear, distinct separation of justices along ideological lines that matches those found in the gold standard network in panel (a). For both (a and b) networks, there is a conservative group containing Roberts, Alito, Thomas, and Scalia and a liberal group with Kagan, Breyer, Ginsburg, and Sotomayor. Both networks also place Kennedy in between the two ideological clusters, consistent with numerous media portrayals of him as the “swing” or “median” justice. The main differences in the networks have to do with the relationships of the justices to one another within their ideological cluster. For example, in the gold standard network (4a), Ginsburg and Breyer are two links apart. However, in the high-visual, high-verbal network (4b), they are more closely associated with only one link between them.
More starkly, we see a complete breakdown of ideological clusters that occurs in the low-verbal, low-visual knowledge network shown in panel (e). This network is characterized by “odd” groupings of nodes that are not found in the gold standard network. By “odd,” we mean that two justices are perceived to be similar (as evidenced by a connecting link) that would not typically be thought of by people with a basic knowledge of the Court’s decisions. For example, Breyer, who marks the start of the liberal cluster in the gold standard network (4a), is linked with two conservatives—Roberts and Alito—in figure 4e, the low-visual, low-verbal knowledge network. Even more puzzling, although the conservative Scalia is linked with the conservative Alito, he is also linked with the liberal-leaning Kagan. Furthermore, Kennedy appears at the end of the network rather than in the middle, where we would typically find the more moderate justices. In short, the knowledge group in figure 4e seems to have a somewhat random organization.
In networks that have some component of high knowledge (e.g., panels [c] and [d]), we see two distinct clusters of justices among ideological lines. However, both networks have some peculiar aspects that suggest important differences from the gold standard network. In the interest of space, we have moved the remaining discussion of figure 4 to the appendix. Suffice it to say, we can conclude that each network represents a different structure of knowledge. Readers may find it difficult, however, to assess by visual inspection alone whether, say, the high-visual, low-verbal network or the low-visual, high-verbal network was more similar to the gold standard network. Without getting into the details here, it is possible to make formal comparisons of the network structures. We did this, and the results are shown and discussed in the appendix. The results support our earlier discussion.
Conclusion
Political knowledge and its direct connection to the functioning of government has been a concern and source of debate for a long time. Moreover, political knowledge is an important concept that is vital for answering many normative and empirical questions. Understanding that there are different types of knowledge and that those different types hold important implications for how we perceive the political and legal world suggests that we have yet to fully understand and flesh out the broad implications of knowledge and politics (see also Barabas et al. 2014).
The main goal of this chapter was to demonstrate that political knowledge has implications for the Supreme Court. To accomplish that, we demonstrated that people with different knowledge types will structure their perceptions of the justices differently. It is clear that more knowledgeable subjects clearly viewed the justices in terms of an ideological relationship, clustering the liberal and conservative justices together, respectively. Others differed in their visual and verbal knowledge.
We believe that this last finding holds important promise for future research in understanding some of the long-standing debates in the legal field about the relationship of legitimacy to the Court and its decisions. Specifically, if some people are more visually oriented and tend to inform themselves through that channel, then when they receive information about a Court decision, that new information may not interact with their cognitive structure in the same way that a person who is more reliant on their phonological memory for doing so. While this is purely speculative at this point, we note it seems to be a fruitful area for future research.
Learning Activity
- With a partner, open a news website and identify two articles that have a judicial theme (e.g., articles about judges, courts, or a recent case or decision). Take note of whether the stories have images and, if so, how many images and how they are displayed. Is there anything distinctive about the images that would make it easier for a person to integrate that article into their knowledge? Do the images seem “memorable”? Why or why not?
- Research has shown that having more political knowledge will influence how people evaluate new information about political candidates running for political office. With a partner, discuss how having more knowledge will influence how people evaluate judges and courts. Given that the above research shows that different knowledge types structure their perceptions of the Court differently, will some people be better able to make use of new information? If so, which groups?
- Take the short knowledge quiz (below) that consists of both visual and verbal questions (answers appear at the beginning of the appendix). Do you score better on one than the other? Did you feel as though the presence (or absence) of visual cues helped you in any way?[19]
- What job does this individual hold?

- CEO of cryptocurrency Cardano
- Owner of soccer premier league team Newcastle United FC
- President of Ukraine
- US secretary of defense
- None of the above
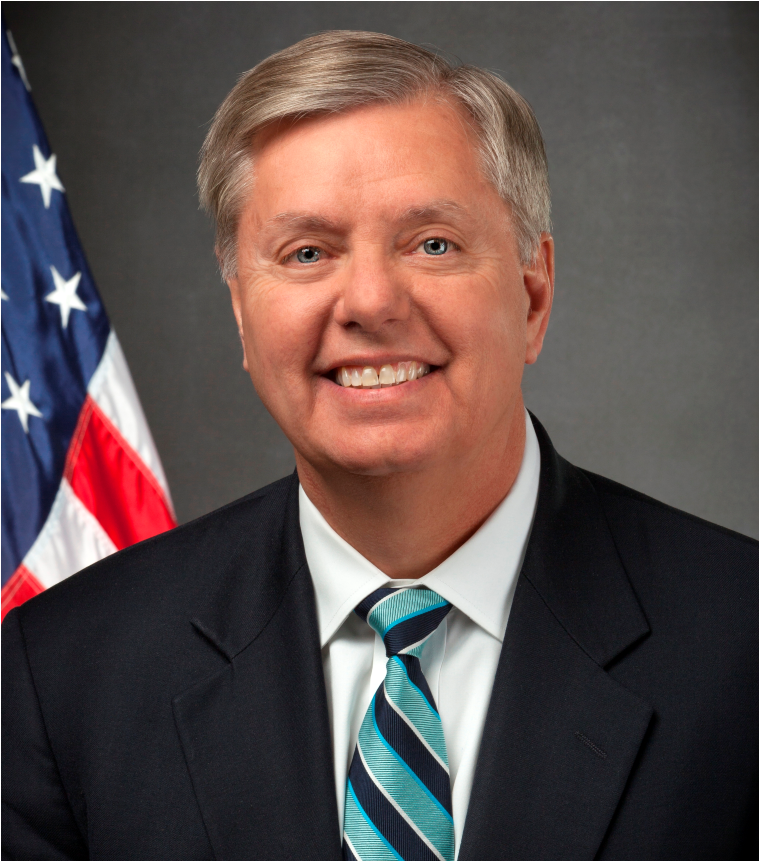
- Who is this individual?
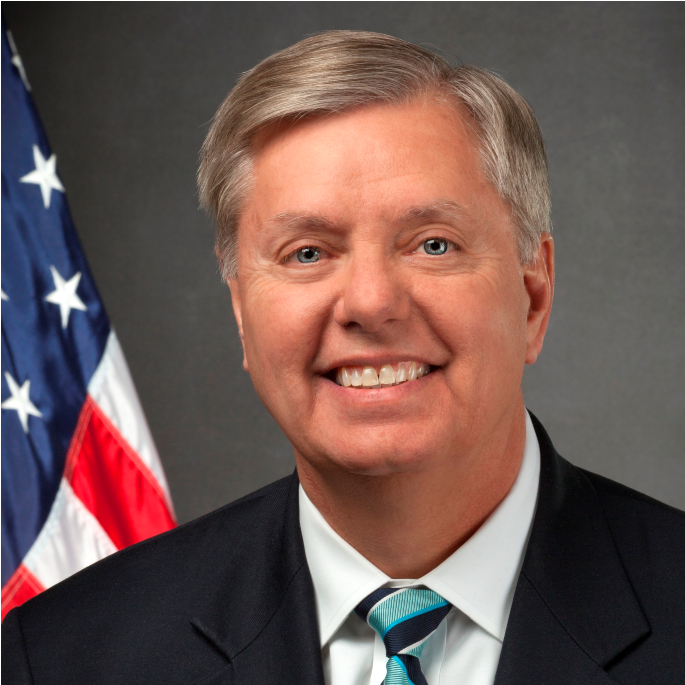
- Andrew Draper
- Lindsey Graham
- Timothy Johnson
- Charles Ostrom
- None of the above
- And what job does he currently hold?
- Governor of Iowa
- Secretary of the treasury
- US federal judge
- US senator
- None of the above
- What government building is this?
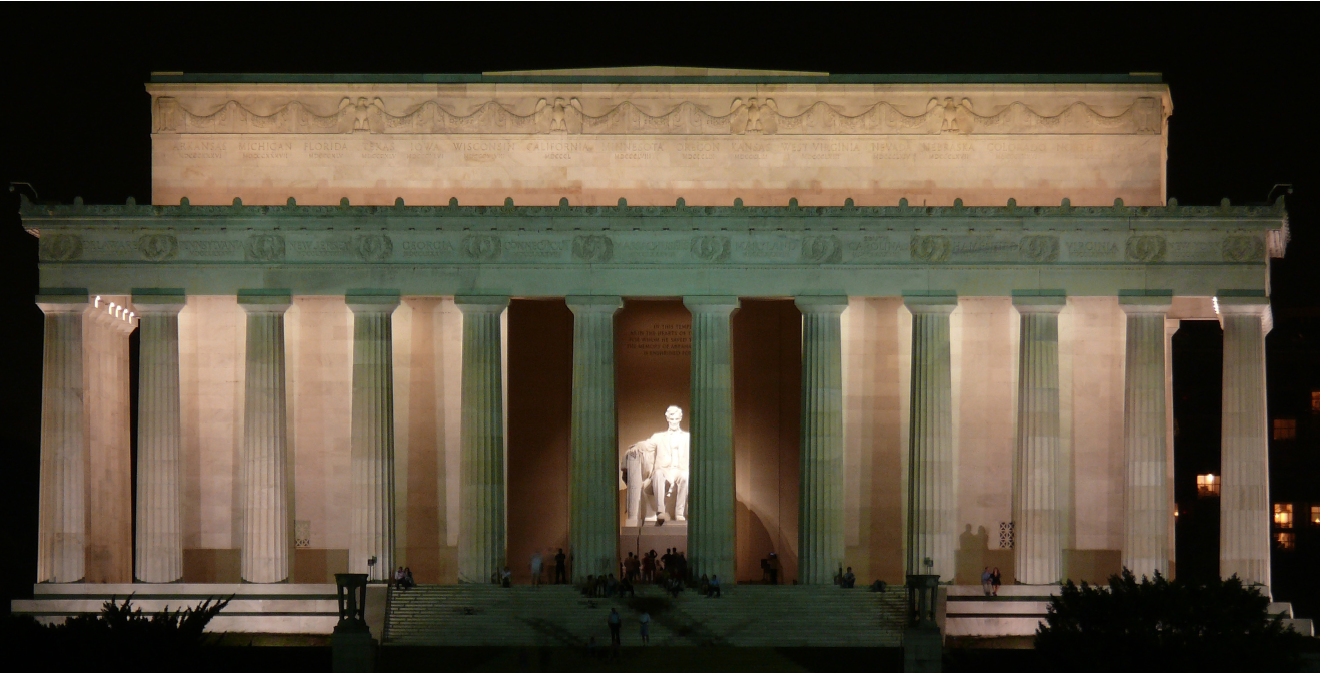
- Jefferson Memorial
- Roosevelt Memorial
- Temple for Perpetual Peace
- Washington Memorial
- None of the above
- Who is the attorney general of the US?
- William Barr
- Francis Biddle
- Merrick Garland
- Richard Olney
- None of the above
- How many votes are needed to win the Electoral College?
- 50
- 100
- 270
- 538
- None of the above
- How many justices have to vote to grant certiorari to hear a case?
- Zero
- Four
- Five
- Nine
- None of the above

References
Achen, Christopher H. 1975. “Mass Political Attitudes and the Survey Response.” American Political Science Review 69 (4): 1218–31.
Austin, Peter, and Janet E. Hux. 2002. “A Brief Note on Overlapping Confidence Intervals.” Journal of Vascular Surgery 36 (1): 194–95.
Barabas, Jason, Jennifer Jerit, William Pollack, and Carlisle Rainey. 2014. “The Question(s) of Political Knowledge.” American Political Science Review 108 (4): 840–55.
Berelson, Bernard R., Paul F. Lazarsfeld, and William N. McPhee. 1954. Voting. Chicago: University of Chicago Press.
Bizer, George Y., Jon A. Krosnick, Richard E. Petty, Derek D. Rucker, and S. Christian Wheeler. 2000. “Need for Cognition and Need to Evaluate in the 1998 National Election Survey Pilot Study.” National Election Studies Report, Ohio State University.
Cacioppo, John T., Richard E. Petty, Jeffrey A. Feinstein, and W. Blair G. Jarvis. 1996. “Dispositional Differences in Cognitive Motivation: The Life and Times of Individuals Varying in Need for Cognition.” Psychological Bulletin 119 (2): 197–253.
Campbell, Angus, Phillip E. Converse, Warren E. Miller, and Donald E. Stokes. 1960. The American Voter. New York: Wiley.
Collins, Paul M., Jr., and Lori A. Ringhand. 2013. Supreme Court Confirmation Hearings and Constitutional Change. Cambridge: Cambridge University Press.
Converse, Phillip E. 1964. “The Nature of Belief Systems in the Mass Publics.” In Ideology and Discontent, edited by David E. Apter, 206–61. New York: Free Press.
Converse, Philip E. 1980. “Comment: Rejoinder to Judd and Milburn.” American Sociological Review 45: 644–46.
Delli Carpini, Michael X., and Scott Keeter. 1996. What Americans Know about Politics and Why It Matters. New Haven: Yale University Press.
Downs, Anthony. 1957. An Economic Theory of Democracy. New York: Harper.
Druckman, James N., and Cindy D. Kam. 2011. “Students as Experimental Participants.” Cambridge Handbook of Experimental Political Science 1: 41–57.
Erikson, Robert S. 1979. “The SRC Panel Data and Mass Political Attitudes.” British Journal of Political Science 9 (1): 89–114.
Farganis, Dion, and Justin Wedeking. 2011. Law & Society Review 45 (3): 525–59.
Gibson, James L. 2007. “The Legitimacy of the U.S. Supreme Court in a Polarized Polity.” J. Empirical Legal Stud. 4 (3): 507–538.
Gibson, James L., and Gregory A. Caldeira. 2009a. Citizens, Courts, and Confirmations: Positivity Theory and the Judgments of the American People. Princeton: Princeton University Press.
Gibson, James L., and Gregory A. Caldeira. 2009b. “Knowing the Supreme Court? A Reconsideration of Public Ignorance of the High Court.” The Journal of Politics 71 (2): 429–41.
Gibson, James L., Milton Lodge, and Benjamin Woodson. 2014. “Losing, but Accepting: Legitimacy, Positivity Theory, and the Symbols of Judicial Authority.” Law & Society Review 48 (4): 837–66.
Judd, Charles M., Jon A. Krosnick, and Michael A. Milburn. 1981. “Political Involvement and Attitude Structure in the General Public.” American Sociological Review 46: 660–69.
Judd, Charles M., and Michael A. Milburn. 1980. “The Structure of Attitude Systems in the General Public: Comparisons of a Structural Equation Model.” American Sociological Review 45: 627–43.
Kastellec, Jonathan P., Jeffrey R. Lax, and Justin H. Philips. 2010. “Public Opinion and Senate Confirmation of Supreme Court Nominees.” The Journal of Politics 72 (3): 767–84.
Lau, Richard R., and David P. Redlawsk. 1997. “Voting Correctly.” American Political Science Review 91 (3): 585–98.
Lippman, Walter. 1922. Public Opinion. New York: Macmillan.
Lupia, Arthur. 1994. “Shortcuts versus Encyclopedias: Information and Voting Behavior in California Insurance Reform Elections.” American Political Science Review 88 (2): 63–76.
Luskin, Robert C. 1987. “Measuring Political Sophistication.” American Journal of Political Science 31: 856–99.
Luskin, Robert C. 2002. “From Denial to Extenuation (and Finally Beyond): Political Sophistication and Citizen Performance.” In Thinking about Political Psychology, edited by James H. Kuklinski, 281–305. Cambridge: Cambridge University Press.
Luskin, Robert C., and John G. Bullock. 2011. “‘Don’t Know’ Means ‘Don’t Know’: DK Responses and the Public’s Level of Political Knowledge.” The Journal of Politics 73 (2): 547–57.
Mondak, Jeffery J. 2001. “Developing Valid Knowledge Scales.” American Journal of Political Science 45 (1): 224–38.
Overby, L. Marvin, Beth M. Henschen, Michael H. Walsh, and Julie Strauss. 1992. “Courting Constituents? An Analysis of the Senate Confirmation Vote on Justice Clarence Thomas.” American Political Science Review 86 (4): 997–1003.
Prior, Markus. 2014. “Visual Political Knowledge: A Different Road to Competence?” The Journal of Politics 76 (1): 41–57.
Roth, Volker, Julian Laub, Klaus-Robert Muller, and Joachim M. Buhmann. 2002. “Going Metric: Denoising Pairwise Data.” Advances in Neural Information Processing Systems 15: 817–24.
Schvaneveldt, Roger W., ed. 1990. Pathfinder Associative Networks: Studies in Knowledge Organization. Norwood, NJ: Ablex.
Schvaneveldt, Roger W., Francis T. Durso, and Donald W. Dearholt. 1989. “Network Structures in Proximity Data.” Psychology of Learning and Motivation 24: 249–84.
Sears, David O. 1986. “College Sophomores in the Laboratory: Influences of a Narrow Data Base on Social Psychology’s View of Human Nature.” Journal of Personality and Social Psychology 51 (3): 515.
Spaeth, Harold J., Lee Epstein, Andrew D. Martin, Jeffrey A. Segal, Theodore J. Ruger, and Sara C. Benesh. 2022. Supreme Court Database, Version 2022, Release 01. http://Supremecourtdatabase.org.
Vanderhoof, Erin. 2019. “Is the Story of Clarence Thomas an American Tragedy?” Vanity Fair, September 19. https://www.vanityfair.com/style/2019/09/corey-robin-enigma-of-clarence-thomas-interview.
Wedeking, Justin, Anne Lippert, and Ryan Black. 2015. “(Re)Discover the Value of Nodes and Links: How Networks Can Further Law & Courts Research.” Law and Courts: Newsletter of the Law and Court Section of the American Political Science Association 25 (1): 6–10.
Wouters, Pieter, Erik D. van der Spek, and Herre van Oostendorp. 2011. “Measuring Learning in Serious Games: A Case Study with Structural Assessment.” Educational Technology Research and Development 59: 741–63.
Zaller, John R. 1992. The Nature and Origins of Mass Opinion. Cambridge: Cambridge University Press.
Zaller, John R., and Stanley Feldman. 1992. “A Simple Theory of the Survey Response: Answering Questions versus Revealing Preferences.” American Journal of Political Science 36 (3): 579–616.
Appendix: Knowledge Quiz Answers
Need for Cognition
This is a psychological construct used below in the validation section. The four questions for the need for cognition index are below. Subjects read each statement and were asked to indicate the extent the statement is characteristic of them on a five-point scale, ranging from “extremely uncharacteristic of you” (1) to “somewhat uncharacteristic” (2) to “uncertain” (3) to “somewhat characteristic” (4) to “extremely characteristic” (5). Note that the first, second, and fourth statements were reverse-scored to be consistent with the third statement, such that high values indicate individuals high in their need for cognition.
- I would prefer simple to complex problems.
- Thinking is not my idea of fun.
- I like to have the responsibility of handling a situation that requires a lot of thinking.
- I only think as hard as I have to.
Verbal Knowledge Questions
There are three verbal knowledge questions. Responses were scored correct when only the correct answer was given (e.g., in the first question, only “definitely appointed” counts as correct):
Some judges in the US are elected, others are appointed to the bench. Do you happen to know if the justices of the US Supreme Court are elected or appointed to the bench?
- Definitely elected
- Probably elected
- Not sure
- Probably appointed
- Definitely appointed
Some judges in the US serve for a set number of years, while others serve a life term. Do you happen to know whether the justices of the US Supreme Court serve for a set number of years or whether they serve a life term?
- Definitely set years
- Probably set years
- Not sure
- Probably life term
- Definitely life term
How many justices are on the US Supreme Court?
- 5
- 7
- 9
- 11
- None of the above
Visual Knowledge Questions
The first two questions were the Justice Clarence Thomas ones discussed above, and the third question was a multiple-choice question that asked subjects to identify Justice Stephen Breyer.
Trust in Government
Subjects were asked three questions on trust in government:
How much of the time do you think you can trust the government in Washington to do what is right—just about always, most of the time, or only some of the time?
Would you say the government is pretty much run by a few big interests looking out for themselves or that it is run for the benefit of all the people?
Do you think quite a few of the people running the government are crooked, not very many are, or hardly any of them are crooked?
Political Efficacy
Subjects were asked to rate their agreement to two questions on a four-point scale: strongly disagree, disagree, agree, strongly agree. The two questions were the following:
Sometimes politics and government seem so complicated that a person like me can’t really understand what’s going on.
People like me don’t have any say in what the government does.
Picture Identification Probit Parameter Estimates
See the caption to figure 1 for information regarding significant differences across values of the experimental treatment. In terms of the individuals whom respondents were asked about, the probabilities were Biden (0.95), Boehner (0.79), Cameron (0.67), and Roberts (0.66). All differences except the one between Roberts versus Cameron were statistically significant (p < 0.05, two-tailed test). As for classes where respondents were recruited from, they were (1) Introduction to Political Science (0.78), (2) Judicial Politics (0.89), (3) Research Methods (0.71), and (4) Introduction to American Politics (0.80). Significant differences were 1–2, 2–3, 2–4, and 3–4.
| Coefficient | Robust SE | |
|---|---|---|
| Multiple choice, no picture | 0.503* | 0.147 |
| Open-ended, picture | 0.053 | 0.137 |
| Multiple choice, picture | 0.527* | 0.151 |
| Biden question | 1.313* | 0.185 |
| Boehner question | 0.449* | 0.132 |
| Cameron question | 0.053 | 0.129 |
| Judicial Politics student | 0.555* | 0.205 |
| Research Methods student | −0.227 | 0.134 |
| Introduction to American Politics student | 0.098 | 0.155 |
| Constant | 0.146 | 0.159 |
Observations 848
Pseudo R2 0.134
Log likelihood −396.062
Note: The omitted baseline categories are open-ended, no picture (treatment), John Roberts (individual queried), and lower-division general introduction to political science (where respondent was recruited from). * denotes < 0.05 (two-tailed test). “SE,” which appears in the far right column, is an abbreviation for standard error.
Visual Knowledge and Statistical Power
The basic difference Prior found between visual and nonvisual conditions was relatively small—about a 0.03 increase in probability. To have an 80% chance of recovering even a 0.05 difference between visual and nonvisual conditions, one would need to have just over 1,000 observations per condition (i.e., about 2,000 total). With about 850 usable responses, our sample size is below half of what would be needed. Given our sample size, we have roughly a 0.44% chance of recovering a 0.05 difference between the two conditions if it actually exists. At the same time, however, we can be reasonably confident that there is no large difference between the visual and nonvisual conditions. Given our sample size, we have enough data to recover a 0.08 difference between the two 80% of the time. We performed these power calculations using the power two proportions command in Stata. Our baseline control portion was set at 0.72, which represents the overall average proportion of correct responses within our survey experiment. If one were to raise the baseline proportion to a very large value, like, say, 0.92, then the power would go way up. Conversely, reducing it to 0.50 would cause the power to be at the lowest possible value. Ask your statistics professor about why this is true.
Validating the Distinction of Visual and Verbal Knowledge
Up to this point, a skeptical reader might argue that visual and verbal knowledge are the same concept. In this section, we show, with our data, that the two concepts are different types of knowledge and only weakly related at best. We demonstrate this by displaying how the two knowledge types—visual and verbal—correlate with each other and three different constructs that are used in public opinion research: trust in government, political efficacy, and the need for cognition. Establishing that they are different concepts is an important first step to then, in the next section, examine how different knowledge types influence how subjects view the Supreme Court.
Political efficacy is generally described as how much an individual feels he or she can understand what is going on in politics or government and believes that he or she has a say in what the government does. For efficacy, we note the seemingly obvious theoretical overlap between efficacy and knowledge and thus expect efficacy to correlate with both visual and verbal knowledge. Trust in government measures the amount of trust people have in the government; however, we do not see any obvious correspondence with knowledge. For example, we think trust in government is possible in people with high and low levels of verbal and visual knowledge. Thus, we do not expect trust to correlate with either type of knowledge. Testing the correlation between efficacy and trust with our knowledge types is important because, if the results come out as expected, then we can have confidence that our knowledge measures are tapping into what we think is knowledge because they are behaving as past research suggests they should behave.
The need for cognition originated in psychology. Cacioppo et al. (1996, 197) define it as “an individual’s tendency to engage in and enjoy effortful cognitive endeavors.” Perhaps most relevant for our purposes here, Bizer et al. (2000) found that need for cognition was positively associated with political knowledge items. Specifically, those knowledge items were verbal knowledge items, not visual knowledge questions. Given that this construct identifies individuals who like to think, we think people who score high on this measure should have a stronger link to their phonological memory. Along the same lines, Prior (2014) found verbal knowledge correlates with people who have a preference for a verbal cognitive style and not a visual cognitive style. Thus, we expect that need for cognition should significantly correlate with verbal knowledge but not visual knowledge. This is an important test to distinguish between the two types of knowledge.
We use multiple questions to measure each concept: three questions for trust in government, two for political efficacy, and four for need for cognition. They can be seen earlier in the appendix.
To construct measures of visual and verbal knowledge. We used three measures for each. For visual knowledge, we used the two-part question for Justice Thomas and a third question that gave subjects four pictures and asked them to identify Justice Stephen Breyer. We summed the number of correct answers for these three questions. For verbal knowledge, we asked three questions that are common to the literature and can be seen earlier in the appendix. For both indicators, we simply summed the total correct answers, giving each measure a range from 0 (no correct answers) to 3 (all correct answers).
Table 2 shows the results of our validation. The first column shows that need for cognition is significantly related to verbal knowledge but not visual knowledge. This is consistent with our expectations and also Prior’s (2014) findings where he looked at people with a preference for a verbal or visual style. The fact that need for cognition correlates with one type of knowledge but not the other provides evidence that the two concepts are distinct from one another.[20] Furthermore, both knowledge types do not correlate with trust in government (where higher values indicate less trust in government).
| Need for cognition | Trust in government | Political efficacy | |
|---|---|---|---|
| Visual knowledge | 0.03 (p = 0.65) | −0.06 (p = 0.41) | 0.18 * (p = 0.01) |
| Verbal knowledge | 0.20* (p = 0.01) | −0.01 (p = 0.81) | .22 * (p = 0.01) |
Note: Entries represent pairwise correlation coefficients. n = 211. The correlation between visual and verbal knowledge is 0.29 (p = 0.001). * denotes p < 0.05.
In the final column, we show further predictive validity by showing that both knowledge types are correlated with our measure of political efficacy. This is to be expected, as those individuals who feel strongly in control of their political future are the ones we would expect to seek out more information and be more knowledgeable (and less apathetic). In short, the two knowledge types are real and distinct from each other. Finally, the correlation between the two knowledge types is modest at 0.29 (p = .001), further suggesting they are related yet distinct.[21] This suggests that visual knowledge may play an important role in understanding citizen’s evaluations of the Court.
Extended Discussion of Networks in Figure 4a–e
The high-visual, low-verbal knowledge network (panel [c]) has a liberal wing of Sotomayor, Kagan, Ginsburg, and Breyer and a conservative wing of Roberts, Thomas, and Scalia that match those of the gold standard network. Unlike the gold standard network, however, Alito is not fully integrated into the conservative cluster. Rather, he is linked only to Kennedy, who is typically considered a swing vote and, as such, is closely connected (i.e., one link away) from the start of the liberal cluster.
The low-visual, high-verbal knowledge network (panel [d]) also has the same conservative and liberal groupings as the gold standard network, and we also see Kennedy linking the two clusters. One difference between the high-verbal, low-visual knowledge network and the gold standard network is the placement of Thomas. Thomas is on the far right of the conservative cluster in the gold standard network but is closer to the middle of the high-verbal, low-visual network. On the liberal wing, Ginsburg is seen as being a key link between Kagan and Sotomayor, unlike in the gold standard network, where Kagan is the go-between for Sotomayor and Ginsburg.
That networks for both high verbal, low visual and high visual, low verbal clustered to some degree along ideological lines and the low-verbal, low-visual network did not suggests that knowledge, independent of type, plays a role in an ideological perception of the Supreme Court justices.
Formal Network Comparisons
To compare network structures in a formal test, we calculated the structural similarity, S, between each pair of networks (Wouters, van der Spek, and van Oostendorp 2011). Structural similarity varies from 0 to 1 and is the ratio of the number of links shared by two networks over the number of links found in either of the two networks. This measure follows a probability distribution (hypergeometric), and in this way, we can use values from this distribution to determine whether the similarity between two networks is greater than what is expected by chance. Similarity values between the 10 pairs of networks and their significance values are shown in table 3.
| Network 1 | Network 2 | Similarity | p value |
|---|---|---|---|
| Gold standard | High visual, high verbal | 0.60 | 0.0003** |
| Gold standard | High visual, low verbal | 0.33 | 0.047** |
| Gold standard | Low visual, high verbal | 0.23 | 0.182 |
| Gold standard | Low visual, low verbal | 0.14 | 0.349 |
| High visual, high verbal | High visual, low verbal | 0.33 | 0.047** |
| High visual, high verbal | Low visual, high verbal | 0.33 | 0.047** |
| High visual, high verbal | Low visual, low verbal | 0.23 | 0.182 |
| High visual, low verbal | Low visual, high verbal | 0.45 | 0.006** |
| High visual, low verbal | Low visual, low verbal | 0.23 | 0.182 |
| Low visual, high verbal | Low visual, low verbal | 0.33 | 0.047** |
Note: ** indicates significance at the p < 0.05 level
The similarity values support our conclusions when comparing networks. The high-visual, high-verbal network was most similar to the gold standard network (S = 0.60), surpassing chance expectations (p < 0.001). Only the high-visual, low-verbal network was also significantly similar to the gold standard network but less so than the high-visual, high-verbal network (S = 0.33, p = 0.047). This finding, along with our finding that the low-visual, high-verbal network and the low-visual, low-verbal network were significantly similar (S = 0.33, p = 0.047), supports the notion that visual knowledge plays a larger role in perceiving justices ideologically. Interestingly, the high-visual, low-verbal network and the low-visual, high-verbal network were significantly similar (S = 0.45, p = 0.006), suggesting a reliance on a third, shared knowledge component when making judgments about Supreme Court justices. In general, understanding the contributions of verbal and visual knowledge to perceptions of the Supreme Court is important for understanding how citizens interpret new information about a decision, how they attribute responsibility, and whether they update their legitimacy evaluations.[22]
While this section shows that subjects have structured their perception of the justices differently according to their knowledge type, it is reasonably easy to foresee how a different perception of the current legal world would lead subjects to make different judgments. We mentioned one aspect above about how it may influence attributions of responsibility and legitimacy judgments. It may, in effect, play a role in helping explain why, for many years, the public had such a high and sustained approval of the Supreme Court relative to the other institutions. While that is beyond the scope of this chapter, we note it is an area ripe for future research (see also Wedeking, Lippert, and Black 2015).
- We use sophistication and knowledge interchangeably and adopt a standard definition of knowledge—the quantity of stored, accurate cognitions (for other definitions, see Luskin 2002). ↵
- This really happened. In 2020 Senator Amy Klobuchar (D-MN) asked Elena Kagan where she stood on the Twilight Saga and whether main character Bella should choose Edward the vampire or Jacob the werewolf. Kagan refused to reveal her view! ↵
- While there is some concern that relying on college students for an experimental sample may present problems for making causal inferences because of the uniqueness of college students’ characteristics compared to a random sample of adults (Sears 1986), evidence shows that students do not pose an intrinsic problem and only in very limited situations would samples of college students pose a problem for the validity of a study (Druckman and Kam 2011). ↵
- There are other types of knowledge measures, like correctly perceiving the ideological placement of the president or a body of Congress, but we will not get into those aspects. ↵
- We used standard publicly available headshots for each of these four individuals. Biden, Boehner, and Cameron wore suits. Roberts’s picture showed him in a judicial robe. In what follows, we examine the symbolic effect of robes on our subjects’ political knowledge. ↵
- It is worth noting that when measuring political knowledge, some favor using fewer response options—commonly three—and most cite reasons of reliability (Mondak 2001), though we think providing fewer options results in contamination from “accurate” guessing, which is observationally equivalent to a guess in which the subject knew the answer but was not 100% sure. Providing more response options reduces the likelihood of contamination from guessing while still providing a fixed-choice response. We also did not discourage “don’t know” choices because research by Luskin and Bullock (2011) reminds us that it is of little benefit. ↵
- The alternative to a between-subjects design is a within-subjects design, where we would be comparing responses from the same individual for the four experimental conditions. Each type of research design carries benefits and trade-offs that we will not get into here. ↵
- We include control variables because we are concerned that there might be other reasons (beyond our four conditions) as to why our subjects will display higher or lower levels of knowledge, and our approach allows us to account for, or control for, those other potential “confounding” explanations. Specifically, two of those concerns are what class they were in and what political actors they were shown. For example, we might be concerned that students in a general introductory class would score lower than an upper-division judicial politics class. And we might be concerned that more people would know who Joe Biden is (the then vice president) compared to David Cameron (the prime minister of the United Kingdom). Our approach allows us to rule out those two potential confounding explanations. ↵
- This note delves into the obscure methodological realm and is designed to caution you from assessing statistical significance based on 95% confidence intervals because the intervals can overlap yet the point estimates might be significantly different (see Austin and Hux 2002). ↵
- We also evaluated whether the effect of the question format varied among the political individuals about whom we asked. On this point, our bonus analysis shows a couple of things: (1) There was no significant question-format effect for Joe Biden, but there was for everyone else. This is likely due to the fact that fully 95% of respondents knew Biden’s job, so there wasn’t much variation to tap into. (2) Among the three for whom there was a significant question-format effect, there was no additional significant variation in the magnitude of this effect across individuals. That is, the question format effect was not significantly stronger (or weaker) for, say, Boehner than it was for Roberts. ↵
- Although these results might, at first blush, seem to contradict the results of Prior (2014), we do not believe that interpretation is warranted given the small size of the effect his study recovered and the number of subjects included in our study. See the appendix for a deeper dive down this super deep nerd rabbit hole. We also evaluated whether the effect of having a photograph was conditioned by the person about whom we were asking. Could it be, for example, that seeing a photo of John Roberts helps respondents but seeing a photo of Joe Biden does not? Our analysis of the data on this point says “nope.” More formally, the effect of having a photo is statistically insignificant (p > 0.20) for all four of the political figures we examined. ↵
- In case you are wondering whether visual knowledge is conceptually and empirically different from verbal knowledge in our measures, it is. Please see the end of the appendix for more on it. ↵
- The with-robes picture, which can be accessed via this link, is Thomas’s official Supreme Court portrait (taken in September 2007 and current as of January 2024). The without-robes picture, which can be accessed via this link, comes from a 2019 article in Vanity Fair discussing a new book about Thomas (see Vanderhoof 2019). Both links were active and working as of July 2024. ↵
- Chief Justice John Roberts and Justice Stephen Breyer were used in other experiments. ↵
- We should also point out that we failed to recover a statistically significant robe effect for Thomas’s name identification in this sample, contrary to what we found in our earlier experiment. ↵
- To calculate the distance between justice pairs with our Likert-type rating data, we used the “city block” distance metric (Schvaneveldt 1990). This calculation is akin to counting the number of blocks you would travel in a city from your starting point to your finish point (e.g., if you go east for two blocks and north for one block, that is three blocks). This is different from calculating the “Euclidean distance,” which is a straight line between two points and would go through the buildings in a city. ↵
- Pathfinder requires two user-supplied parameters. The q parameter limits the number of indirect proximities examined when the network is generated. The r parameter determines the metric used for calculating the distance of paths. In what follows below, we set the q and r parameters at q = n − 1, where n is the number of nodes in a network (thus q = 8 in our case) and r = ∞, respectively. These values were chosen because they result in networks with the minimum number of links, thus revealing the most salient and important associations between justices. ↵
- There were three verbal and three visual questions asked of each respondent. We classify someone as having high knowledge if they got two or three of those questions correct. We classify someone as having low knowledge if they got none or only one of those three questions correct. Seventy-three individuals were high visual, high verbal; 52 were low visual, high verbal; 17 were high visual, low verbal; and 70 were low visual, high verbal. ↵
- All of these images are in the public domain. ↵
- In social science terminology, when one variable significantly predicts another variable in the expected direction, then we say it has predictive validity. In other words, it gives strength to the claim that the measure is a valid representation of the concept that we think it represents. When a variable does not significantly predict another variable, then we say it has discriminant validity because it is unrelated to that other concept. ↵
- One might argue that the size or magnitude of the correlation coefficient (0.29) is pretty good, though while that may be true in a sense, especially since it is significant, we would caution against this interpretation for a couple of reasons. First, if we were trying to see how well we could explain the variation in one type of knowledge as a function of the variation from the other type of knowledge, we would only explain about 10% of the total variation. That means there is a lot of variation to be explained by other factors. Second, another way to think about this is in a regression model framework, where high correlations between two variables will become problematic when that correlation approaches .7 or higher, which is often called multicollinearity. Given our correlation is much lower, it would not present any problems on this front. ↵
- Though one might be quick to dismiss the differences in structure across groups as merely noise from measurement error, we note that the Pathfinder algorithm first places links between every possible pair of nodes. It then derives an interpretable network by eliminating links that do not satisfy metric properties. Any metric must satisfy the triangle inequality, which states that the summed length of two sides of a triangle must be greater than the length of the third side. Because statistical noise cannot satisfy the triangle inequality (for more information, see Roth et al. 2002), the node-to-node links retained by Pathfinder are the latent structure, not an artifact of random noise. ↵
