Writing and Business Models
Those who can write will work for those who can’t.
~Anonymous
In our teaching, we are often asked by students to provide examples of the topics we are covering. Often, such examples are seen by those same students as the “correct answer” to the whatever question is being addressed. This is rarely the case in school and never the case in the business world. In both realms, samples are provided to help the analyst (or student) get started. The circumstances of the problem (or assignment) should always dictate the final outcome.
This chapter is intended as a culmination of everything that comes before it. It is not an exhaustive treatment of common business models. That would be daunting! Instead, these models are discussed as examples of how a business student might use them in conducting an analysis and writing a report.
Crafting these examples required first understanding a specific business model, comparing the components of the model to the facts of a specific case to make precise conclusions, and finally writing about these observations in concrete language. Such a linear and systematic approach to the application of a business model is an example of demonstrating critical thinking. In the business world, this type of thinking and reasoning is expected. In its absence, the author is judged incompetent and may eventually lose their job. In the academic world, this is the kind of thinking that separates the “A” student from their peers.
Why Use a Model?
Many a problem has been solved simply by asking the right question. In the business world, our experience has shown that having an analytical model is one of the single best predictors of successfully finding a workable solution. That’s one reason why in the academic world, students are exposed to many and varied analytical models. Models help you know what questions to ask, what questions are out-of-scope, and most importantly, when you are done.
Whether it is ethics, marketing, finance, strategic management, or any other topic, there is probably a model that will fit the situation. And because business students have this exposure and knowledge, analysis is one of the most marketable skills you can demonstrate to an employer. While in school, it is simply a tool in the first part of the writing process.
Prior to teaching, John worked at a large consumer electronics manufacturing and marketing company. One task he took on was to lead a global project to standardize problem solving across the many divisions of the company. The logic behind the project was simple, yet ambitious—identify a universal and standardized approach to speed up the time-to-resolution when engineers from different business units came together with a common problem. The justification for the project was that different approaches, and sometimes conflicting terminology, for solving technical problems was interfering with the ability of engineers and scientists to collaborate and solve problems quickly.
Step one was to identify the primary methodologies, find a champion to speak for each, and bring those experts together for a conversation. An exhaustive survey of the company found some 120+ unique problem solving methods. Fortunately, they could be grouped into a dozen camps such as those based on Kepner-Tregoe (KT), those related to TRIZ, ones using a Six Hats approach, etc. For example, a KT approach might involve an extra step if used for research and development rather than production, but they still started with identifying a root cause. After some discussion among these camps, each identified one or two spokespersons to represent their approach in deeper discussions.
These representatives agreed to an evidence-based approach of study. That is, each would go to their respective operating practitioners to create an inventory of when their specific approach was used effectively to solve a technical problem and to both categorize and quantify (in monetary terms) the outcome. After a couple months of research, the group came back together and compared results.
Unfortunately, what was supposed to be a straightforward comparison of investments and their returns in terms of time and money was a much more complex exchange of difficult-to-compare outcomes. It appeared that all twelve approaches were roughly equivalent in efficacy. Whenever a group undertook solving a problem using any of the approaches or one of its derivatives, they typically came to a satisfactory conclusion. This contrasted many examples of attempts to solve problems that were not supported by a formal approach. In other words, experts taking a trial-and-error approach to finding a solution took longer and were less likely to find a solution than a group that systematically used one of the dozen problem solving methodologies or one of its derivatives.
Eventually, the group disbanded with an unexpected conclusion. While we reported to management that a single approach was not advised, we advised using any formal approach to solving problems would make a significant positive difference when compared to not using one. As this story relates to the textbook’s current chapter therefore, we advise using a business model when writing business case responses. Doing so means you will make fewer mistakes of omission and will create a significantly more robust answer than if you don’t use one. Read on for some examples of how this can be done effectively.
Example 1 – SWOT
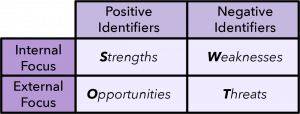
SWOT stands for strengths, weaknesses, opportunities, and threats; it is typically one of the first models to which business students are exposed. Some students, however, may not be familiar with the tool. When used, it is expected that strengths and weaknesses are internal to an organization, that is their unique resources, assets, and capabilities either point to what the organization is good at or where it is vulnerable; they are the conditions to which the organization has some measure of control. Opportunities and threats, on the other hand, always come from outside the organization and are indicative of events or circumstances to which the firm may or should respond. They happen in the external environment and are beyond the control of the firm.
By the way, we use SWOT analysis for numerous examples in the book, especially in connection with Bloom’s levels of learning. Because we rely on knowing this model, we included an example of the useful checklist in this description. These are items that often appear in a SWOT analysis. Obviously, each analysis will be unique to the specific organization studied, but these questions are typical of those asked to discover the many factors that can impact an organization.
| Potential Internal Strengths | Potential Internal Weaknesses |
|
Many product lines? |
Obsolete, narrow product lines? |
|
Broad market coverage? |
Rising manufacturing costs? |
|
Manufacturing competence? |
Decline in R&D innovations? |
|
Good marketing skills? |
Poor marketing skills? |
|
Good materials management systems? |
Poor material management systems? |
|
R&D skills and leadership? |
Loss of customer goodwill? |
|
Information system competencies? |
Inadequate Information systems? |
|
Human resource competencies? |
Inadequate Human resource? |
|
Brand name reputation? |
Loss of brand name capital? |
|
Portfolio management skills? |
Bad portfolio management? |
|
Cost of differentiation advantage? |
Loss of corporate direction? |
|
New-venture management expertise? |
Infighting among divisions? |
|
Appropriate management style? |
Loss of corporate control? |
|
Appropriate organizational structure? |
Inappropriate organizational structure? |
|
Appropriate control systems? |
Inappropriate control systems? |
|
Well-developed corporate strategy? |
High conflict and politics? |
|
Good financial management? |
Poor financial management? |
|
Others? |
Others? |
| Potential Environmental Opportunities | Potential Environmental Threats |
|
Expand core business? |
Attacks on core business? |
|
Exploit new market segments? |
Increases in domestic competition? |
|
Widen product range? |
Increase in foreign competition? |
|
Extend differentiation advantage? |
Change in consumer tastes? |
|
Diversify into new growth businesses? |
Fall in barriers to entry? |
|
Expand into foreign markets? |
Rise in new or substitute products? |
|
Apply R&D skills in new areas? |
Increase in industry rivalry? |
|
Enter new related businesses? |
New forms of industry competition? |
|
Vertically integrate forward? |
Potential for takeover? |
|
Vertically integrate backward? |
Existence of corporate raiders? |
|
Enlarge corporate portfolio? |
Increase in regional competition? |
|
Overcome barriers to entry? |
Changes in demographic factors? |
|
Reduce rivalry among competitors? |
Changes in economic factors? |
|
Make profitable new acquisitions? |
Downturn in economy? |
|
Apply brand name capital in new areas? |
Rising labor costs? |
|
Seek fast market growth? |
Slower market growth? |
|
Others? |
Others? |
Scenario
Students in a case study-based course were provided a briefing on a British firm, Hewden, that rents heavy excavation and building equipment for large construction projects. The brief contained a pre-completed SWOT analysis of the company. The assignment required students to analyze the artifact from an actual Hewden-generated SWOT analysis in order to respond to the assignment prompt.
Data
These data were copied from the case briefing, but not in their entirety. As a case study, this document is four pages long.
Strengths:
- strong brand and reputation
- market leading training and development opportunities
- flat organizational structure
- fun working environment where employees thrive professionally and personally
- dedicated, loyal workforce and high number of long-serving professionals
- Core Fleet Guarantee (any order received before midday is delivered the next day)
Weaknesses:
- an have an outdated operating system that prevents network visibility to rental equipment inventory
- logistical challenges and site-to-site variability of quality of service
- inefficient operations with variable levels of service quality
- increasing strength of competition
- poor implementation of a new operating system
- an aging workforce threatening to leave key positions vacant or underperforming
Opportunities:
- use social media to create a strong bond with customers
- use social media to improve recruitment
- use electronic channels to allow employees to interact directly with the CEO
- Hewden Smartphone app to make the rental process smoother and more efficient
- PDA handsets trial for tracking and collecting rental equipment
- improved inventory availability via the new operating system
- positive, growth oriented employee culture for advancement
Threats:
- due to its excellent training programs, competitors are keen to recruit Hewden’s employees
- economic factors
Prompt
Identify one of Hewden’s strengths, weaknesses, opportunities, or threats. Compose a persuasive argument for how that factor will make the biggest impact on the firm’s success.
Approach
Although not specifically named, the prompt is obviously calling for a SWOT analysis because it uses the words—without the acronym. Already, the wording of the prompt requires the student to at least understand the model (even though the verb “identify” is an indication of the knowledge level, it is used in such a way that requires a deeper understanding of the model, Bloom’s comprehension level). The second verb, “compose”, gets more difficult because it requires the student to write a persuasive argument. Not only must the student comprehend and apply the SWOT model, they must distinguish between the various factors identified in the case brief in order to distinguish one from all the others and they must write persuasively about it (Bloom’s evaluation level). To build a strong case, the student is even touching on Bloom’s synthesis level.
The case was written in 2011, three years into a major global recession. You could perform an internet search and discover the subject company went out of business in late 2016, after Great Britain voted to exit the European Union. However, the student must approach the case report as if it is still 2011 and knows only what is known as of the time of the writing. As students of history, we have the benefit of time and perspective, but nobody can travel to the future to know if they are making the right choices. Sometimes, knowing the eventual outcome of a decision set spoils one’s ability to think openly and creatively about what options are best. It is best to write your report in school before you, figuratively, peak to the end of the book and discover the ending.
Report
At first, this prompt seems relatively simple, but on deeper analysis it requires a high level of thinking and understanding of business conditions. The case is far reaching. The prompt is open ended and there is sufficient data in the brief to pursue any one of the factors as making the biggest impact. It is possible to use a lower level of thinking (application and analysis), but the best students go to higher levels of thinking (analysis and synthesis). This example uses Bloom’s synthesis level.
The Great Recession created a contraction in Britain’s GDP of .5% in 2008 and 4.2% in 2009. In the two years since, the recovery was very modest with GDP growth of only 1.7% in 2010 and 1.5% in 2011. Although the case does not provide data on Hewden’s actual profitability, we know from the country’s Office for National Statistics that profits were at historical lows and trending down but at a slower rate (i.e., possibly stabilizing); we can assume the same was true for Hewden. The case points to an outdated operating system that was causing the firm to lose track of its equipment and, as a result, experience a falling quality of service. It was also losing money from ineffective training results in trying to convince employees to use the replacement system. We also know this is resulting in losses due to its Core Fleet Guarantee. Hewden should prioritize the implementation of its operating system to reduce costs, increase efficiencies, and improve performance.
Despite increasing lapses in the Core Fleet Guarantee, it remains an asset and Hewden continues to enjoy a strong brand. Putting more resources behind the implementation of its operating system will improve operating efficiencies, better utilize expensive capital assets (equipment), curtail losses associated with the Core Fleet Guarantee, and reinforce its Core Fleet Guarantee.
Hewden’s financial security is already under stress due to global economic factors; these factors have continued to worsen. No firm can sustain negative financial performance indefinitely. The external threats posed by the current economic environment are critical and demand Hewden’s immediate and highest priority. If ignored, the economy promises to overwhelm Hewden and cause it to cease operations. If properly addressed, however, these same factors could be turned into opportunities for the firm. The SWOT analysis exposes several options for reducing external threats, unfortunately threats are outside of the control of company, so they must be addressed indirectly by through cutting costs, leveraging brand strength, and investing for the future.
Example 2 – Porter’s Five Forces
Understanding the competitive environment in which a company operates is essential for deciphering how and why a company makes the decisions it does. In 1980, a Harvard professor, Michael Porter, proposed such a model in describing five universal forces present in all markets that will impact the likelihood of any firm in the industry making a profit. Importantly, these forces behave independently and are rarely reciprocal nor symmetrical; meaning, four forces may be strong but the fifth force may be sufficiently weak as to offset them. The unique blend of these forces in any market or industry directly impacts the ability of existing firms to make a profit and therefore the attractiveness of the industry. That is, if profits are easy to come by, the industry is attractive; if they are difficult to achieve, the industry is deemed unattractive.
These forces are roughly defined as:
Threat of New Entrants – the barriers protecting existing companies in a market from having to compete with new companies not previously present in the industry. These barriers to entry can be in the form of capital costs, network effects, customer switching costs, brand loyalty, government regulations, and likelihood of retaliation. Conversely, an industry will naturally attract new entrants when existing participants are easily making a strong profit.
Buyer Bargaining Power – the strength of a buyer’s negotiating position is enhanced when the following conditions exist: buyer is in a position to easily switch their purchasing loyalty to other firms; the product sold by the industry has very few differentiating features; or the industry is struggling to find buyers. When buyers have control or power, the market—and the rivals within the market—are more likely to compete for their purchase.
Supplier Bargaining Power – similar to buyers, supplier power is strongest when: they are more concentrated, maybe even a single source supplier; they alternative buyers than the industry being studied; or when their products are highly differentiated. When suppliers have control or power, they will leverage their position in purchase negotiations and will have a strong influence on what members of the industry must pay for their supplies.
Threat of Substitutes – when an industry’s buyers can find attractive price-to-performance trade-offs by buying outside of the current industry, the threat of those substitute products impacting the profitability of all competitors in the industry is high.
Degree of Rivalry – separate from each of the previous forces, this force reflects the extent and intensity to which rivals in a market will compete with each other. When industry growth is slow, fixed costs are high, products or services are not differentiated, and exit barriers are high, then rivalry will be great.
Scenario
Students in a capstone strategy course completed a multi-round computer simulation pitting teams against each other manufacturing and selling a fictional product, called “Micromatic”. After eight rounds (referred to as quarters) of competition, students were provided a copy of results for the class (referred to as the subject industry). This allowed students to have experience with one company during the competition and to have access to all of their competitors data once the simulation was complete.
Data
The data provided here is not exhaustive, but is representative of what the simulation created and is useful in generating the report at the end of this example. The subject industry is #3 in Figure 4.3. All five comparison industries (previous terms of the same course) are different in size in that they had different numbers of competitors and different durations (quarters), therefore, both absolute and average data are provided. The industries are sorted from top to bottom in terms of Total Industry Net Income over the entirety of the simulated competition which roughly (but not exactly) translates into the percent winners column—the percent of winners reflects how many companies were generating a profit at the end of the simulation versus how many were generating a loss.
| Figure 4.3 Comparison Industry Data for Example 2 | |||||
|
Total Industry |
Avg Qtrly Company |
||||
|
No. |
Revenue |
Net Income |
Winners |
Revenue |
Profit |
|
1 |
$248,945,181 |
$8,531,255 |
91% |
$1,740,875 |
$59,659 |
|
2 |
$189,994,220 |
$4,737,919 |
89% |
$1,623,882 |
$40,495 |
|
3 |
$295,094,514 |
$3,708,871 |
64% |
$1,621,398 |
$20,378 |
|
4 |
$202,766,287 |
$2,254,445 |
60% |
$1,689,719 |
$18,787 |
|
5 |
$200,270,040 |
$1,853,198 |
69% |
$1,711,710 |
$15,839 |
|
Avg |
$227,414,048 |
$4,217,138 |
74% |
$1,677,517 |
$31,032 |
Prompt
Using Porter’s Five Forces, examine the subject industry to assess its attractiveness.
Approach
The wording of the specific prompt requires the student to use Porter’s model to define attractiveness. A student could—and many often do—define the term attractive in their own words or using an online dictionary and go from there. This is an approach similar to the story in the Introduction of the book when engineers jumped into solving technical problems by using trial-and-error. The outcome can be persuasive, but often will miss key elements or fail to fully answer the question. Porter has been recognized as a leading expert for many decades and his framework is likely to yield a superior outcome. The instructor has provided a clue to get students started using the appropriate business model.
Report
This report takes the described approach, examines the data using Porter’s framework, and provides a complete report. Given Porter’s model and the nature of the prompt, some of the response will be derived from the hard data and other portions will rely on the experience of the student while assessing the simulation decisions. The prompt is an example of Bloom’s synthesis level of thinking.
To determine the attractiveness of the simulated industry, we must identify the possibility for any company in the industry to generate a profit; if the opportunity is great, the industry is attractive. Michael Porter’s Five Forces model for analyzing a market’s structure is a useful tool for answering this question.
Looking first at the threat of new entrants, the field of competitors remained static throughout the simulation. No new companies entered the competition. However, while the average company in the industry earned about $20K in profit each quarter – a positive outcome relative to two industries – this result is mediocre relative to the other two comparative industries which saw profits two and three times greater at $40K (Industry #2) and $60K (Industry #1) per quarter. While there is a moderate threat of new entrants due to a positive average net income, there are clearly more attractive opportunities in other industries.
Our industry had eight competitors, each selling roughly identical products. While there was some differentiation between the companies’ products, this differentiation was insufficient to prevent customers from switching when prices and features or quality warranted. In the fifth quarter of play (Q5), the winner (Team #3) increased its price across all three regions by $3/unit while keeping all other marketing factors the same as the previous quarter; actual demand dropped a total of 10,054 units. In the following Q6 they dropped the price by $5/unit while again keeping all other factors the same and demand across all three regions increased by 15,848 units. We saw similar effects across the entire industry suggesting buyers are very sensitive to price and indicating their bargaining power was high.
The bargaining power for suppliers to the industry was similarly high. Although industry rivals could effectively lower the cost of raw materials from the industry’s sole source supplier by placing larger orders, this opportunity was available to all industry competitors. While the supplier did not aggressively exercise its bargaining position, by definition the nature of the supplier’s relationship to the industry meant its bargaining power is strong.
While the threat of substitutes was never a reality in our simulation – demand for substitute products would have meant a drop of demand for the entire industry without recovery – its possibility probably had a moderate impact on the industry. However, the relatively modest income potential per company per quarter (third of five industries, about $20K) and the modest 7% increase of the average unit price across all companies and the entire eight quarters of simulation (from $70/unit in Q1 to $75.20/unit in Q8) suggests the industry was vigilant to external substitute products.
Finally, and most telling, was the intensity of rivalry in our industry. This was a strong factor impacting the likelihood for any one firm’s ability to make a profit. Indeed, the 64% of winners in our industry compared to the other four industries was second lowest and compares negatively to the overall average of 74%. Only three of the eight companies were able to operate without emergency loans from the bank, only one firm was paying a dividend to its shareholders, and marketing expenses were consistently increasing throughout the competition (a total of 41% increase from $242K in Q1 to $341K in Q8) indicating firm’s were struggling to retain their customer’s business.
Overall, with strong bargaining positions for both buyers and suppliers and a high degree of rivalry within the industry, the average company in this industry struggles to make a profit. Therefore, this industry is not attractive.
Example 3 – BEP Analysis
Most students learn about break-even point (BEP) analysis very early in the business education. The concept is relatively simple,
Scenario
In the same course as Example 2, in which capstone students were asked to define the attractiveness of a simulated industry, students were provided a set of data and asked to define the BEP for a specific firm. Essentially, BEP is the level of production required by a firm in which revenue will cover expenses and generate no profit or loss, to literally break-even. The analysis requires the student to differentiate between fixed and variable costs associated with production. Fixed costs are those that are not impacted by volume. In other words, whether the firm sells a million units of product or none at all these expenses are the same; for example the building, equipment, and machinery a plant requires to produce the product are variable costs. On the other hand, variable costs are impacted by volume; variable costs go up as volume increases and decline as volume decreases. Variable costs include items like direct raw materials, labor, and utilities.
To calculate BEP, the student must know the total volume in units, the average price in units, the variable cost per unit, and the total fixed costs. Using this data and the following two formulas, the BEP is calculated. The answer to the first equation is used as an input for the final equation.
Contribution Margin = Average Price – Variable Cost
Break-Even Point = Fixed Costs / Contribution Margin
Data
All data must come from a single point in time. In this case, data were collected for one company (referred to as Company #3, the winner for the simulation) at the end of the 8th quarter (referred to as Q8).
| Figure 4.4 BEP Data for Example 3 | ||||
| Total Volume |
39,898 units |
Fixed Costs | ||
| Average Price |
$73/unit |
Accumulated Depreciation |
$40,000 |
|
| Variable Costs | Short-term interest |
$1,250 |
||
| Subcontract and Raw Materials |
$422.380 |
Bond Interest |
$4,875 |
|
| Labor, Quality, Overhead |
$1,521,177 |
Plant and Maintenance |
$15,000 |
|
| Warehouse Operations |
$39,317 |
Lease Payment |
$175,000 |
|
| Selling and Administrative (S&A) |
$331,000 |
|||
Prompt
Calculate your company’s break-even point at the end of the simulation (Q8) and assess the implications of your BEP on future decisions if the simulation were to continue for four more quarters.
Approach
The first portion of the report is relatively easy as it is a plug-and-chug activity of putting the correct data into the formula and calculating a number. The second part is a bit more challenging in that they must explain the implications of the answer they derived. In the first “calculating” part, the student must still use critical thinking; that is, if the calculated number does not look right—too high or too low—the student should check their math or look for errors in what data was included.
Once sure they have a reasonable set of figures, however, the student can demonstrate how much they know about BEP and running a simulated company. There is a notable difference between school and business—in the business world, having the wrong figures is a significant error and may cause the analyst to lose their job. In school, the student may get partial credit even if the answer is technically wrong. If it is a foundational cost accounting course and the test is about whether they can calculate BEP, the instructor may still give partial credit for a wrong answer with the right approach. In a capstone course, the instructor may overlook calculation transpositions or mistakes in order to assess how well the student justified their answer—that is, the second part of the prompt is what matters most for demonstrating mastery.
The nature of the question lends itself to utilizing the abundant data provided by the simulation. But, it also allows the student to demonstrate mastery of the concepts addressed in the capstone course. Providing both a quantified analysis and logical narrative using the data, the student is able to demonstrate mastery at the highest level of Bloom’s taxonomy, evaluation.
Report
As described in the approach and using the equations for determining BEP, this example starts by calculating an answer to the first part of the prompt (Bloom’s application level of thinking) and then provides a narrative in response to the second part (Bloom’s synthesis level of thinking). Some of the data used in the narrative is not listed in the BEP data but is gathered from the class and the student’s own spreadsheets.
| Figure 4.4 BEP Calculation for Example 3 | ||||
| Total Volume |
39,898 units |
VARIABLE COSTS |
||
| Average Price (P) |
$73/unit |
Subcontract + RM |
$422,380 |
|
|
FIXED COSTS |
Labor, Quality, OH |
$1,521,177 |
||
|
Acc Depreciation |
$40,000 |
Warehouse Ops |
$39,317 |
|
|
Short-term interest |
$1,250 |
TOTAL VC |
$1,982,874 |
|
|
Bond Interest |
$4,875 |
VC/Unit |
$50 |
|
|
Plant Pmt + Maint |
$15,000 |
|||
|
Lease Pmt |
$175,000 |
CM = P – VC/unit |
$23 |
|
|
S&A Pmt |
$331,000 |
BEP = FC / CM |
24,339 units |
|
|
TOTAL FC |
$567,125 |
|||
Our firm, Company #3, finished Q8 in first place for the competition and a very strong operational position with a BEP more than 15,000 units below our actual volume (39,898 units actual sales – 24,339 needed to break-even = 15,559 units). Our cumulative health and resulting market power as evidenced by this BEP analysis provides us numerous options if we were to continue to operate the company in this simulation.
First, we could lower our prices to expand our market share. During Q8 our firm sold its product at $3/unit below the average for the industry (even when excluding our own low price.) Only one company beat our price point in any of the three regions of operation; Company #6 underpriced us by an average of $4/unit. However, due to their product mix, they sold an average of less than 45% of our volume (average quarterly sales of 3908 versus our 8740 units) and finished the competition in seventh out of eight company teams. Even the second place finisher, Company #1, struggled to maintain profitability while pricing their product higher than ours by an average of $1/unit. At 19.4% of market share we are effectively controlling this industry; we lead second place Company #1 by 2.4%, and are the only firm with increasing market share at this point in the competition.
Next, we could increase our prices to improve our profit. Our 20% gross margin and 9.7% return on sales (ROS) leads the industry and is much stronger than second placed Company #1, who finished Q8 with a 7% gross margin and ROS of 2.8%. After eight quarters, this industry is proving to be unprofitable for most of the firms with only three out of eight still making a positive ROS. If the simulation allowed companies to be acquired or to go out-of-business (it does not), our industry would likely have been reduced by at least half in terms of the total number of competing firms. Our industry-leading $55.02/share price reflects our market power, operational excellence, and 12% return on owner’s equity.
Lastly, we could implement a combination of the above options, use our strong contribution margin and cash reserve ($544K at the end of Q8) to expand our capacity, and continue to build a stronger operating advantage over our closest competitor, Company #1. Overall at $23/unit, the contribution margin of our product reflects a strength in our team’s operational excellence and demonstrates a superior return on investor equity. The strong BEP demonstrated at the end of Q8 means we have flexibility to respond to whatever happens in the market and be masters of our own destiny.
What if I Have to Present?
Public speaking is one of the most common of anxieties; estimates range from 20-80 percent of all Americans have this fear. However, just like writing professional reports are common in business, so are presentations. Unlike writing a report, where you have time to think about what you want to write, you can edit for brevity and content, and you can discuss with colleagues about what to leave in and what to leave out, public speaking requires extensive planning followed by “throwing out the plan” once the presentation gets underway.
Making a successful business presentation requires just that, effective planning and the ability to think on your feet and adapt to the circumstances. The good news is, while a written report may leave you wondering if the intended audience ever read it, you get immediate feedback when you speak face-to-face with a small group. So, you’ll know immediately if you performed well and sold your message. Because of this opportunity for active and dynamic feedback, if you are a good listener and observer, you can also make adjustments to improve your delivery “on the fly.”
Assuming you have already conducted your analysis and identified what you want to say, the following will help you plan the presentation and deliver it optimally.
Creating Effective Slides
Your first or second slide should contain an outline of your presentation:
- The outline slide should contain only the main points.
- The title of each slide should match your main points.
- Use the order shown in your outline for the rest of the presentation.
Plan for 1-2 slides per minute in your presentation:
- Include 4-5 points per slide, no more than 6-8 words per line.
- Include narrative in the speaker notes, not on the slide.
- Don’t include slides that don’t require narrative.
- Always include slide numbers—if you have to refer to a slide, you can use its number.
- Put slide content into a bulleted format.
- Write in key point form, not complete sentences.
- Sentence punctuation rules do not apply, but punctuation should be consistent.
- Prioritize clarity: use key words and phrases only, less is more.
Display one point at a time (slide animation, optional) to:
- Help the audience focus on what you are saying.
- Prevent the audience from reading ahead.
- Help you stay focused.
Use parallel construction:
- Slide titles should be parallel.
- Bullet items should be parallel.
- In group presentations, presenters’ slide and topic organization should be parallel.
Use clear, simple fonts:
- Use at least an 18-point font. Larger is better, but don’t crowd the slide.
- Use different size fonts for main points and secondary points. Varying by two sizes adds visible deviation.
- Use ALL CAPS only when necessary for emphasis. Use boldface or italics instead.
Use color effectively:
- Use a font color that contrasts sharply with the background.
- Use color to reinforce your organization (e.g., in a title)
- Occasionally use color to emphasize a point.
Use graphs, tables, and other visuals effectively:
- Data in graphs can be easier than raw data to comprehend and retain.
- Trends can be easier to visualize in graph form.
- Be sure the visuals are legible from the audience.
- Always title and label your graphs, provide a key if necessary.
Proofread your slides:
- Check for spelling, punctuation, and grammar errors.
- Check for repeated and extra words.
Use a strong conclusion:
- Your audience will most likely remember your last words.
- Summarize the main points of your presentation.
- Ask for Questions.
- Suggest action items/next steps.
Include a reference slide:
- Your last slide should be the reference slide.
- Cite your references according to APA formatting.
Delivering Presentations
- Open with a clear introduction of your purpose and topic.
- Make eye contact with your audience throughout the presentation.
- Remember who your audience is. Present the topic with the audience’s needs in mind.
- Use concrete, specific language. Avoid vague pronouns like “mine,” “it,” “they.”
- Do not read from the slides or your notes. Slides should briefly outline key points; fill in the details, expand, or add examples in your speech. Discuss topics; don’t recite slides.
- Know your material. Be prepared to answer questions about what is on your slide or what you say in your speech (not entire topic; just what you cover).
- Display interest and enthusiasm. This is easier if you spend enough time with your source materials to find something of interest.
- Speak clearly and at a comfortable pace, varying your tone and pitch as you would in a conversation. Add emphasis to the most important points, even repeat them to make your point.
- Give readers enough time to read all content on each slide. Remember, the content on your slide should be very minimal.
- Practice your delivery to check timing and to be sure you know what transitions you will use between ideas and slides.
- Keep it simple but not simplistic. Visual elements (images) will help your audience stay engaged.
- Provide transitions to guide audience from point to point. For example: “First”, “For my next point”, “As you can see”, “In conclusion”, etc.
- Use professional transitions between speakers to create cohesiveness.
- End with the most important takeaway points. For example: “In conclusion”, “What you should take away”, or “Remember”.
