Community Ecology
Community ecology is the interactions between and among populations of species over time and space within a specified area. Species interactions underlie ecosystem functions such as nutrient cycling and influence ecosystem structure. Understanding the community ecology of an area can guide management of species as well as land management of a given area.
Recall the diagram (figure 4.1) from the previous chapter on “systems”? An ecological community is generally defined as interacting populations of species. Although this text won’t dive into the nuances of delineating an ecological community, it may be helpful to quickly list the key delineating approaches:
- Physical boundaries, based on ecological site(s), differences of land uses (e.g., natural forest vs. cropland), physical land features (e.g., valley bounded by mountain range), ecotones (e.g., woodland to grassland), management units (e.g., ranch), or geopolitical area (e.g., Bureau of Land Management [BLM] land).
- Habitat boundaries, based on habitat characteristics of one or more key species (e.g., habitat of elk—mountains and valley)
- Interaction boundaries, based on areas of interaction between key species (e.g., eagle and small mammal—forest edge and valley)
- Ecosystem-type boundaries, based on ecosystem (e.g., forest or wetland).
Section 1: Properties of Ecological Communities
Ecological communities have three key properties: richness, diversity, and community structure.
Community Richness
Species richness is the count of species in a given area. It is a simple indicator of biodiversity. Its application is limited in that it is simply a count with no weight given to any specific type or class of species, such as endemic, or functional groups (e.g., nitrogen fixers or mesopredators). A community may have a high count of small mammal species, but what does that mean for the structure and function of that community and ecosystem?
Community Diversity
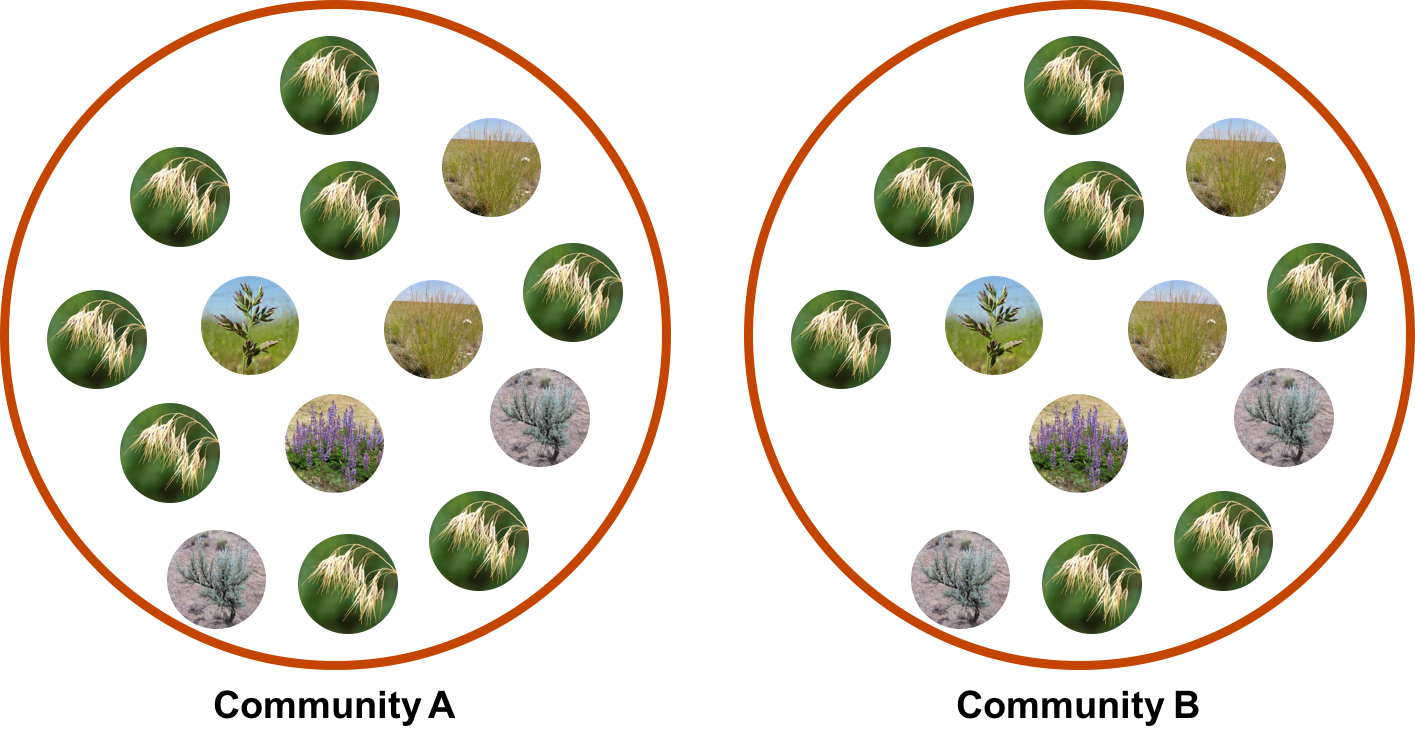
Species diversity is the count of different species (richness) and the relative abundance of those species (evenness). In figure 5.2 the communities have the same number of species (five), but Community A is essentially a monoculture of cheatgrass (Bromus tectorum), while community B presents a more even balance and distribution among species.
Community Structure
Community structure is species richness and diversity as well as the spatial and temporal distribution of species in the community. Community structure is determined by climate, geography, disturbances, and the interactions in section 2 and their influences covered in sections 3 and 4 below.
Section 2: Species Interactions
The study of community ecology focuses on interspecific interactions: competition, predation, and symbiosis.
Competition Interactions
Competition occurs between individuals of two (or more) species or populations of species utilizing the same resource in a given area. For example, elk (Cervus canadensis) and black-tail deer (Odocoileus hemionus) both forage and browse on greater than 50 percent of the same vegetation species in many areas of Colorado (Sandoval et al. 2005). Another general common example is the competition for water and nutrient resources between invasive plant species and native plant species. Competition interactions can be divided into three different categories: interference, exploitative, and apparent.
Interference Interactions
Interference interactions occur when an individual or population of a species directly prevents or influences the ability of an individual or population of another species to obtain a resource. For example, cattle grazing on and around lek sites during sage grouse (Centrocercus urophasianus) mating season directly prevents sage grouse from using the area for mating rituals and may influence the sage grouse to find another lek and nesting site.
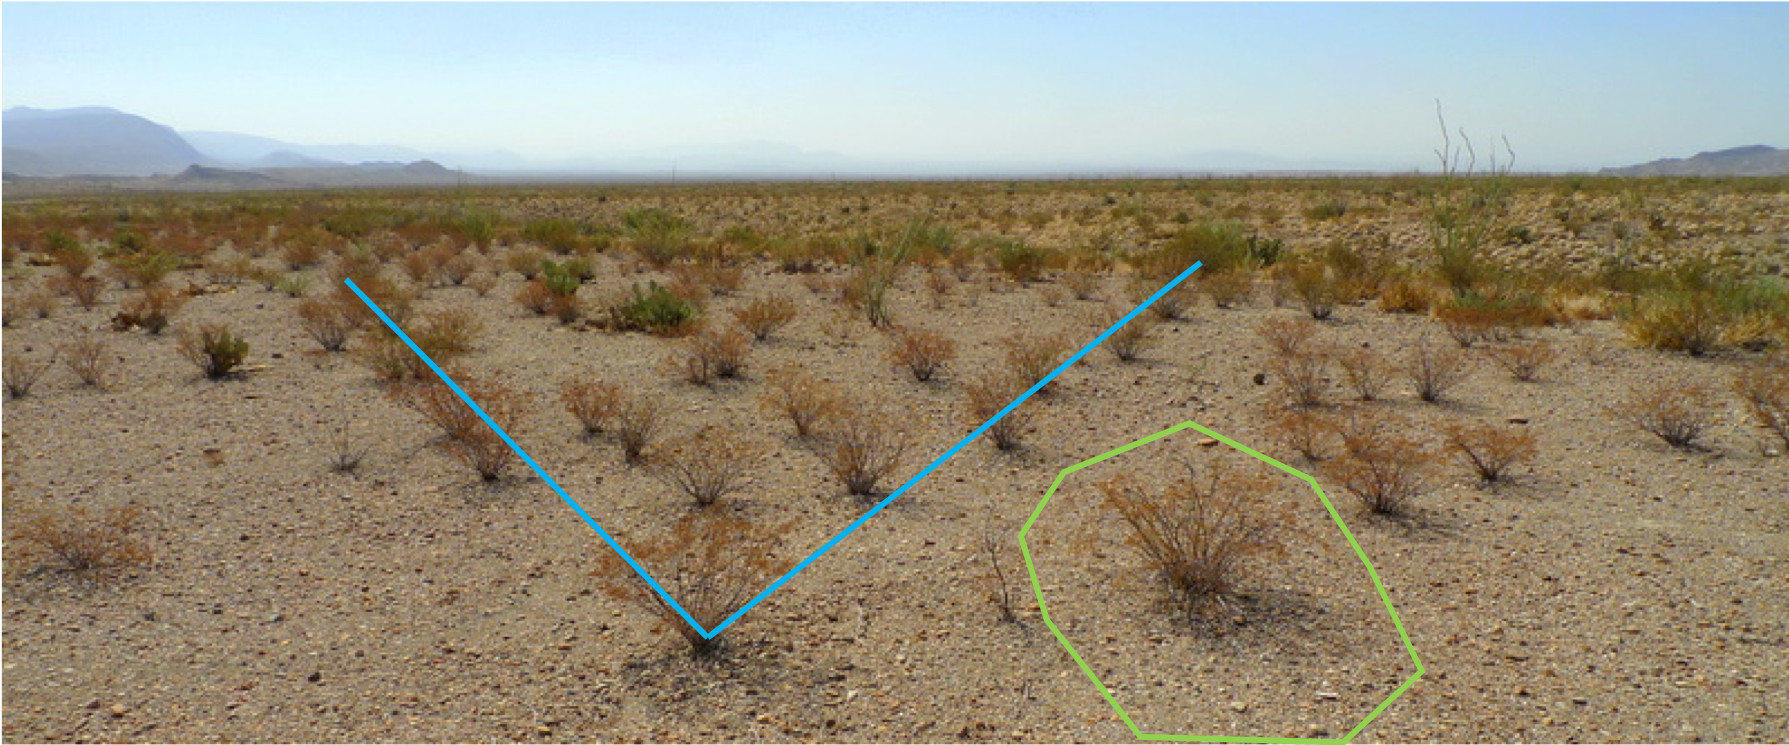
Allelopathy, the chemical inhibition by one organism of another, is an interference interaction. Allelopathic plants exude chemicals from the roots that inhibit the growth of other plants. In figure 5.3 you see that each creosote bush (Larrea tridentata) is surrounded by a bare area (outlined in green); this reflects the extent of its roots, which exude chemicals that prevent the growth of other plant species. Looking across a landscape dominated by creosote bush, one can see a pattern of plant distribution (blue lines).
Exploitative Interactions
Exploitative interactions occur when an individual or population of one species indirectly reduces access of an individual or population of another species to a resource in a given area. For example, black-tail deer tend to utilize valley areas year-round, thus reducing the fall and winter forage and browse available for elk in valley areas. Exploitative interactions for food resources are also called dietary overlap, a term most often associated with describing forage and browse competition between livestock and wildlife.
Apparent Interactions
Apparent interactions are not true competition, but a favorable outcome for resources occurs when the population of one species is targeted by a predator, thus giving an advantage to the other species population to obtain a resource. For example, when a predator species such as an owl favors predating on mouse species A more than on mouse species B, the result is reduced competition for food resources for mouse species B.
There are three general outcomes of competition: (1) one species excludes the other and the species that is excluded disperses; (2) sharing of resources with population density and carrying capacity facilitating division of the resources; and (3) coexistence through resource partitioning (each species adjusts its habitat selection within the area).
Predation Interactions
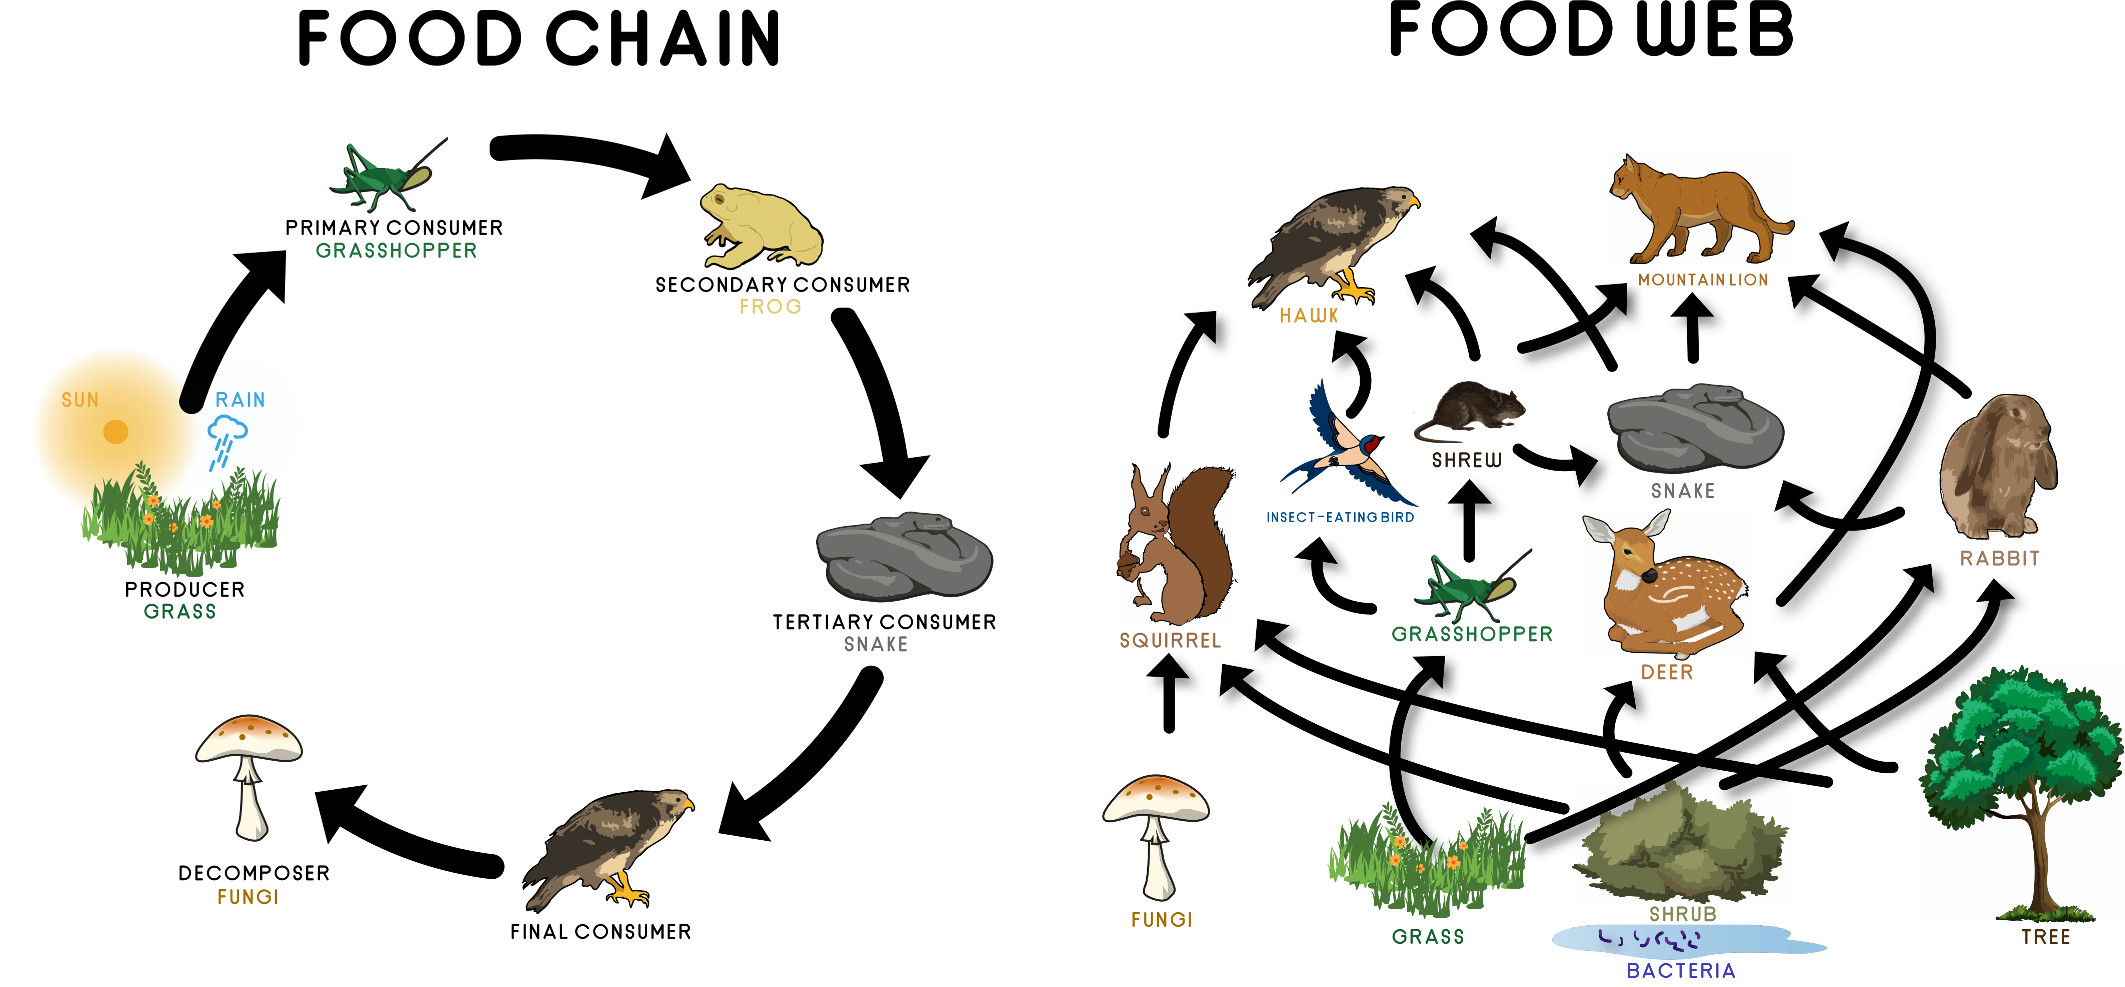
Predation is one species killing and eating another species. Included in predation is herbivory, in which an animal or insect species eats a plant species, either temporarily reducing its capacity for survival and growth or killing it. Predation interactions are the basis of the food chain (figure 5.4), which is the basis of the food web (figure 5.4).
Note that the food chain is organized by tropic levels—primary producers, primary consumers, secondary consumers, tertiary consumers, and quaternary consumers. This trophic structure is vital to ecosystem stability and resiliency; therefore, when a trophic level is suppressed or removed from a system, thus opening or widening a niche for another trophic level, trophic cascade occurs, and the ecosystem progressively becomes increasingly imbalanced. A prime example was the removal of the quaternary consumer wolves (Canis lupus) from the Greater Yellowstone ecosystem, which reduced predation pressure on elk populations. The increasing elk populations heavily browsed and grazed riparian areas resulting in highly altered riparian ecosystems. Figure 5.5 illustrates the impacts of trophic cascade as a result of wolf removal. For more details about this trophic cascade example, see Beschta, “Trophic Cascades from Wolves to Grizzly Bears in Yellowstone,” in the Journal of Animal Ecology (2003).
Keystone Species and Ecological Engineers
Keystone species are those species that have a specific and unique niche or function in an ecosystem that gives the species a disproportionate impact on the ecosystem relative to its abundance. This role is also reflected in the trophic cascade example above. The removal of wolves, a keystone species, from the ecosystem impacted the structure and diversity of riparian areas in the Greater Yellowstone Ecosystem (GYE).
Also reflected in this GYE example above is the role of ecosystem engineers, those species that create, modify, or alter habitat in a manner and to a degree that it impacts the structure and diversity of the ecosystem. Without beavers building dams in the river, riparian and aquatic habitat was reduced and degraded.
Symbiotic Interactions
Symbiotic interactions are those in which two or more species directly and purposefully interact for the gain of either one or both. There are many types of symbiotic interactions, but they fall into one of three categories: mutualism, parasitism, and commensalism.
Mutualistic Interactions
Mutualistic interactions are those in which all species benefit. For example, the nectar of flowers is the food source for a number of insects (e.g., bees) or birds (e.g., hummingbird), while the insects and birds feeding on nectar and moving from flower to flower facilitate pollination. Neither insect nor flower could exist without the other, making this mutualistic interaction obligate.
Facultative Mutualistic Relationships
Facultative mutualistic relationships are beneficial, but not required for either species. For example, nitrogen-fixing plants such as alfalfa (Medicago sativa) have a mutualistic relationship with rhizobia bacteria in nodules on the plants’ roots. This bacteria fixes nitrogen for the plant and inputs it into the soil for uptake by other plants and microbes. Alfalfa often obtains the nitrogen it needs from this relationship with rhizobia bacteria, but it is not dependent on this source of nitrogen to survive.
Parasitic Interactions
Parasitic interactions are those in which one species (the parasite) benefits from living with another species (the host), but the host is harmed. A common example is a deer tick (Ixodes scapularis), which feeds off the blood of animals and humans and in the process transmits diseases to the host that can weaken or sicken the host. In some instances, a parasite will weaken a host to make it more accessible to a predator or reduce competition between the host species and another species; in this context, parasitic interactions can be beneficial by helping to maintain ecosystem stability and diversity.
Commensal Interactions
Commensal interactions are those in which one species benefits and there is no apparent effect on the other species. A bird riding on the back of a large mammal is a commonly cited example. Commensal interactions are often overlooked in ecosystems, but they may be important, if not critical, interactions for broader ecosystem stability and resiliency.
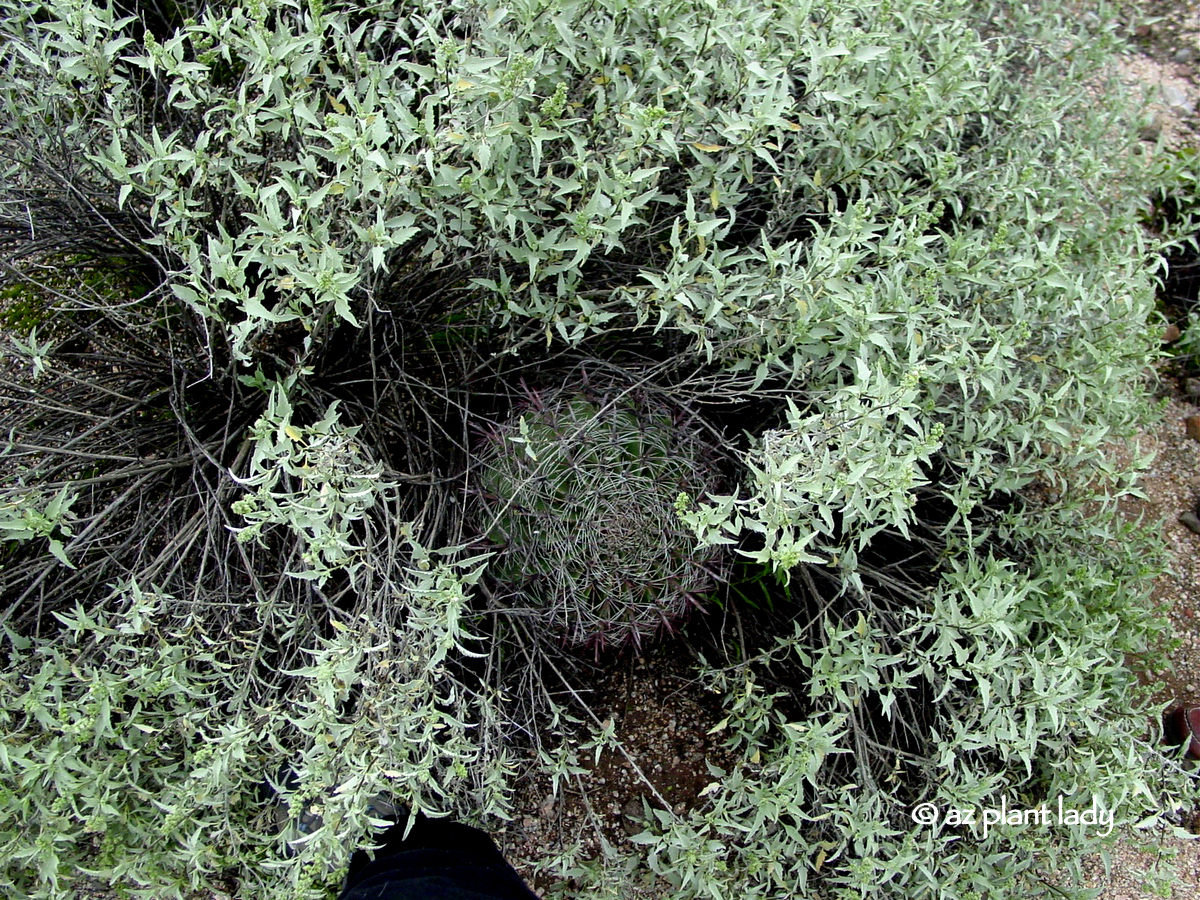
The role of nurse plants falls under commensal interactions. Nurse plants provide microhabitats to facilitate the growth and development of seedlings. Nurse plants provide protection from shade, fire, herbivory, wind, and so on, and provide advantages (such as collecting needed resources, moderating soil temperatures, etc.). For example, barrel cactus (Ferocactus spp.) seedlings utilize the loose and wide canopy cover of bursage (Ambrosia deltoidea) for protection from predation (figure 5.6). Saguaro (Carnegiea gigantitea) in the Sonoran Desert require the shade of mature plants at the seedling stage. In sagebrush steppe systems, sagebrush species (Artemisia tridentata spp.) provide cover and resources for native grass seedlings. Nurse plants can be a critical component of seeding success in restoration efforts.
Section 3: Influences on Interactions
To fully understand interactions between and among populations of species one must understand the key factors influencing these interactions: season, habitat selection, succession, disturbance, and retrogression.
Seasonal Influences
In discussing exploitative competition interaction (see above), we noted that deer use the valley area year-round, while elk use it in winter. Although these two species may both be in the valley seasonally, deer use in spring, summer, and fall may impact resources available for elk use in the winter. The secondary influence in this scenario is climate. If precipitation timing and amount supported a high degree of biomass production, then the competition interaction may be reduced; while the inverse may be the case if precipitation timing and amount limited biomass production.
Season of use may also be germination and growing season of plant species. C3 species generally grow and mature in the spring, while C4 species generally grow and mature over summer into early fall. Periods of most resource use occur during elongation, floral initiation, and reproduction; during these periods, plants focus on resource acquisition and distribution of physiological processes and are generally more susceptible to adverse effects of herbivory and disturbance. This can be important to know when guiding land use and in wildlife management.
When considering interactions, it is also important to understand season of use, as it may affect guide management before and after use season. One way to understand what species are using what resources when is to map it out or create a chart, both of which will illuminate periods of use sequence and overlap.
Habitat Selection Influences
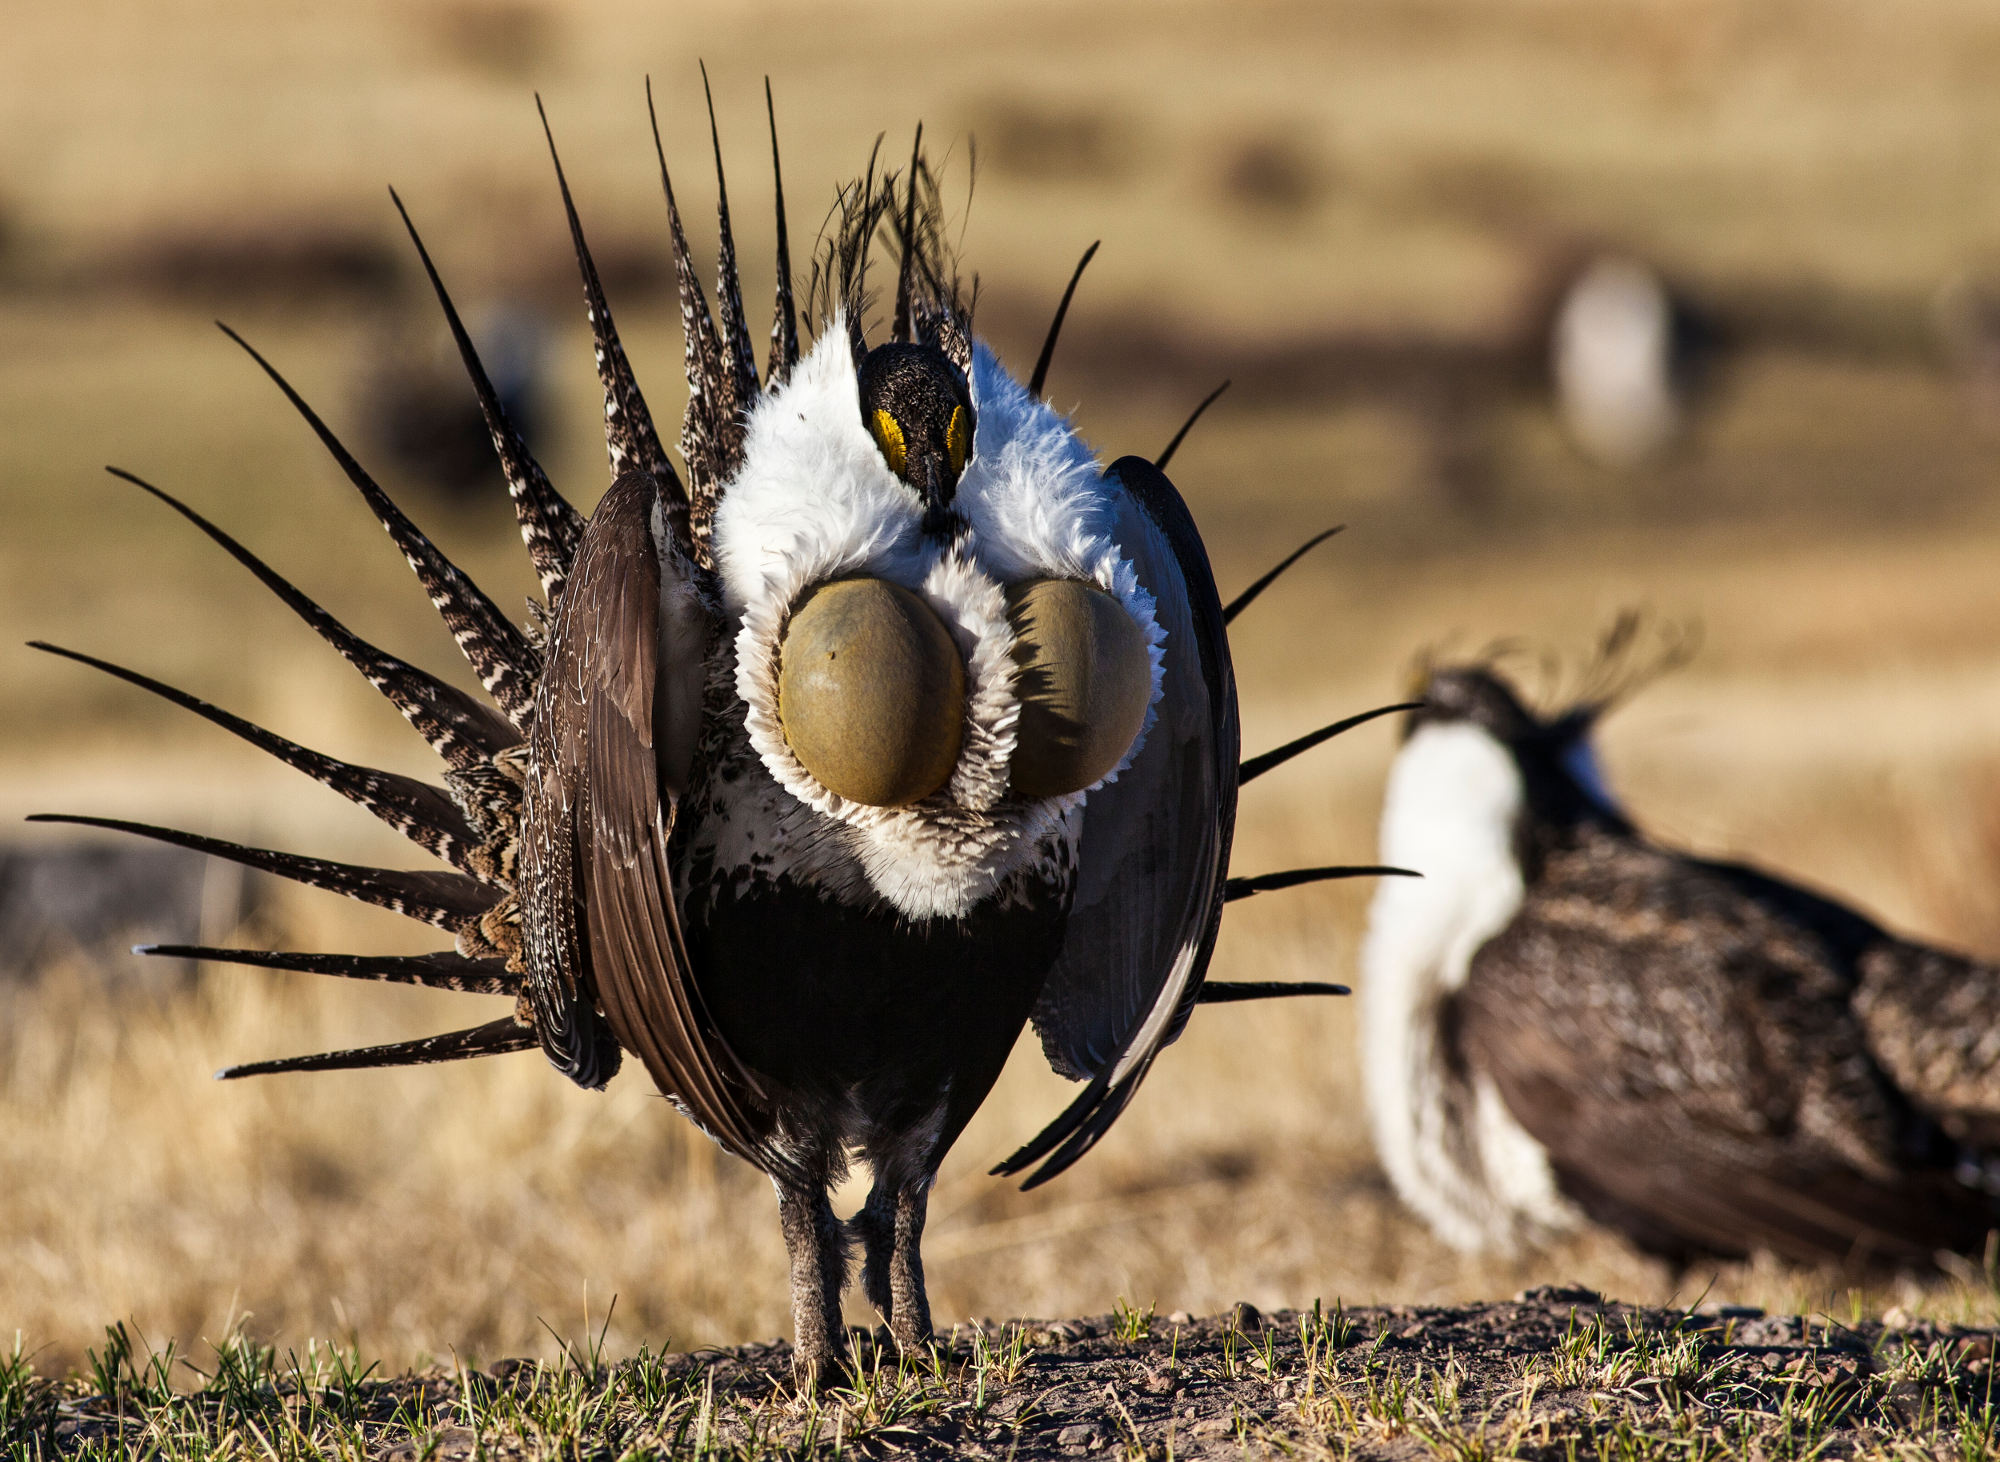
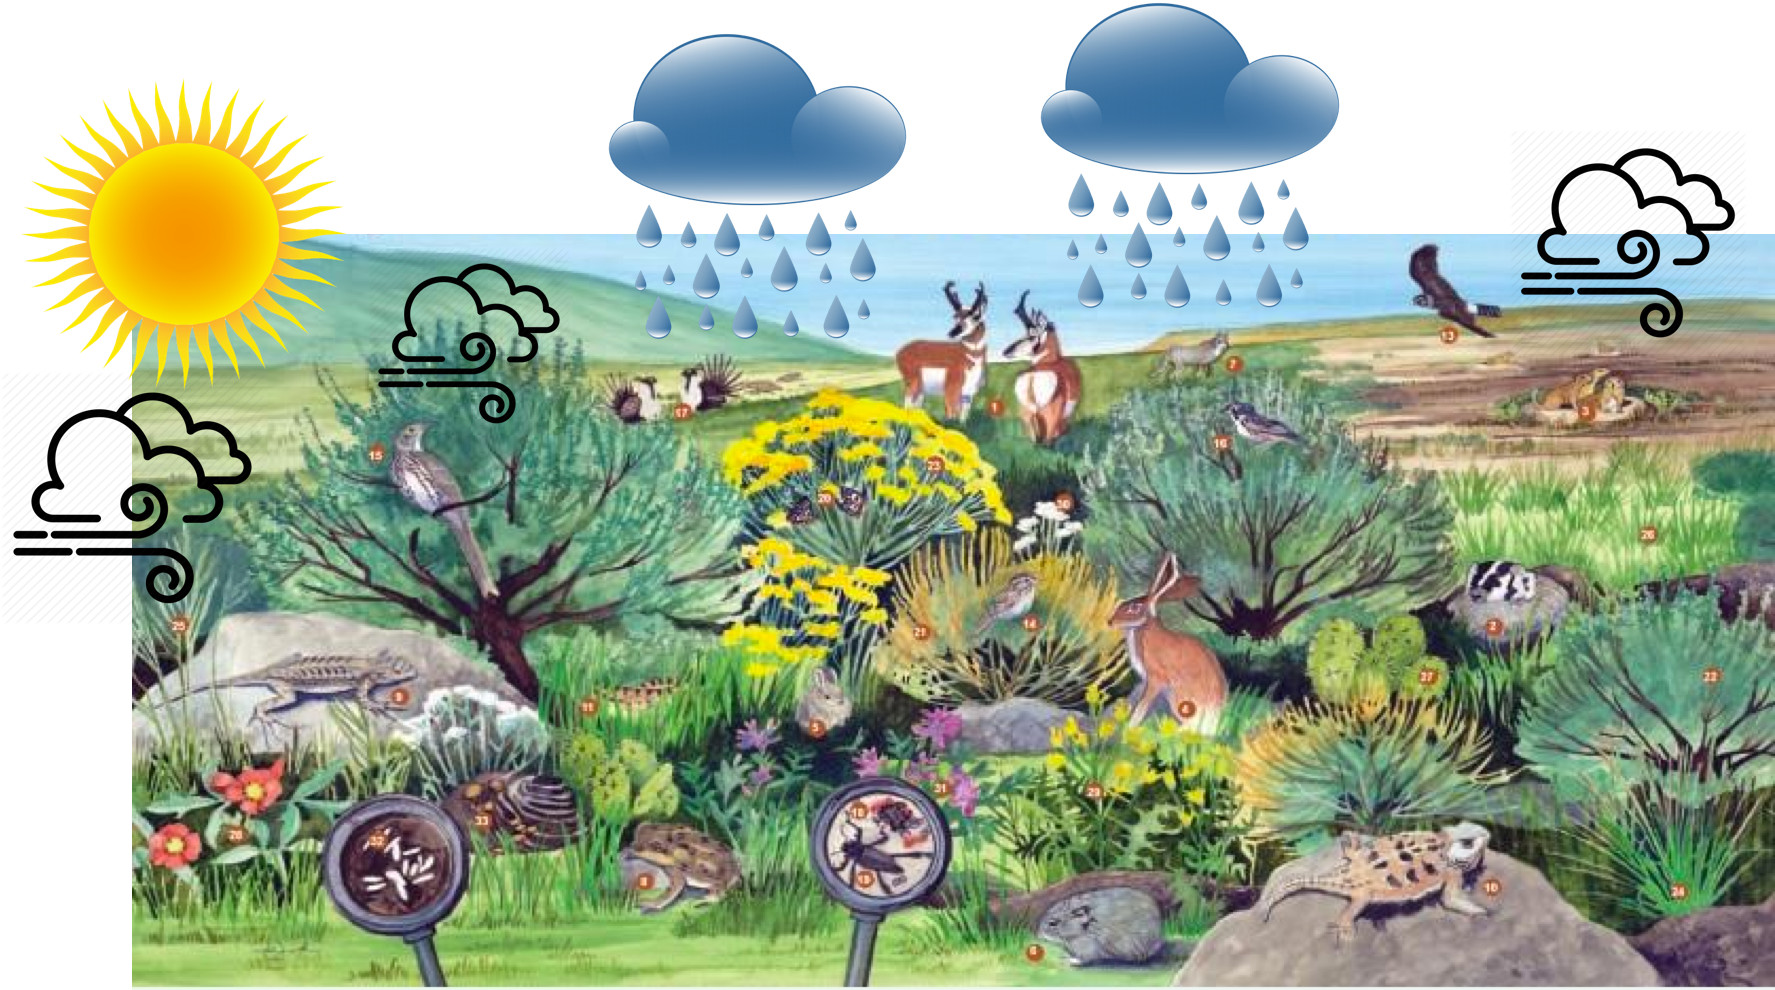
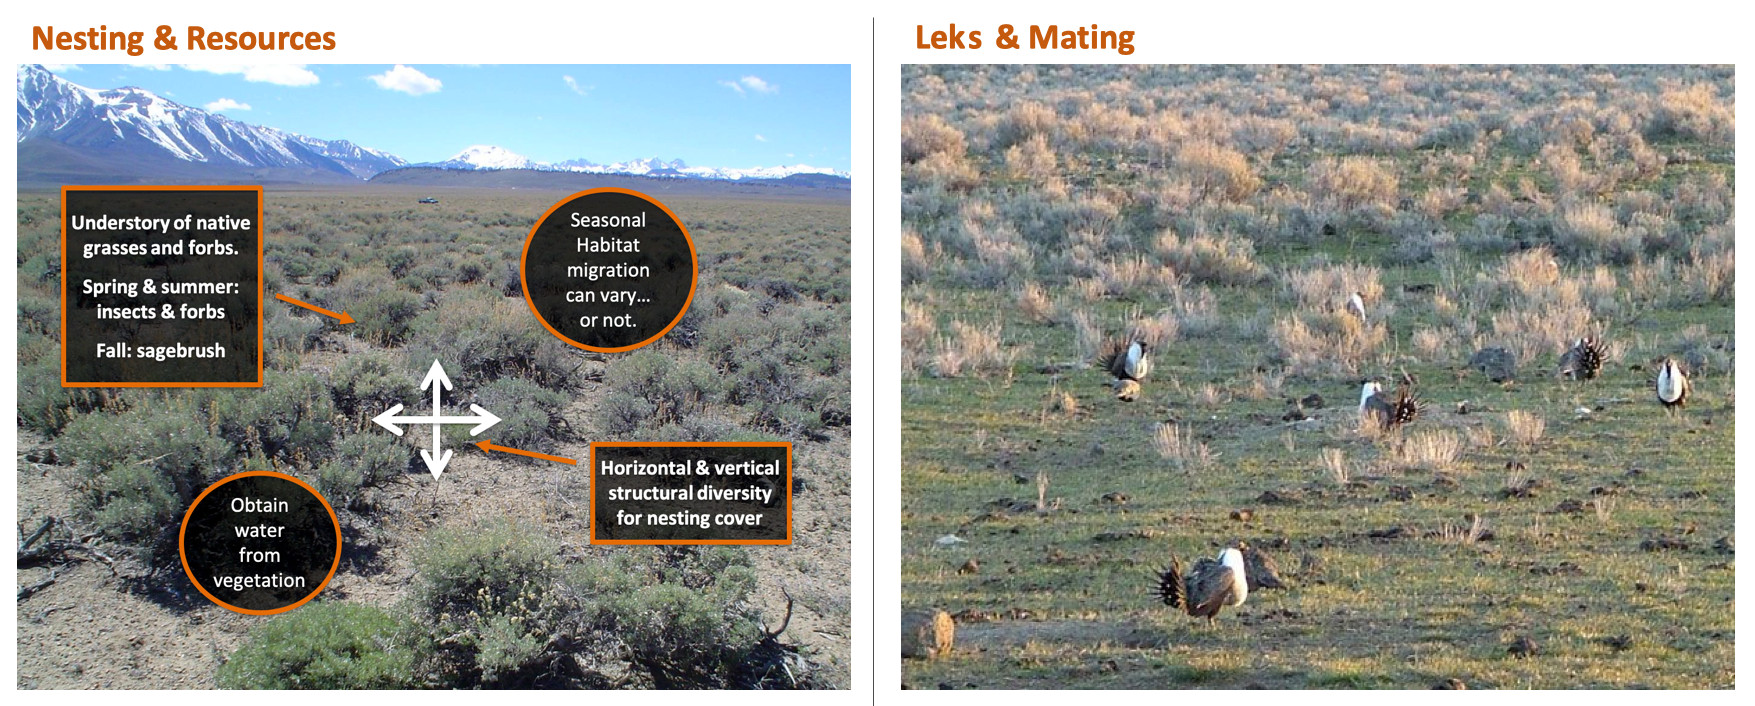
Habitat selection is the free movement of animals through areas of suitable habitat and their choice of where to get food and water, mate, nest, and so on, much of which is driven by the potential of negative, positive, or mutual interactions. For example, sage grouse (Centrocercus urophasianus) distribution depends largely on the availability of a mosaic with open areas to serve as a lek and nearby sagebrush to serve as nesting cover (figure 5.7). Jack rabbits may also look to sagebrush for nesting and cover, but they are also well aware of predation threats.
A number of songbirds nest in juniper trees (Juniperus occidentalis), often multiple birds in a single tree. This is possible due to resource partitioning, an influential factor in habitat selection.
Succession, Disturbance, and Retrogression Influences
Succession, disturbance, and retrogression change in vegetation communities and concomitant changes in wildlife, insect, and microbial composition and population dynamics have a substantial influence on community interactions. Chapter 6 will cover this influence in depth.
The best method for identifying and understanding species interactions and what influences them is by understanding each species’ biology and population dynamics. As stated at the beginning of this chapter, species interactions underlie ecosystem functions, such as nutrient cycling, and influence ecosystem structure. Understanding the community ecology of an area can guide management of species as well as land management of a given area. Therefore, it is imperative to identify and understand the nature, drivers, and influences of these interactions, which are the key value of ecological systems thinking.
Section 4: Plant Community Ecology
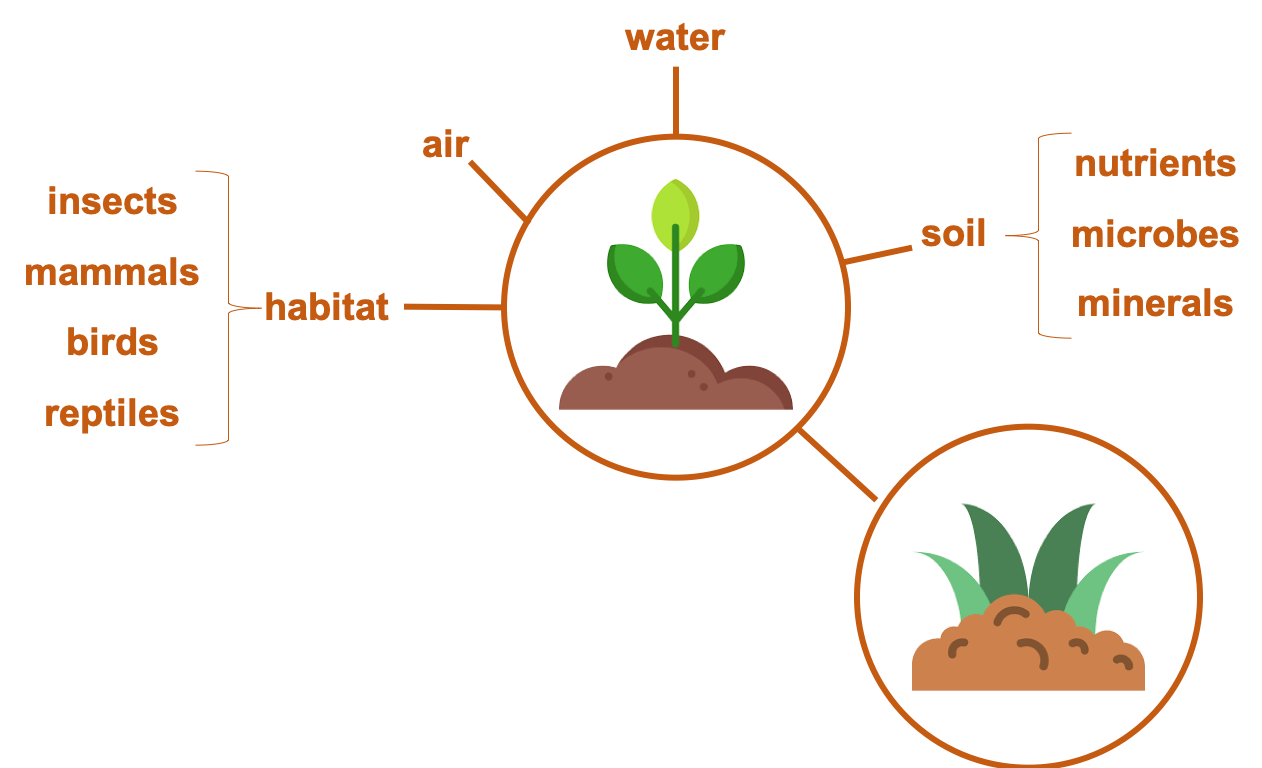
The discipline of rangeland science places a focus on plants and plant communities. A substantial driver underlying this focus is rooted in the grazing management legacy of rangeland science. Although grazing is still a cornerstone, the discipline has evolved to center on sustainable land stewardship with emphasis on ecosystem goods and services delivery, regeneration and resiliency, and social-ecological systems. Plant community composition and production play a critical role in the structure and function of all ecosystems and their ability to deliver ecosystem goods and services. Figure 5.8 hints at the most basic important relationships of plants within an ecosystem; if you think back to introductory ecology you should be able to explain in moderate detail the nature and function of these relationships and how they contribute to ecosystem goods and services delivery. As such we will round out this chapter with a brief focus on plant community ecology, specifically plant functional groups.
Plant Functional Groups
A number of organizing characteristics and attributes can be used to divide plants into functional groups, all of which individually and taken together have value when inventorying and assessing an ecosystem. In this section, we take in a bird’s-eye view of two categories of functional groups: biology and ecosystem function.
Biological Function Groups
Biological function groups to focus on in relation to arid and semiarid environments include but are not limited to (1) life-form (grass, forb, shrub, tree); (2) life cycle (summer annual, winter annual, biennial, perennial); and (3) rooting structure and depth (shallow fibrous; shallow tap root; deep tap root, both fibrous and tap root).
Knowing the relative abundance of grasses, forbs, shrubs, and trees can tell you a lot about the site’s soil stability, hydrologic function, biotic integrity, and resiliency. An arid or semiarid site on which shrubs or trees dominate tells you there is moderate to no understory and that the soil stability, hydrologic function, and biotic integrity of the site are low. A site dominated by grasses and forbs could indicate the opposite, at least in terms of soil stability and hydrologic function. Depending on the degree of invasive species, the biotic integrity may be low.
Often species data gathered focuses on gauging biodiversity, degree of invasion of an invasive species, or abundance of a specific species. These are all vital uses of species-specific data; however, not often is species data used to group and map out the life cycles of vegetation on a site. Knowing the life cycles of the species and their reproductive strategies can guide grazing management, invasive species mitigation, restoration efforts, and so on.
One of the most biologically functional groups in arid and semiarid environments comprises rooting structures and depths—in other words, who is getting the water and when. Knowing this can illuminate competitive interactions among plant species; inform when and where habitat may be available for wildlife and microorganisms; and guide grazing management, restoration efforts, and understanding the hydrology of the site.
Ecosystem Function Groups
Ecosystem function groups to focus on in relation to arid and semiarid environments include but are not limited to (1) nitrogen fixers, (2) habitat, and (3) intra- and interspecific interactions.
Nitrogen is a critical nutrient for plant function and growth. The nitrogen cycle is at work in all ecosystems through denitrification, nitrification, and fixation. Knowing the source and abundance of fixation provides some indication of the nitrogen availability in the system. Knowing the distribution of those sources also gives some indication of where nitrogen may be a limiting factor. This information can be useful for invasive species mitigation, seeding and restoration efforts, grazing management, and so on.
Often when we look at a plant community, we also see wildlife habitat; however, our vision can be somewhat simplistic. Across a site or ecosystem, only specific components are directly related to the habitat available for a specific wildlife species. For example, figure 5.9 shows a sagebrush system, but only specific components and characteristics of the system are sage grouse habitat.
Looking at a plant community through a habit lens across all or target species can guide restoration efforts, grazing management, or any type of land management (e.g., where to construct a road or path, where to place infrastructure such as a water pipeline, etc.).
To be truly strategic in land management efforts, particularly restoration, one would be well served by examining the intra- and interspecific interactions within plant communities and among plant species or plant communities and the broader ecosystem. Taking this approach could identify structural and functional gaps in the system and its degree of biodiversity and resiliency. In upcoming chapters on specific ecosystems, we will engage in thought exercises exploring how elements of these ecosystems are interconnected and what would happen if a system’s plant components were reduced, increased, or completely removed.
